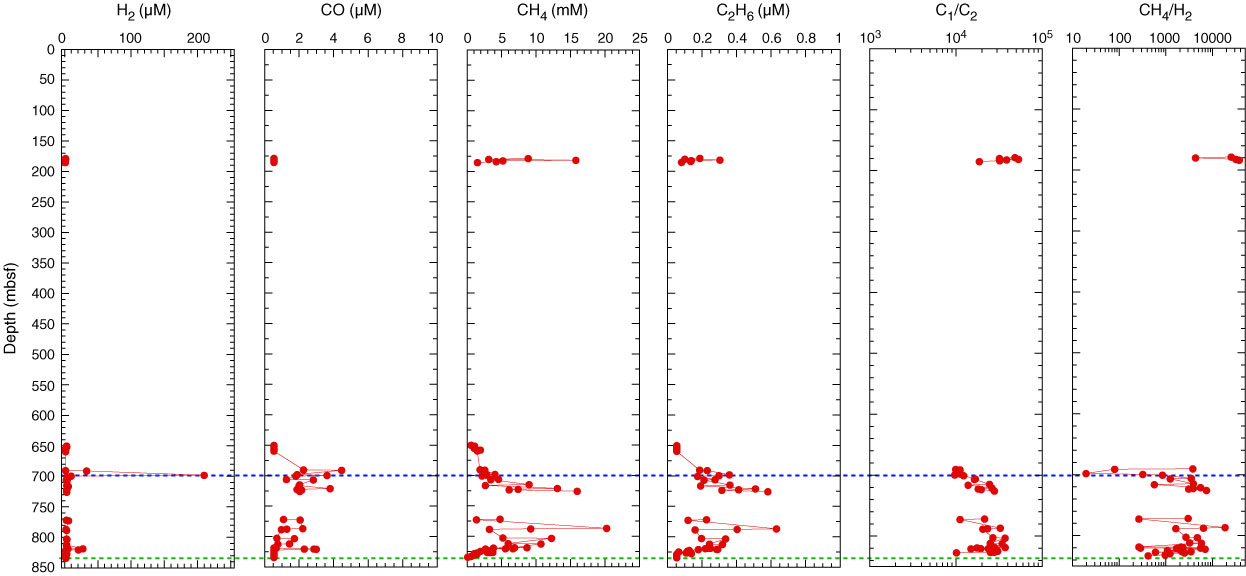
Figure F63. Plots of depth profiles of H2, CO, methane, ethane, methane/ethane ratio, and H2/methane ratio, Hole C0019E. Blue line = horizon of potential earthquake-induced fault slip, green line = depth range of great methane depletion.
Previous | Close | Next | Top of page