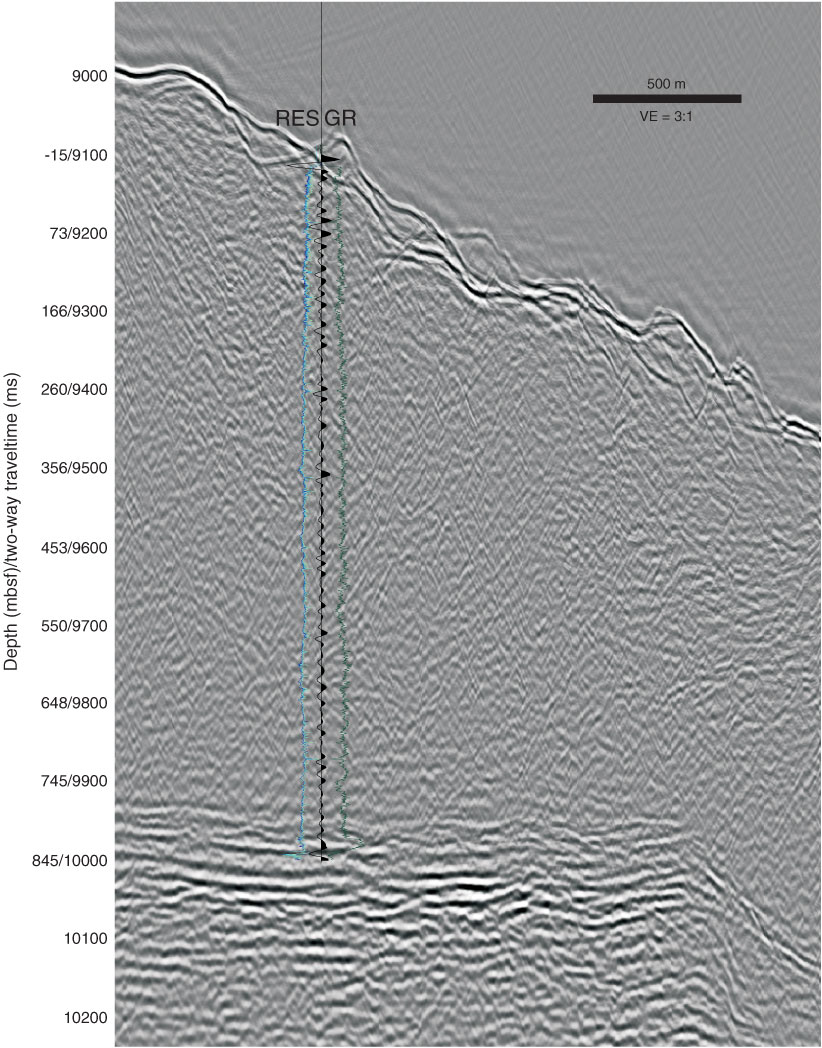
Figure F70. Log curves and synthetic seismogram on Line HD33B, Hole C0019B. The seismic section is in time and log data are overlain using the log-based time-depth curve. The synthetic seismic trace (black) is shown along the wellbore path with gamma ray (GR) (green) and button resistivity (RES) (royal blue = deep, light blue = medium, light green = shallow). VE = vertical exaggeration.
Previous | Close | Next | Top of page