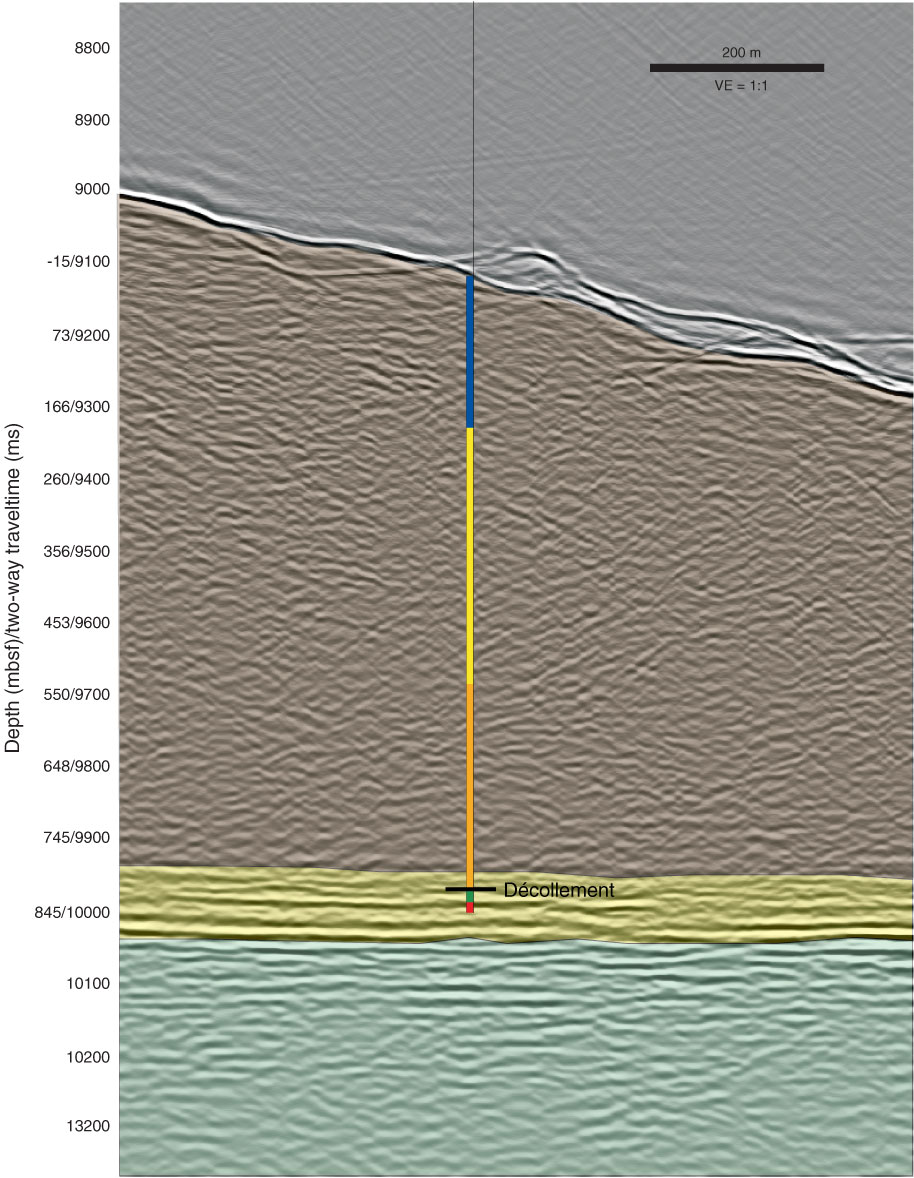
Figure F71. Log units on Line HD33B, Site C0019. The seismic section is in time and log units are overlain using the log-based time-depth curve. Blue = log Unit I, yellow = log Subunit IIa, orange = log Subunit IIb, green = log Unit III, red = log Unit IV. Interpreted seismic units are shown with transparent colors: brown = seismic Unit A, yellow = seismic Unit B, green = seismic Unit C. VE = vertical exaggeration.
Previous | Close | Next | Top of page