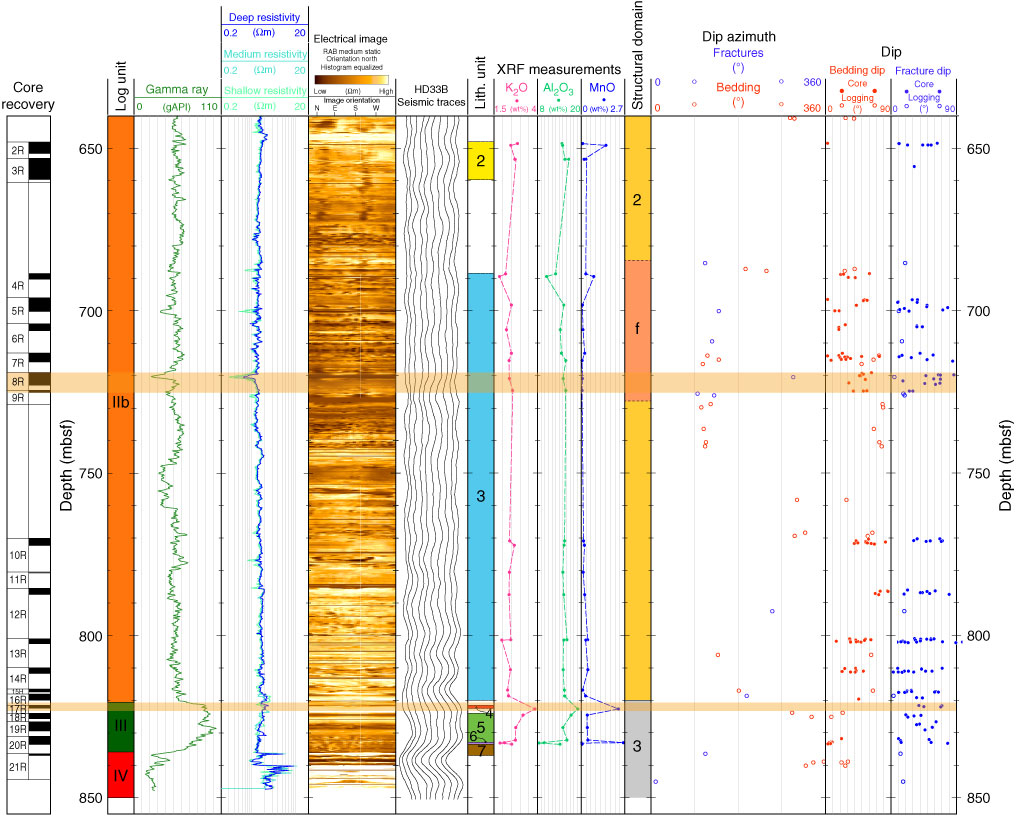
Figure F72. Core-Log-Seismic data structural summary diagram, Site C0019. Core recovery is shown in black for each core length. Log units are defined using LWD data. Gamma ray: green = LWD gamma ray. Resistivity: dark blue = deep button, turquoise = medium button, light green = shallow button LWD data. Lithologic units are defined from visual core description. X-ray fluorescence (XRF) analysis: K2O, Al2O, and MnO equate to potassium, aluminum, and manganese content in core samples, respectively. Structural domains are defined by LWD sinusoid picks on electrical images: f = fracture zone. Azimuth: bedding (red circles) and fracture (blue circles) orientations picked on LWD resistivity at bit images. Bedding dip: open circles = LWD data, filled circles = measured on core; fractures dip: open circles = LWD data, filled circles = measured on core. Orange transparent overlay boxes show fault zones (720 fault and 820 fault) as defined from visual core description. RAB = resistivity at the bit.
Previous | Close | Top of page