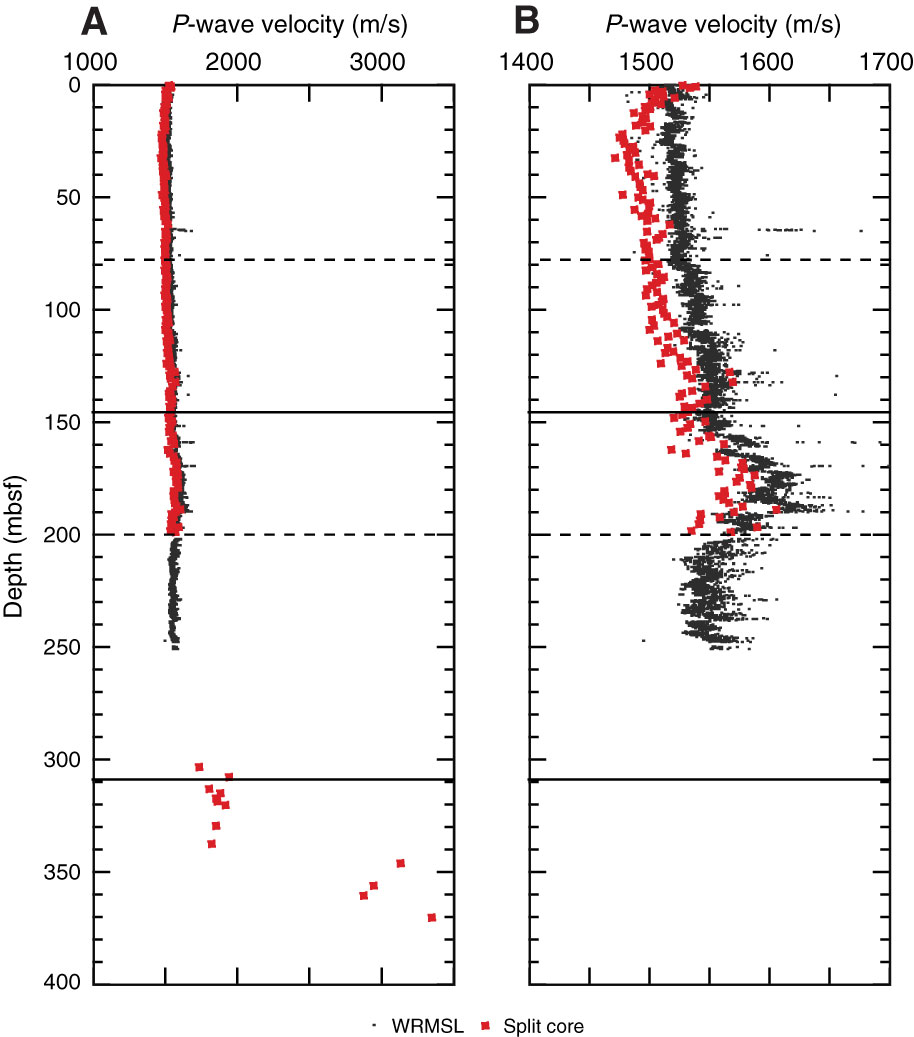
Figure F37. A. P-wave velocity measured on split cores and the Whole-Round Multisensor Logger (WRMSL), Hole U1414A. B. Same data as A, shown with expanded scale to show trends in the shallow portion of the hole. Solid lines = lithostratigraphic unit boundaries, dashed lines = subunit boundaries.
Previous | Close | Next | Top of page