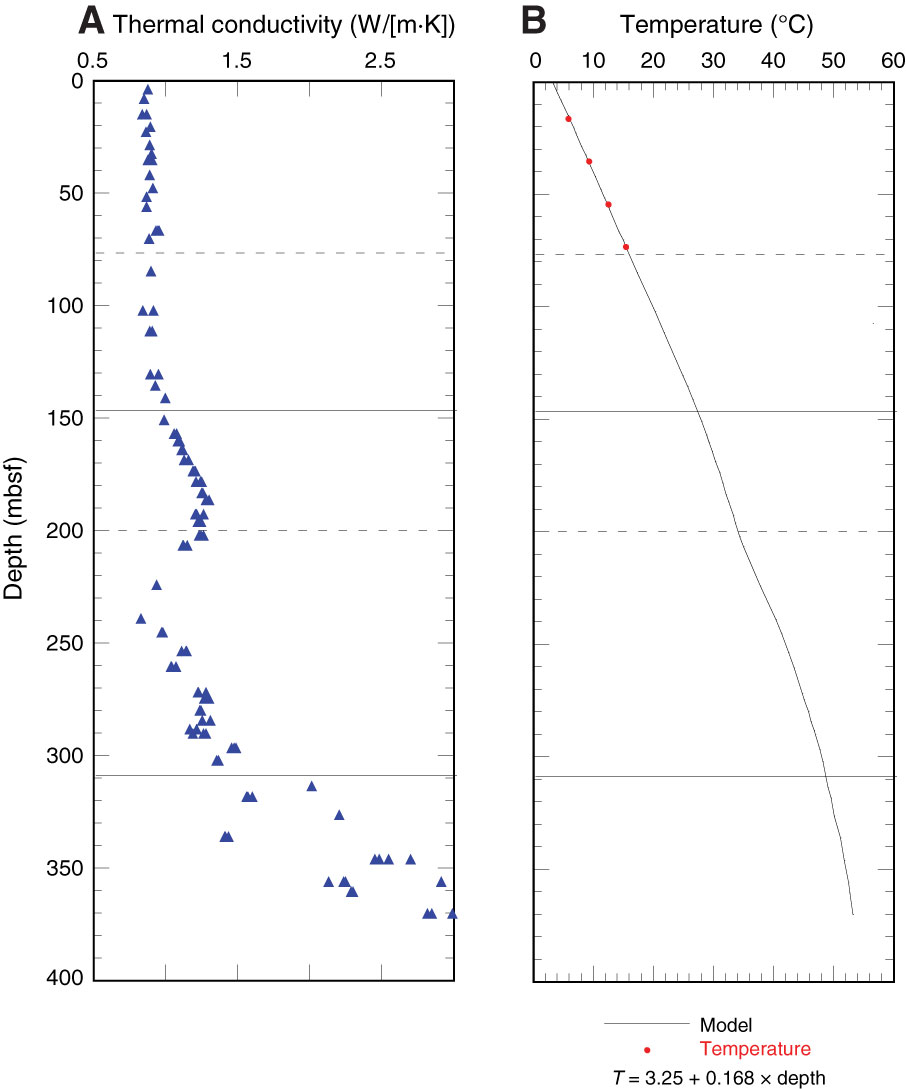
Figure F38. Thermal data, Site U1414. A. Thermal conductivity values. B. Equilibrium temperatures. Equation shows best linear fit to the four measurements, and curve shows extrapolation of temperature as a function of depth. Solid lines = lithostratigraphic unit boundaries, dashed lines = subunit boundaries.
Previous | Close | Next | Top of page