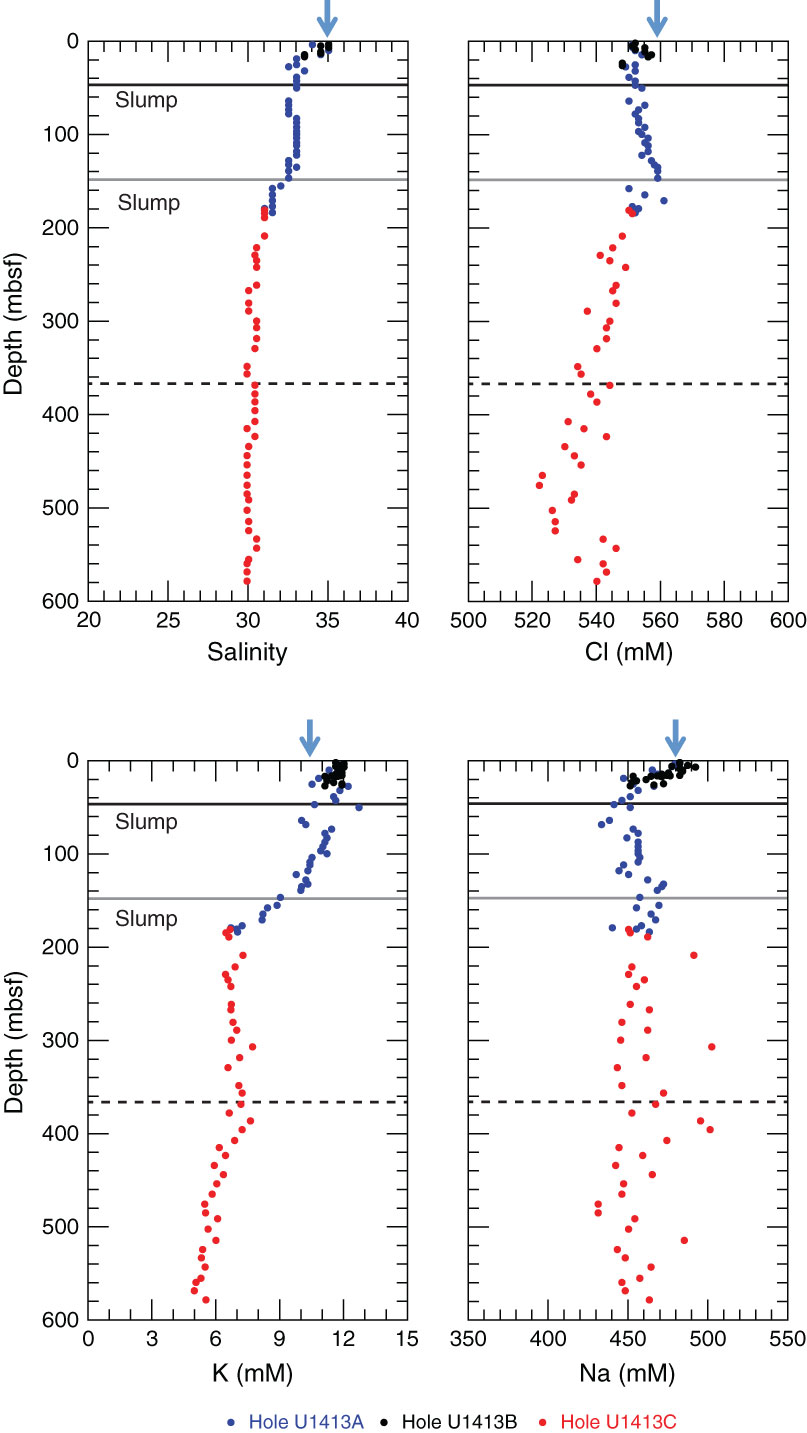
Figure F18. Downhole profiles for salinity, chloride, potassium and sodium, Site U1413. Dashed lines = lithostratigraphic unit boundaries. Solid lines = depths of slumps. Note that the slump at 44.6 mbsf also corresponds to the boundary between lithostratigraphic Units I and II. Blue arrows = bottom seawater values.
Previous | Close | Next | Top of page