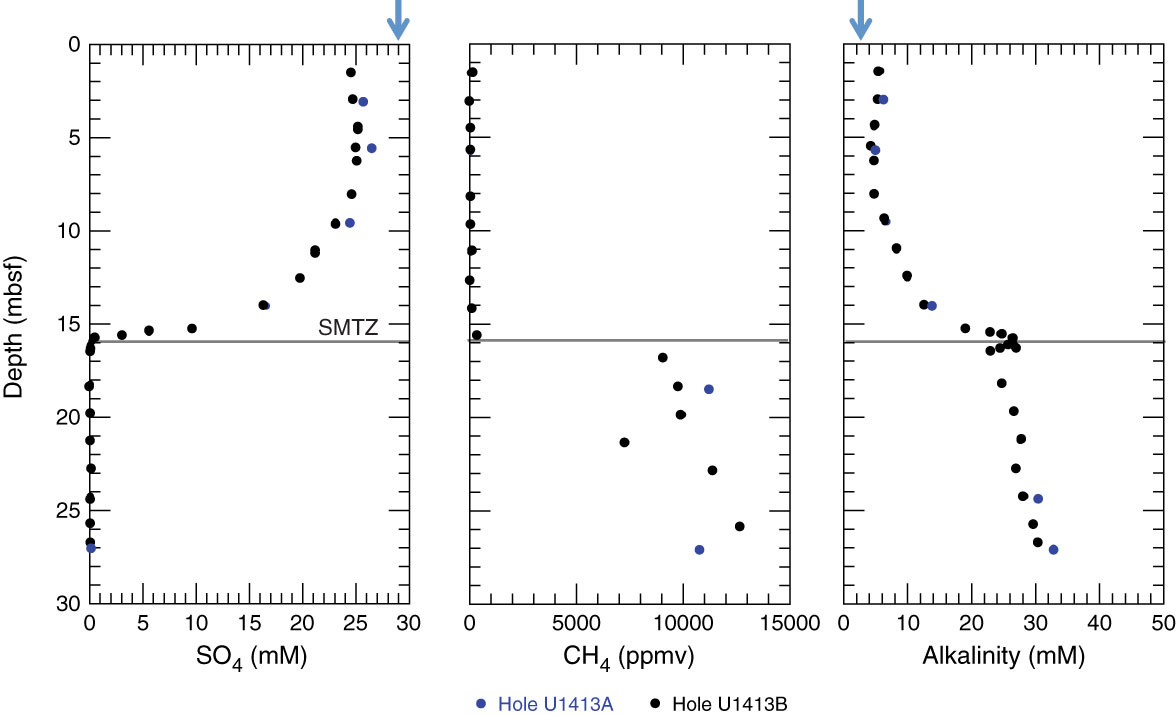
Figure F19. Downhole profiles for sulfate, methane, and alkalinity in the uppermost 30 m of Site U1413. Solid line = sulfate–methane transition zone (SMTZ), the horizon where sulfate is consumed and methane begins to increase with depth. Alkalinity increases rapidly below the SMTZ, suggesting a contribution from anaerobic oxidation of methane. Blue arrows = bottom seawater values.
Previous | Close | Next | Top of page