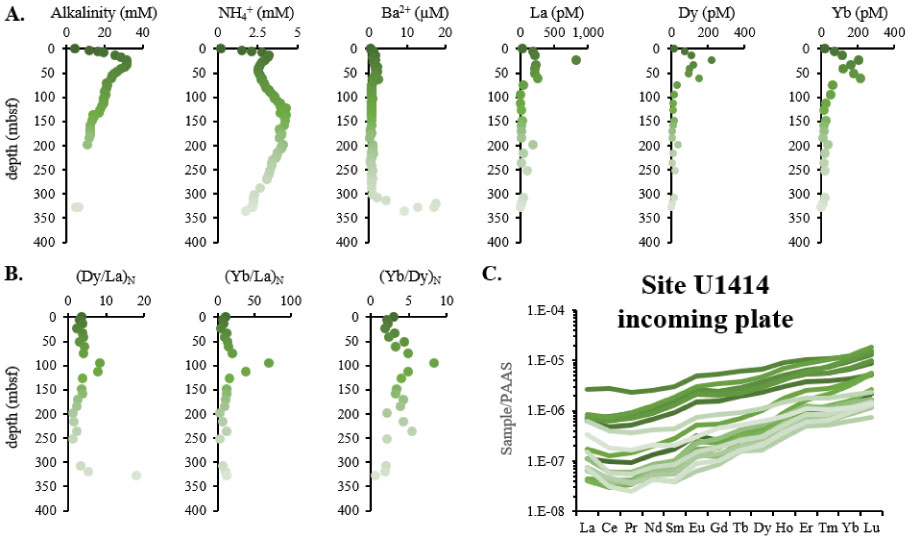
Figure F6. Pore fluid REE concentrations, Site U1414. Darker to lighter colored symbols represent samples from close to the surface of the sediment to increasing depth. A. Alkalinity, NH4+, and Ba2+ (from Harris et al., 2013d) and La, Dy, and Yb concentrations representing the light, middle, and heavy REEs, respectively. B. PAAS-normalized (Tb/La)N, (Yb/La)N, and (Yb/Tb)N ratios showing relative abundances of the light, middle, and heavy REEs to each other. C. PAAS-normalized REE patterns.
Previous | Close | Next | Top of page