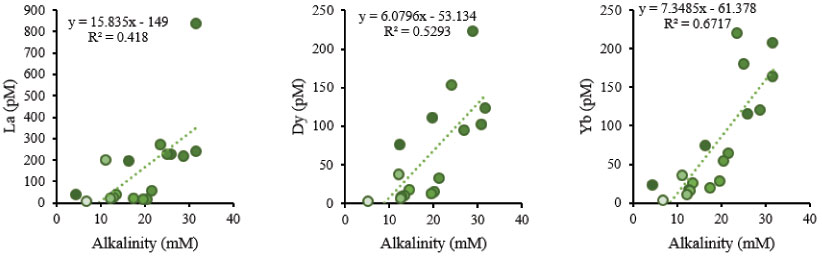
Figure F7. Correlations between pore fluid REE concentrations and alkalinity, Site U1414. Color and shading patterns correlate with depth profile shown in Figure F6. Dotted line = linear regression of all data points.
Previous | Close | Next | Top of page