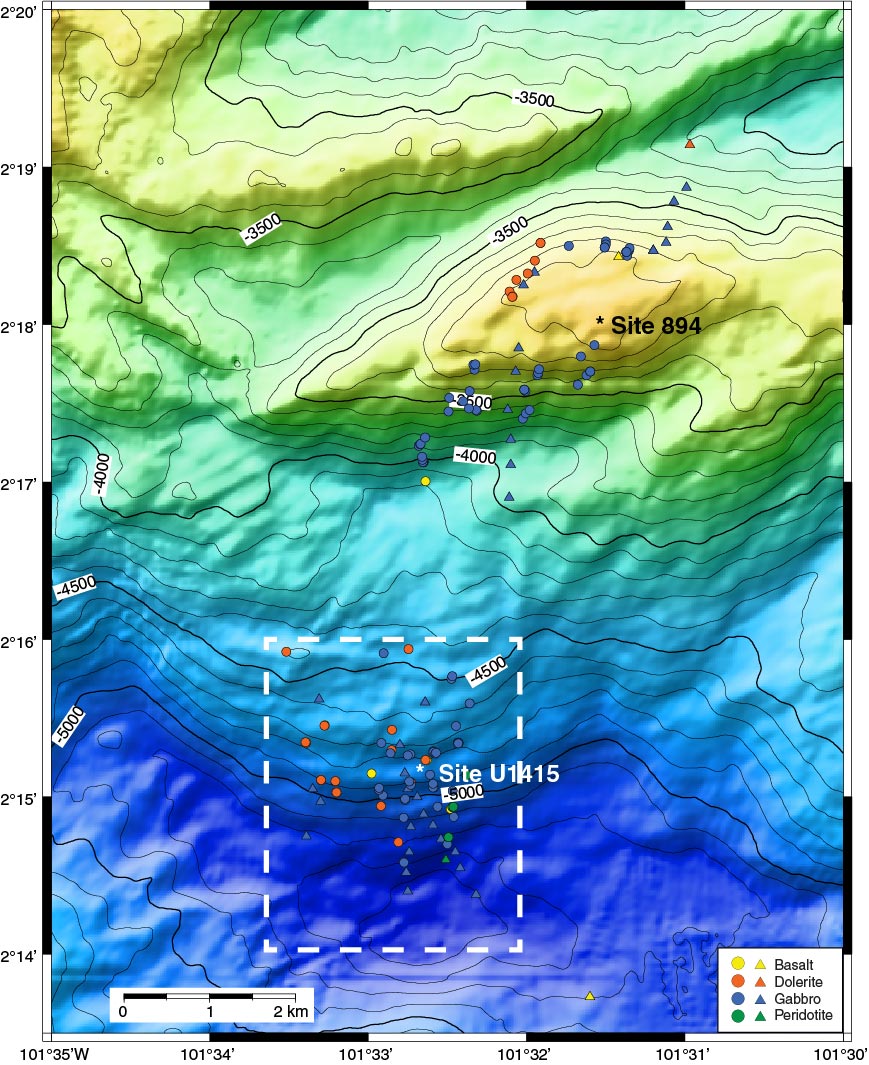
Figure F6. Bathymetric map of the western end of the intrarift ridge and its southern slope showing the distribution of rock types recovered during the NazCoPac submersible cruise (triangles) (Francheteau et al., 1990; Hékinian et al., 1993) and the JC-21 site survey cruise (circles) (MacLeod et al., unpubl. data). Box indicates the area of a smaller scale map of the southern slope shown in Figure F8. See Figure F5 for bathymetric data sources. Contour interval = 100 m.
Previous | Close | Next | Top of page