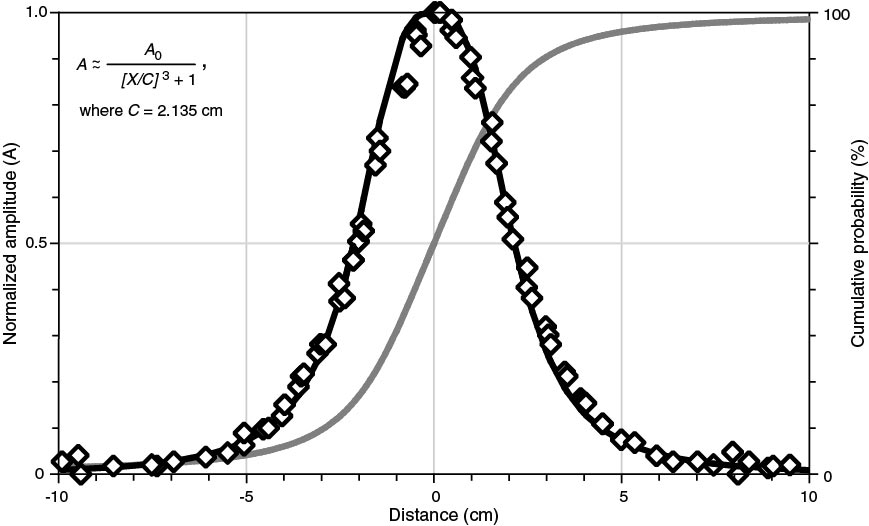
Figure F19. Normalized response curve of the MS2C Bartington magnetic susceptibility meter on the Whole-Round Multisensor Logger (modified after Blum, 1997), Expedition 345. Normalized amplitude (A) of magnetic susceptibility of thin discs against distance from the center of the MS2C coil (x). Amplitudes are normalized against the peak value at zero distance. Black line shows fitted curve based on the inset equation, where the fitted scaling length (C) is about one-fourth of the coil diameter. Gray line shows the cumulative probability function for the fitted curve, indicating that 90% of the measured signal is sourced from within ~4 cm of the coil.
Previous | Close | Next | Top of page