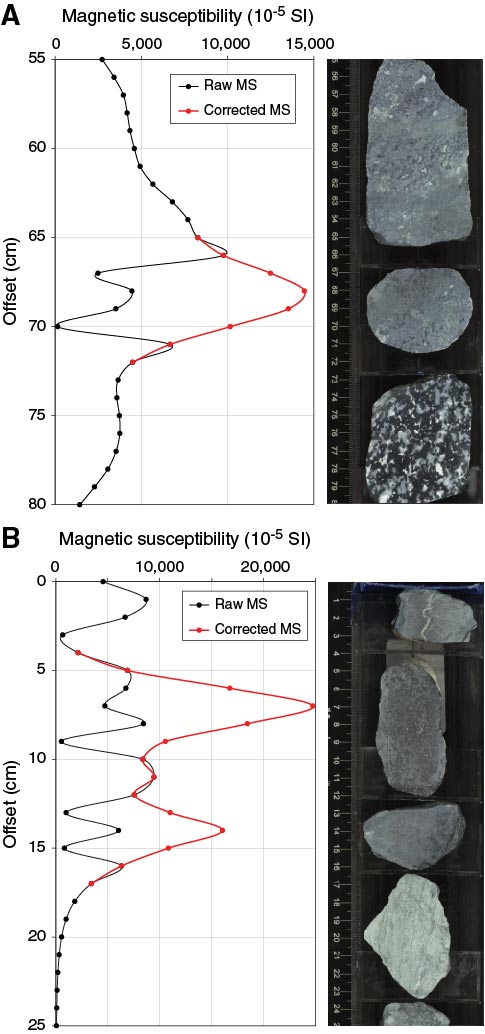
Figure F20. Corrected magnetic susceptibility (MS) data from the Whole-Round Multisensor Logger when the susceptibility is higher than the maximum value recorded by the instrument (9999 × 10–5 SI), Expedition 345. The corrected curve (red) is obtained by adding 10,000 (or more; 20,000 for one point in B) to the clipped data points. A. Interval 345-U1415J-18R-1, 55–80 cm. B. Interval 345-U1415J-21R-1, 0–25 cm.
Previous | Close | Next | Top of page