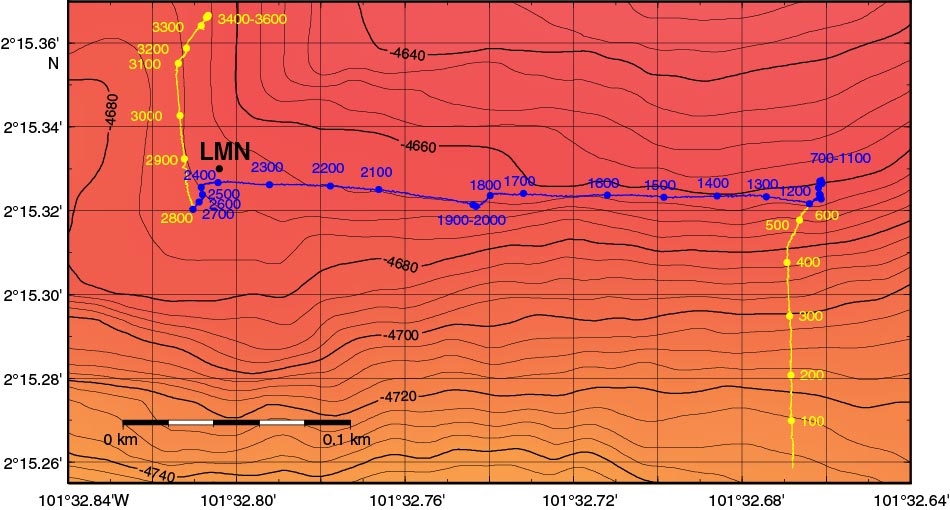
Figure F9. Pinger survey recorded on 9 January 2013, Expedition 345. The numbers are the sequential numbers of the traces. The data recorded along the blue and yellow sections are shown in Figure F10. Microbathymetry from Ferrini et al. (2013). Contour interval = 5 m.
Previous | Close | Next | Top of page