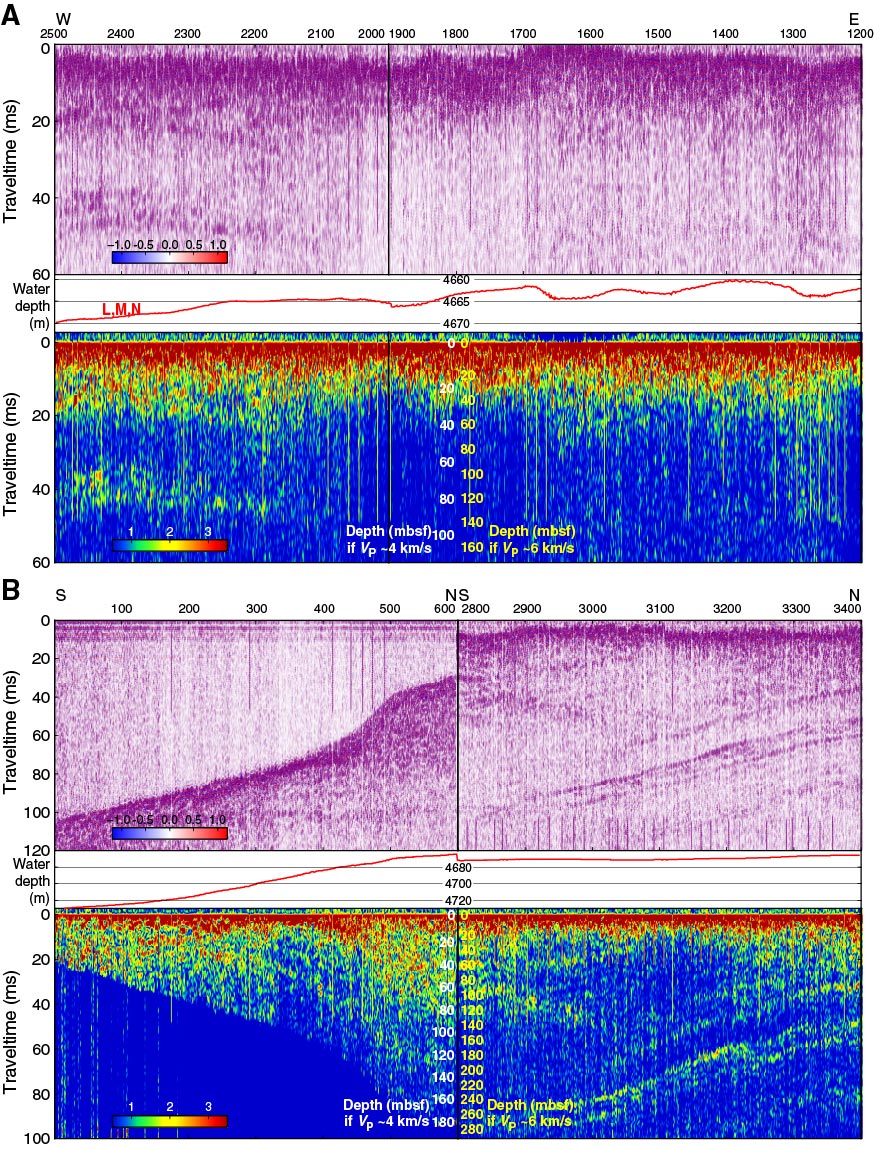
Figure F10. Subbottom profiler data recorded during the 9 January 2013 survey, Expedition 345. A. East–west transect (blue in Fig. F9). B. North–south branches recorded at the beginning and the end of the survey (yellow in Fig. F9). See Figure F5 for details. The approximate locations of Holes U1415L–U1415N are shown on the bathymetry profile.
Previous | Close | Next | Top of page