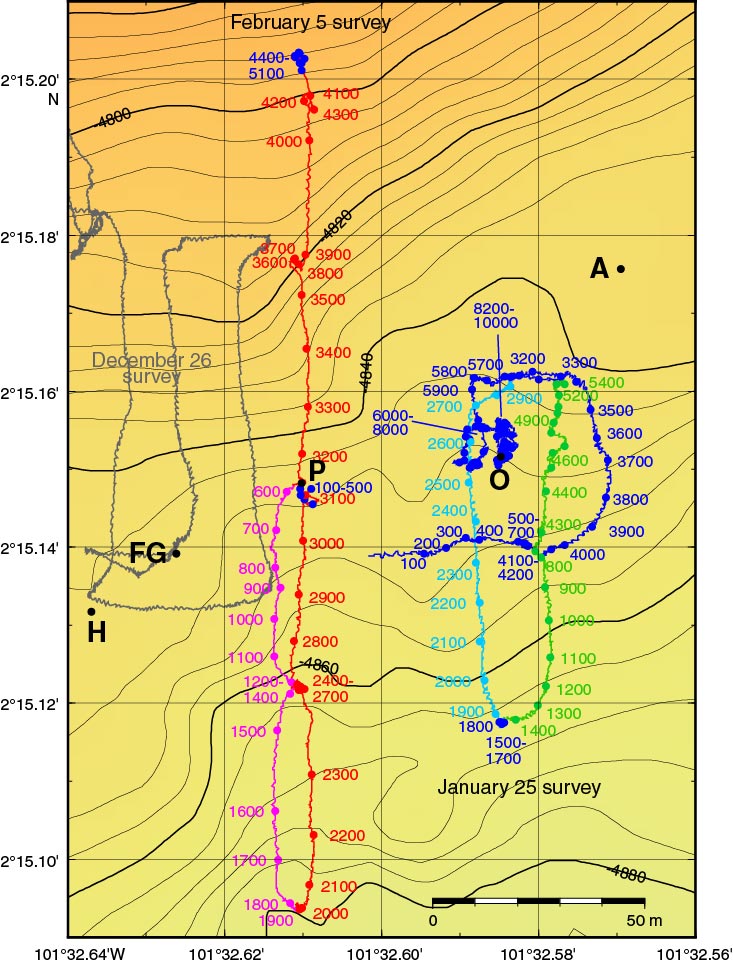
Figure F11. Pinger survey recorded on 25 January and 5 February 2013, Expedition 345. The numbers are the sequential numbers of the traces. The data recorded along the green and cyan sections of the 25 January survey are shown in Figure F12. The data recorded along the red and purple sections of the 5 February survey are shown in Figure F13. The eastern side of the 26 December survey is also shown. Microbathymetry from Ferrini et al. (2013). Contour interval = 5 m.
Previous | Close | Next | Top of page