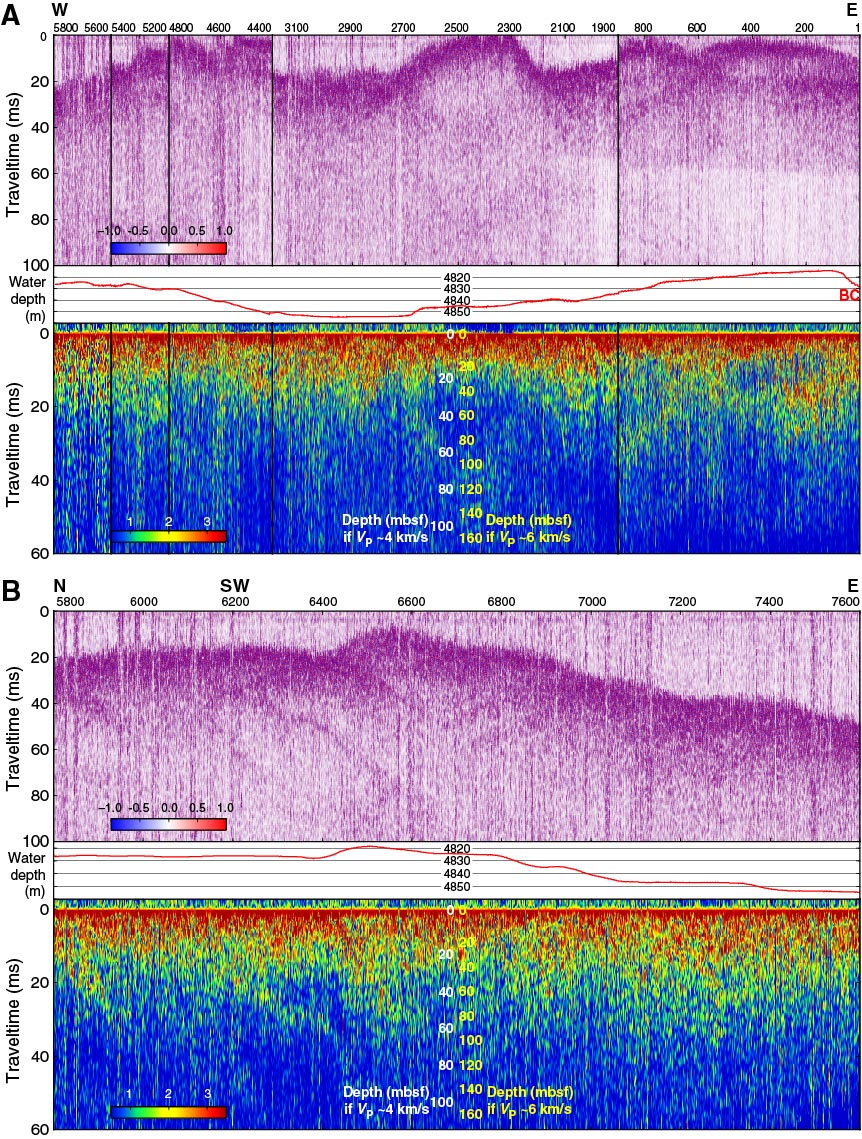
Figure F5. Subbottom profiler data recorded during the 23 December 2012 survey, Expedition 345. Traces recorded while the ship and the pinger were stationary have been removed. Upper panels show the data after filtering and equalization. The perception of the seafloor depth is biased by the variations in depth of the vibration-isolated television frame. The center panels show the water depth along the survey track, as extracted from the microbathymetry data recorded by the remotely operated vehicle Isis (Ferrini et al., 2013). The lower panels show the instantaneous amplitude of the traces after being shifted to the seafloor. Depth below seafloor is estimated from the velocity profiles shown in Figure F2. Microbathymetry data from Ferrini et al. (2013). A. Northern segment of the survey (blue in Fig. F4). BC = approximate location of Holes U1415B and U1415C. B. Western and southern segments (red in Fig. F4). Numbers are the sequential trace numbers that can be used to tie the images to their location on the map in Figure F4.
Previous | Close | Next | Top of page