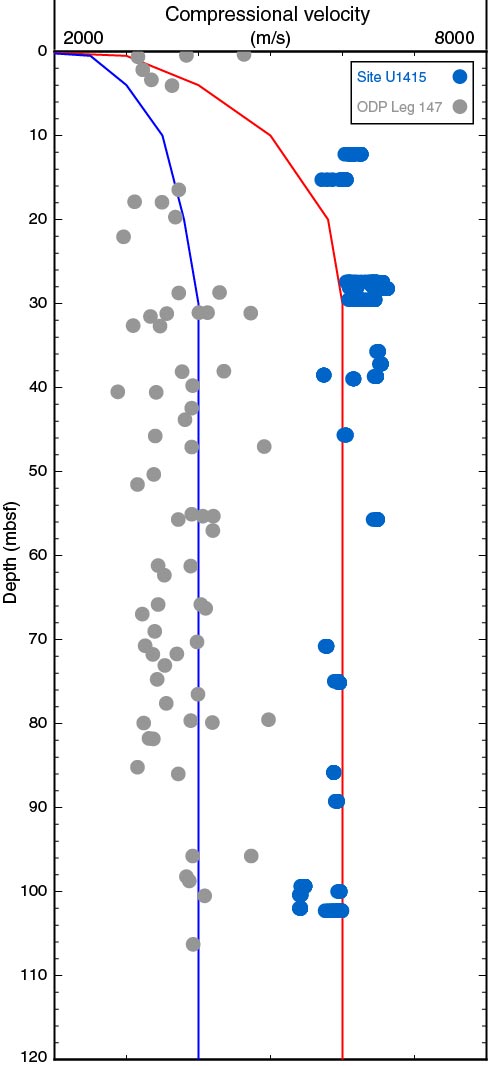
Figure F2. Velocity profiles used to convert traveltime in pinger images to depth. The two solid lines, with velocity at depth around 4 and 6 km/s, were constrained by the vertical velocity measurements made on core samples from Site U1415 and Ocean Drilling Program (ODP) Leg 147. The lower velocity curve, derived from Site 895 measurements of serpentinized peridotite, probably represents a lower bound on the potential velocities to be expected in the formation (white depth scales in Figs. F5, F7, F10, F12, F13).
Previous | Close | Next | Top of page