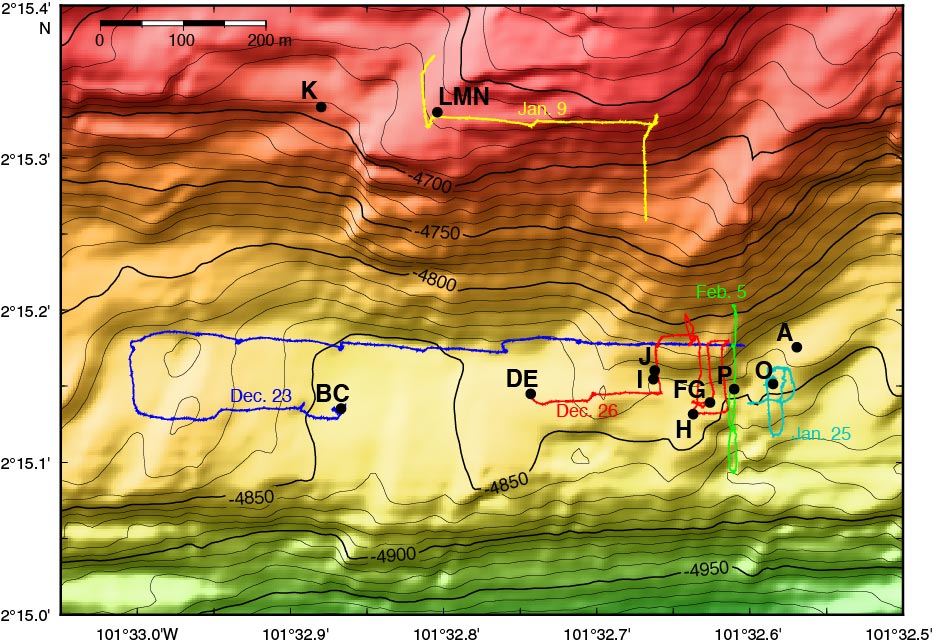
Figure F3. Subbottom profiler survey location and tracks and locations of all holes drilled at Site U1415. Surveys were recorded on 23 (blue) and 26 (red) December 2012, on 9 (yellow) and 25 (cyan) January 2013, and on 5 (green) February 2013. Microbathymetry data from Ferrini et al. (2013). Contour interval = 10 m.
Previous | Close | Next | Top of page