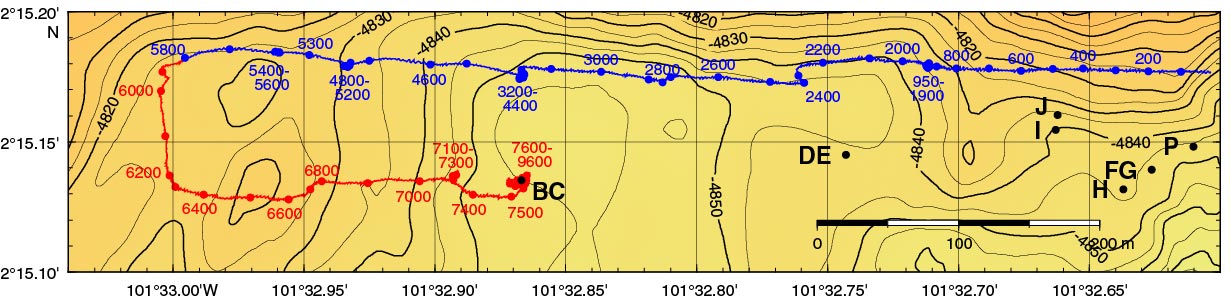
Figure F4. Pinger survey recorded on 23 December 2012, Expedition 345. Numbers on the tracks are the sequential numbers of the traces recorded at an approximate rate of 1 trace per second. Letters refer to the holes drilled. Data recorded along the blue and red sections are shown in Figure F5. Microbathymetry from Ferrini et al. (2013). Contour interval = 5 m.
Previous | Close | Next | Top of page