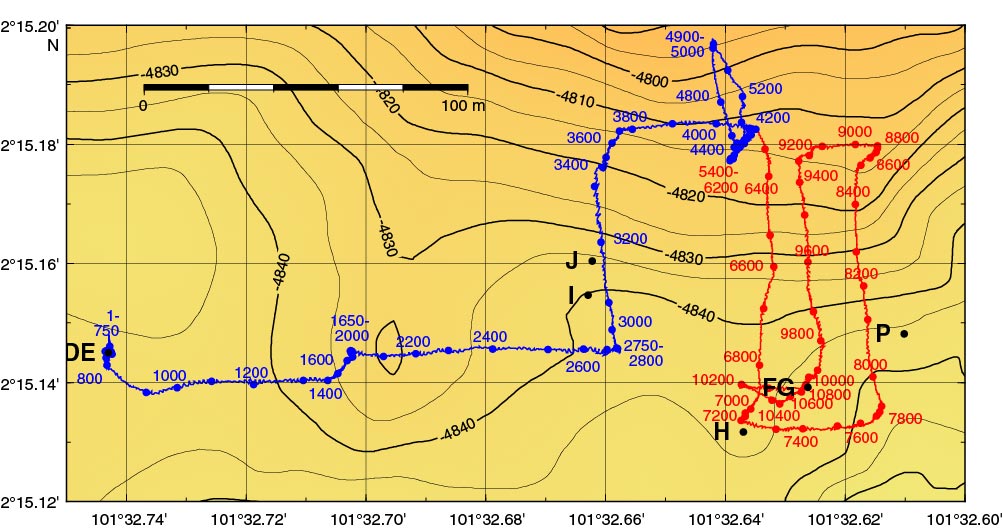
Figure F6. Pinger survey recorded on 26 December 2012, Expedition 345. The numbers on the tracks are the sequential numbers of the traces. The data recorded along the blue and red sections are shown in Figure F7. Microbathymetry from Ferrini et al. (2013). Contour interval = 5 m.
Previous | Close | Next | Top of page