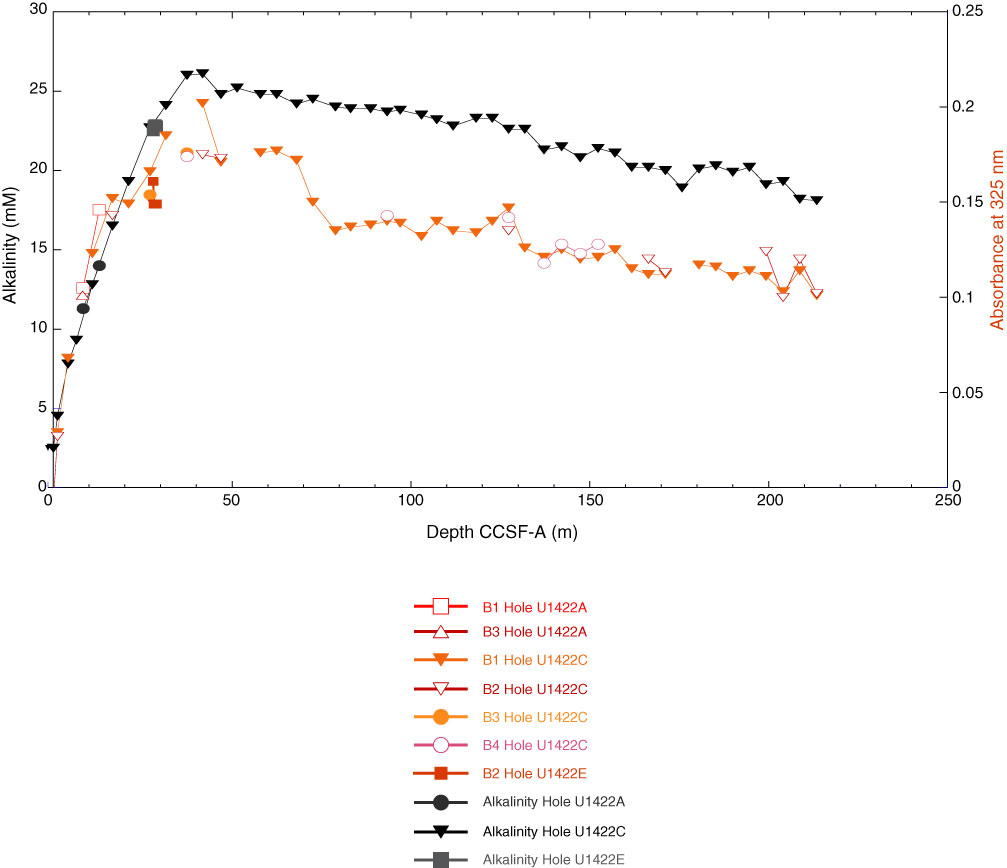
Figure F27. Yellowness and alkalinity versus depth, Site U1422. Symbols represent samples from different holes analyzed in different batches (Tables T11, T14) and demonstrate the reproducibility of the absorbance measurements at 325 nm.
Previous | Close | Next | Top of page