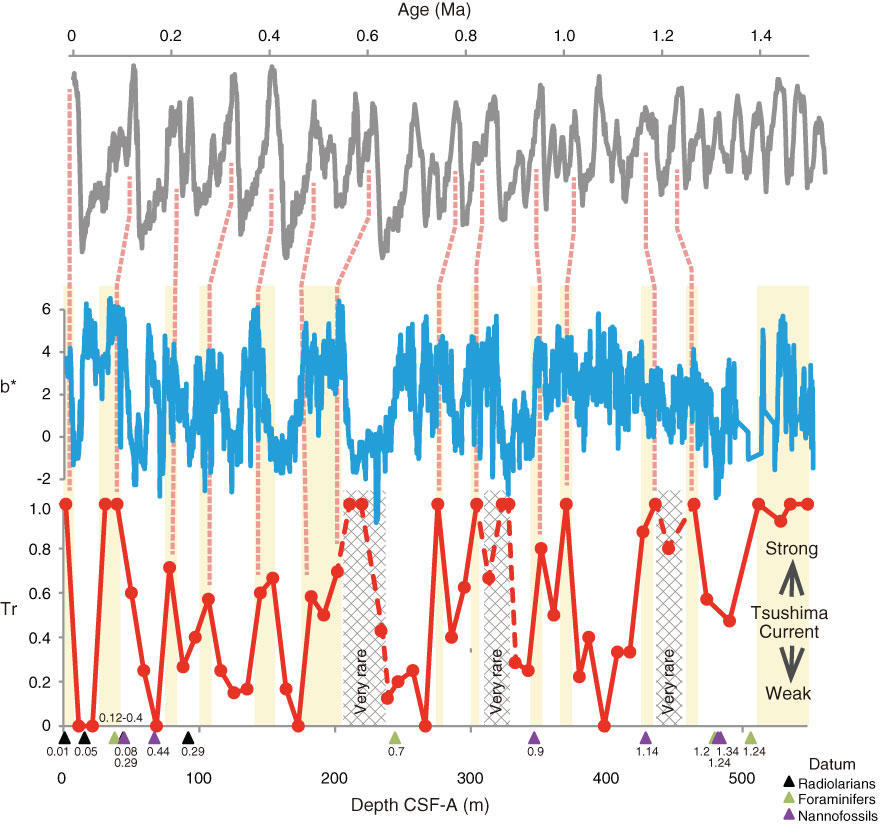
Figure F18. Variations of b* (blue line) and Tr value (red line) with positions of biostratigraphic datums (triangles under the depth scale, see Table T4), Site U1427. Marine isotope curve of LR04 (Lisiecki and Raymo, 2005) is also shown (gray line). Yellow hatches indicate intervals of high Tr values. Probable correlations between Tr peaks and corresponding interglacial periods are shown by pink dashed lines.
Previous | Close | Next | Top of page