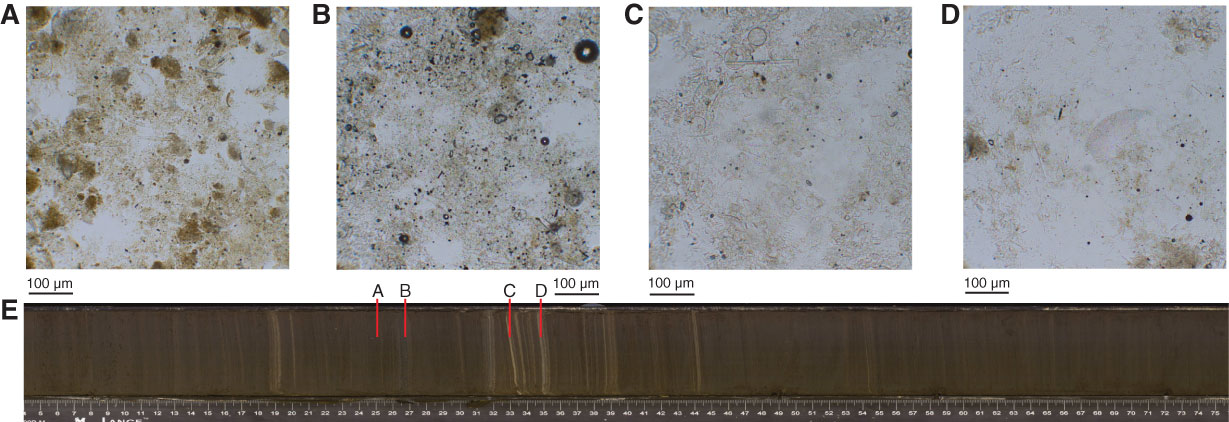
Figure F20. A–D. Smear slide images showing lithologic changes between different color laminations of Subunit IIIA. A. Section 346-U1430A-24H-5, 25 cm. B. Section 24H-5, 26.5 cm. C. Section 24H-5, 33 cm. D. Section 24H-5, 35 cm. E. Photograph of full Section 346-U1430A-24H-5.

Previous | Close | Next | Top of page