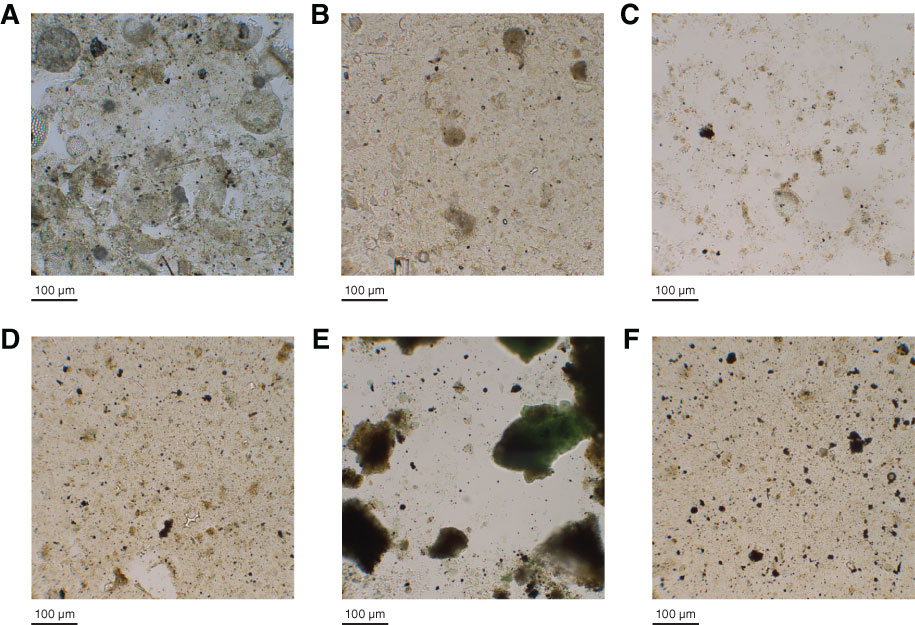
Figure F21. Smear slide images showing typical variations in diatom content. A. Section 346-U1430A-7H-6, 120 cm. B. Section 28H-1, 75 cm. C. Section 28H-2, 145 cm. D. Section 29H-1, 75 cm. E. Section 29H-1, 96 cm. F. Section 29H-3, 75 cm. Note that diatoms dramatically decrease deeper than Section 28H-2, 145 cm.
Previous | Close | Next | Top of page