Previous | Close | Next
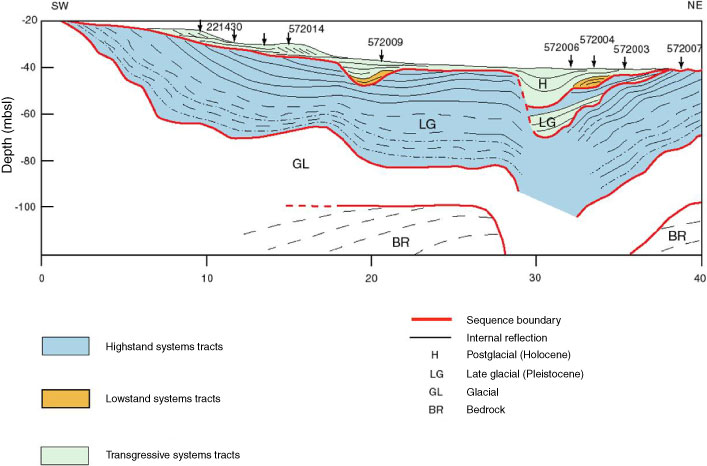
Figure F13. Interpreted cross section of a sparker profile from Jensen et al. (2002), running parallel to transect A–B (Fig. F12). Penetration is ~70 m, but the base of the depression was not imaged.
Previous | Close | Next | Top of page