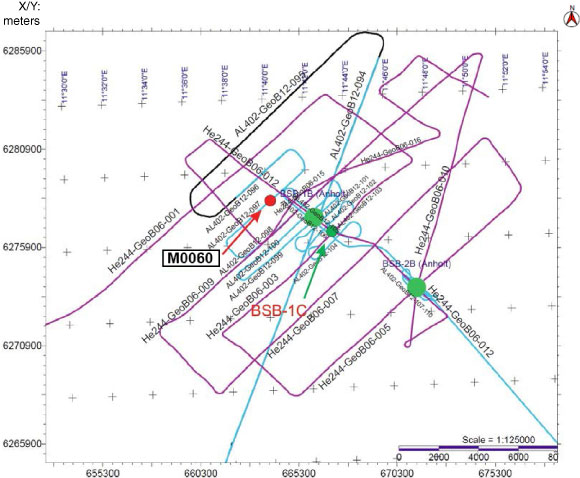
Figure F14. Chart of seismic tracks from the Anholt area. Purple lines = data from RV Heincke cruise He244 in 2006, light blue and black lines = data from RV Alkor cruise AL402 in 2012. Green dots indicate locations of originally proposed Sites BSB-1B and BSB-2B. Red dot = position of Site M0060 on seismic Line AL402-GeoB12-097.
Previous | Close | Next | Top of page