Previous | Close | Next
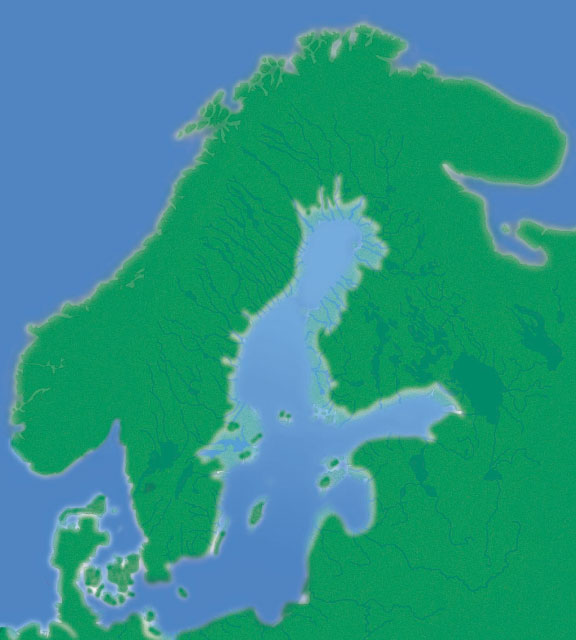
Figure F6. Paleogeographic map showing the Littorina Sea stage of Baltic Sea history during the most saline phase at ~6.5 ka BP.
Previous | Close | Next | Top of page