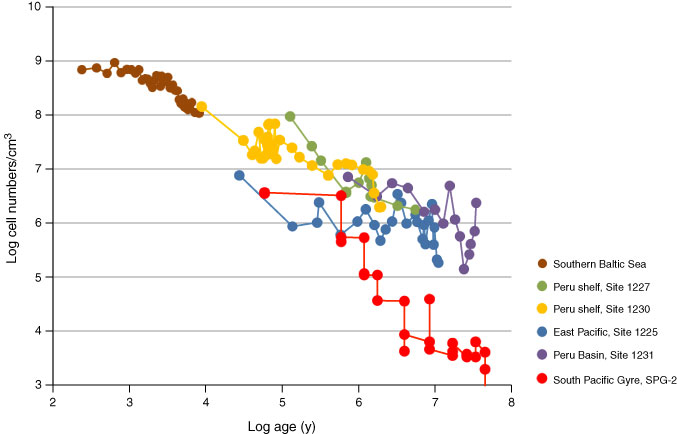
Figure F7. Distribution of microbial cells in the seabed. The double-logarithmic plot shows examples of cell numbers per cubic centimeter and how these decrease with the age of the sediment, ranging from a hundred years to a hundred million years. Cell counts from the Baltic Sea, 108–109 cells/cm3, are compared to data from the Pacific Ocean where counts drop below 104 cells/cm3 in the oldest sediments of the most nutrient poor area, the South Pacific Gyre. Data compiled from the Baltic Sea (B. Cragg and R.J. Parkes, unpubl. data), Ocean Drilling Program sites (D’Hondt et al., 2003), and the South Pacific Gyre (D’Hondt et al., 2009). Modified from Jørgensen (2012).
Previous | Close | Next | Top of page