Previous | Close | Next
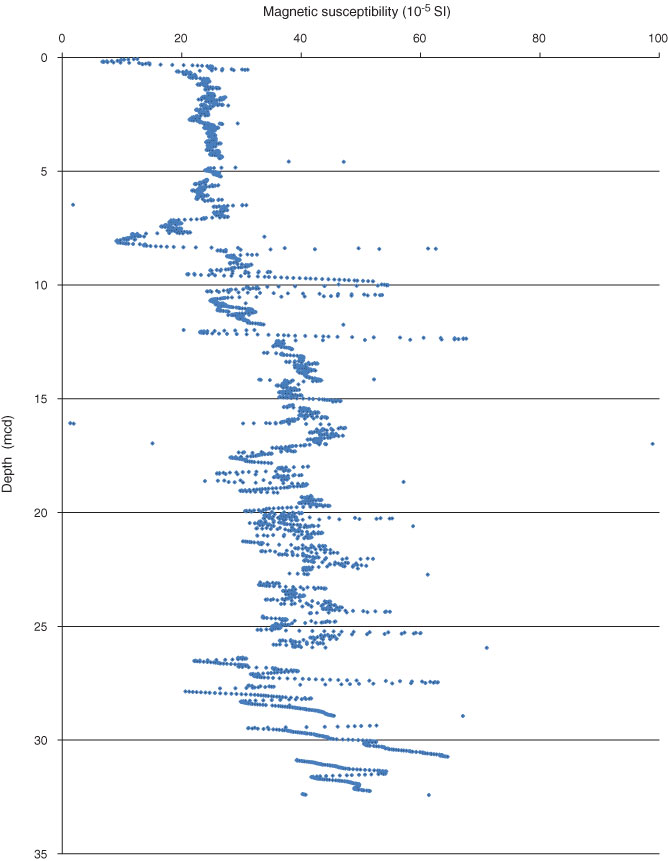
Figure F18. Plot of spliced magnetic susceptibility data, Site M0062.
Previous | Close | Next | Top of page