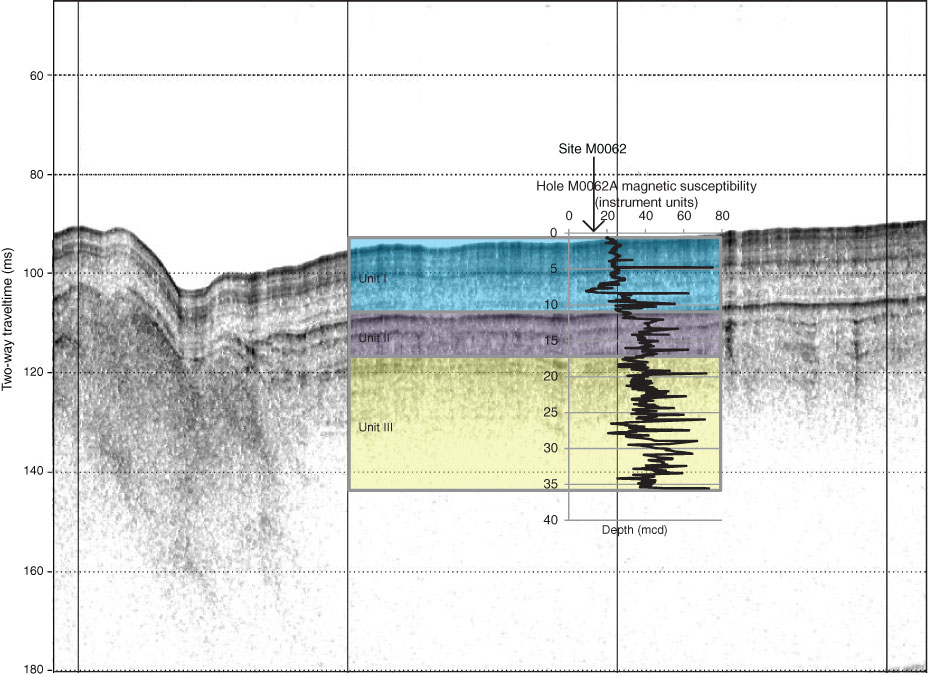
Figure F19. Correlation of seismic profile with lithologic boundaries and multisensor core logger magnetic susceptibility data (Hole M0062A), Site M0062. Units shown in figure are seismic Units I, II, and III that correspond to lithostratigraphic Subunits Ia and Ib and Unit II, respectively.

Previous | Close | Next | Top of page