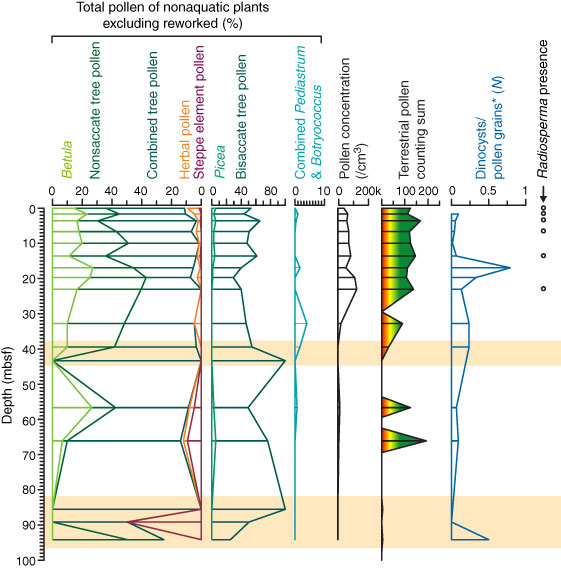
Figure F11. Simplified pollen diagram with dinocyst and further palynomorph data, as well as pollen concentration and pollen grain counting sums, Hole M0063A. Shaded bars = samples with low counting sums (not depicted in Fig. F10).
Previous | Close | Next | Top of page