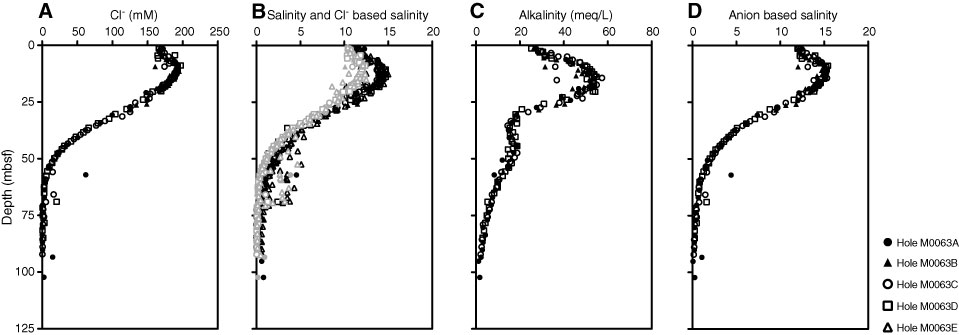
Figure F12. Concentrations of (A) chloride, (B) salinity calculated from refractive index (black symbols) and chloride-based salinity (gray symbols), (C) alkalinity, and (D) anion-based salinity in interstitial water samples, Site M0063.

Previous | Close | Next | Top of page