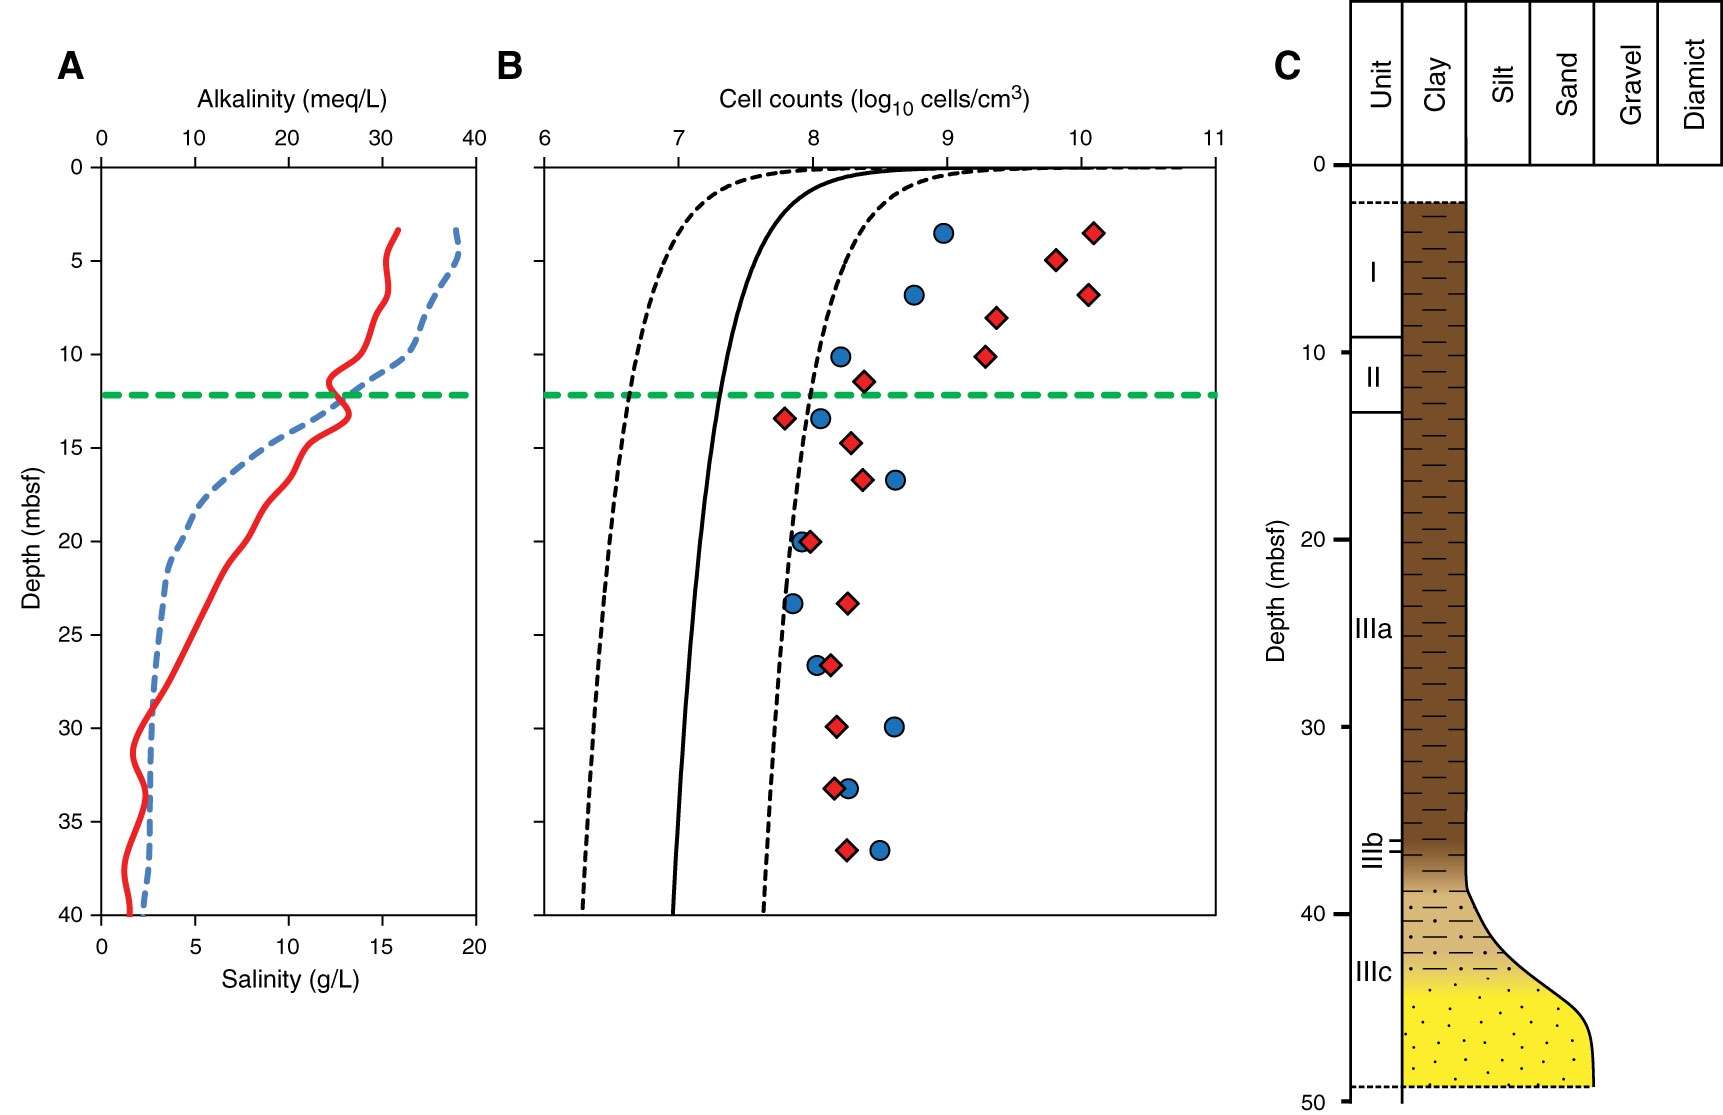
Figure F19. Plot of microbial cell abundances compared to chemical zonation and lithostratigraphy, Hole M0065C. A. Interstitial water alkalinity (blue dashed line) and salinity (red line). Green dashed line marks the boundary at ~12 mbsf; cell counting techniques produce similar results at deeper depths. B. Cell numbers obtained by flow cytometry (blue circles) and acridine orange direct count (red diamonds). Solid black line = global regression line of prokaryote cell numbers with depth, dashed lines = upper and lower 95% prediction limits for regression line (Roussel et al., 2008). Green dashed line marks the boundary at ~12 mbsf; cell counting techniques produce similar results at deeper depths. C. Lithology.
Previous | Close | Next | Top of page