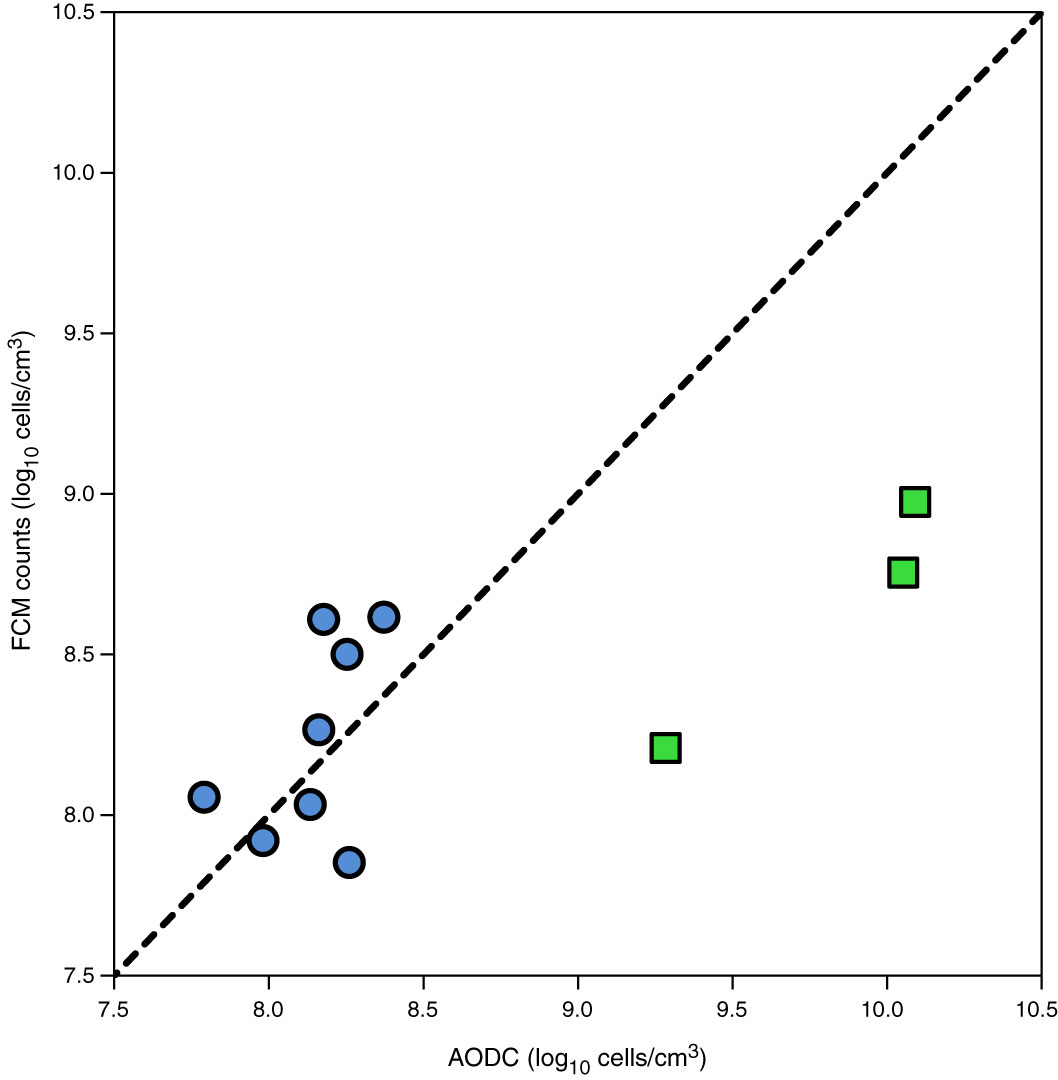
Figure F20. Comparison of paired counts between two methods of cell enumeration, Hole M0065C. Blue circles = results from deeper than 12 mbsf, green squares = results from shallower than 12 mbsf. Black dashed line = line of unity. FCM = flow cytometry, AODC = acridine orange direct count.
Previous | Close | Next | Top of page