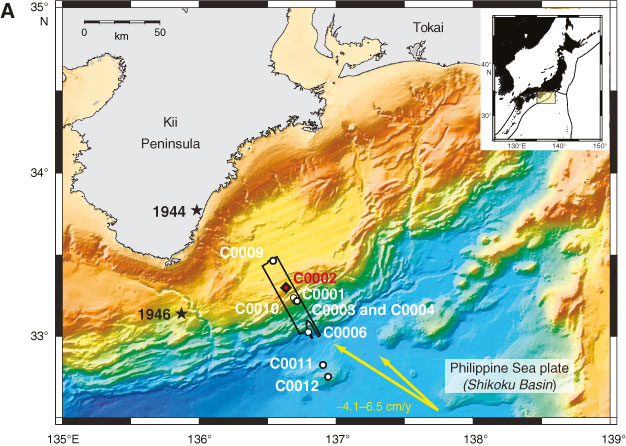
Figure F1. A. Map of the NanTroSEIZE region showing all Stage 1, 2, and 3 drill sites. Red = Expedition 348 Site C0002, white = other NanTroSEIZE sites. Black outline = region with 3-D seismic data, yellow arrows = estimated far-field vectors between Philippine Sea plate and Japan (Seno et al., 1993; Heki, 2007). Stars = epicenter locations of 1944 and 1946 tsunamigenic earthquakes. (Continued on next page.)
Close | Next | Top of page