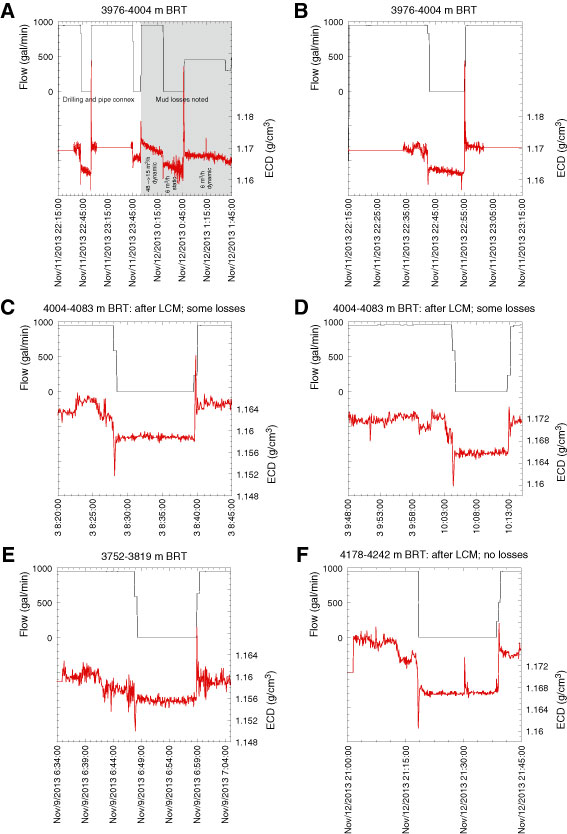
Figure F2. Equivalent circulating density (ECD) from measured annular pressure while drilling at Site C0002 as a function of time, showing changes in pressure during pipe connections as the pumps were turned off and on: A. Drilling from 3976 to 4004 m BRT, including a time when large mud losses were observed (gray shaded area); B. Detailed view of a pipe connection immediately preceding the mud losses at bit depth of 4004 m BRT. C, D. Detailed views of pipe connections while drilling from 4004 to 4083 m BRT after mud losses and addition of lost circulation material (LCM). E. Example of a pipe connection prior to mud losses while drilling from 3752 to 3819 m BRT. F. Example of pipe connection while drilling the deepest part of the hole after further mud losses at 4083 m BRT and addition of more LCM.
Previous | Close | Next | Top of page