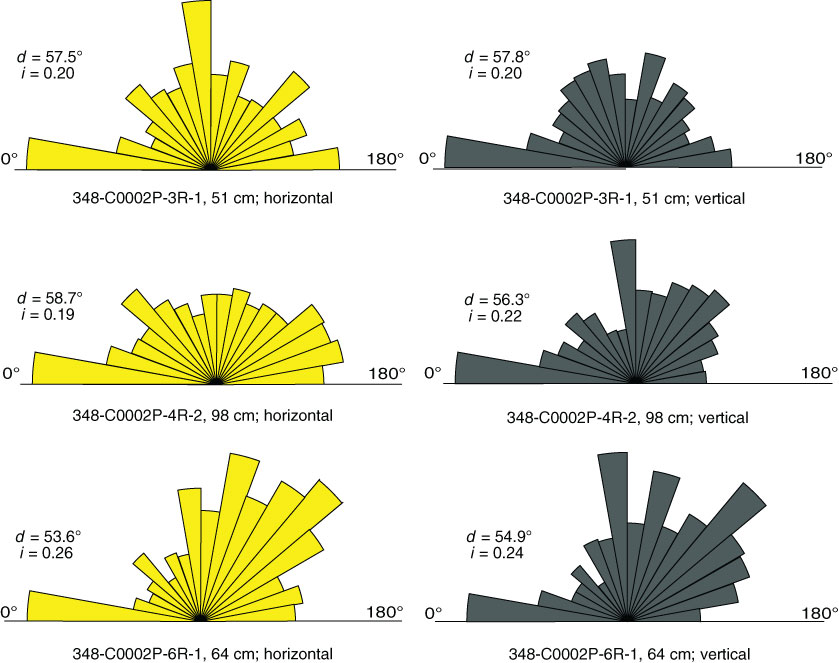
Figure F13. Orientation of grains (apparent long axis) measured on ESEM images. Relative to the core axis, sections were cut parallel (vertical) and perpendicular (horizontal). See Figure F7 for the corresponding ESEM images. Also shown are values of standard deviation (d) for grain orientation and values of microfabric orientation index (i).
Previous | Close | Next | Top of page