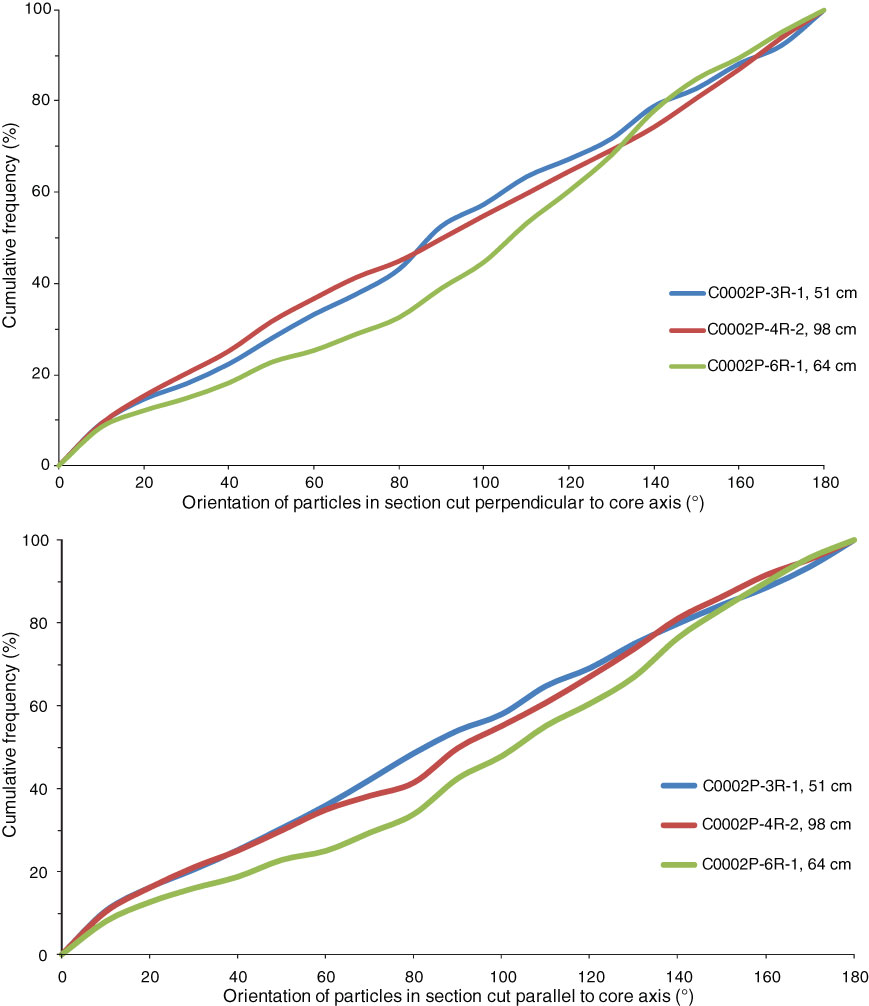
Figure F14. Cumulative frequency curves of grain orientations (apparent long axes) in Hole C0002P derived from analysis of ESEM images on horizontal (perpendicular to core axis) and vertical (parallel to core axis) sections. Linear trends are indicative of random grain orientations.
Previous | Close | Next | Top of page