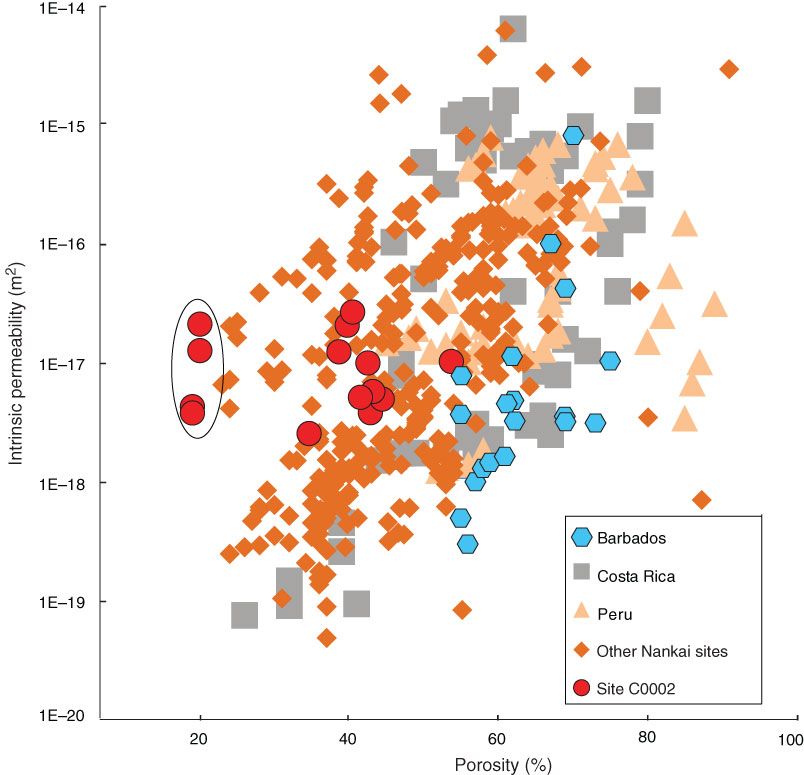
Figure F17. Relation between intrinsic permeability and post-test porosity for specimens from different subduction zones. See Figure F16 for sources of data. Circled symbols highlight deeper core specimens from Hole C0002P (this study).
Previous | Close | Top of page