Tamura, Y., Busby, C.J., Blum, P., and the Expedition 350 Scientists, 2015
Proceedings of the International Ocean Discovery Program Volume 350
publications.iodp.org

doi:10.14379/iodp.proc.350.101.2015
Expedition 350 summary1
Y. Tamura, C.J. Busby, P. Blum, G. Guèrin, G.D.M. Andrews, A.K. Barker, J.L.R. Berger, E.M. Bongiolo, M. Bordiga, S.M. DeBari, J.B. Gill, C. Hamelin, J. Jia, E.H. John, A.-S. Jonas, M. Jutzeler, M.A.C. Kars, Z.A. Kita, K. Konrad, S.H. Mahony, M. Martini, T. Miyazaki, R.J. Musgrave, D.B. Nascimento, A.R.L. Nichols, J.M. Ribeiro, T. Sato, J.C. Schindlbeck, A.K. Schmitt, S.M. Straub, M.J. Vautravers, and Y. Yang2
Keywords: International Ocean Discovery Program, IODP, JOIDES Resolution, Expedition 350, Site U1437, Site U1436, Izu-Bonin-Mariana, IBM, prehnite, rear arc, seamount, Manji, tuffaceous mud, volcaniclastic, hyaloclastite, zircon, Neogene, ash, pumice, tuff, lapilli, Quaternary, breccia, peperite, rhyolite, intrusive, subduction, glass, continental crust, fore arc, density current, turbidite, fall deposit, tephra, greigite, volcano-bounded basin, VBB, hemipelagic mud, caldera, andesite, pXRF, ICP-AES, bioturbation, hydrothermal alteration, smectite, hornblende, sulfide reduction, fiamme, diagenesis, Aogashima, Kuroshio, explosive volcanism, submarine volcanism
MS 350-101: Published 30 May 2015
Abstract
International Ocean Discovery Program (IODP) Hole U1436A (proposed Site IBM-4GT) lies in the western part of the Izu fore-arc basin, ~60 km east of the arc-front volcano Aogashima, ~170 km west of the axis of the Izu-Bonin Trench, and 1.5 km west of Ocean Drilling Program (ODP) Site 792, at 1776 meters below sea level (mbsl). It was drilled as a 150 m deep geotechnical test hole for potential future deep drilling (5500 meters below seafloor [mbsf]) at proposed Site IBM-4 using the D/V Chikyu. Core from Site U1436 yielded a rich record of Late Pleistocene explosive volcanism, including a distinctive black glassy mafic ash layer that may record a large-volume subaqueous eruption on the Izu arc front. Because of the importance of this discovery, Site U1436 was drilled in three additional holes (U1436B, U1436C, and U1436D), as part of a contingency operation, in an attempt to get better recovery on the black glassy mafic ash layer and its enclosing sediments and to better constrain its thickness.
IODP Site U1437 is located in the Izu rear arc, ~330 km west of the axis of the Izu-Bonin Trench and ~90 km west of the arc-front volcanoes Myojinsho and Myojin Knoll, at 2117 mbsl. The primary scientific objective for Site U1437 was to characterize “the missing half of the subduction factory” because numerous ODP/Integrated Ocean Drilling Program sites had been drilled in the arc-front to fore-arc region (i.e., ODP Site 782A Leg 126), but this was the first site to be drilled in the rear-arc region of the Izu arc. A complete view of the arc system is needed to understand the formation of oceanic arc crust and its evolution into continental crust. Site U1437 on the rear arc had excellent core recovery in Holes U1437B and U1437D, and we succeeded in hanging the longest casing ever in the history of R/V JOIDES Resolution scientific drilling (1085.6 m) in Hole U1437E and cored to 1806.5 mbsf.
The stratigraphy at Site U1437 was divided into seven lithostratigraphic units (I–VII) that were distinguished from each other based on the proportions and characteristics of tuffaceous mud/mudstone and interbedded tuff, lapilli-tuff, and tuff-breccia. The section is much more mud rich than expected, with ~60% tuffaceous mud for the section as a whole (89% in the uppermost 433 m) and high sedimentation rates of 100–260 m/My for the upper 1320 m (Units I–V). The proportion (40%) and grain size of volcaniclastics are much smaller than expected for an intra-arc basin, composed half of ash/tuff and half of lapilli-tuff of fine grain size (clasts <3 cm). These volcaniclastics were deposited by suspension settling through water and from density currents, in relatively distal settings. Volcanic blocks are only sparsely scattered through the lowermost 25% of the section (Units VI and VII, 1320–1806.5 mbsf), which includes hyaloclastite, in situ quench-fragmented blocks, and a rhyolite peperite intrusion (i.e., proximal deposits). The transition from unconsolidated to lithified rocks occurred progressively; however, sediments were considered lithified from 427 mbsf (top of Hole U1437D) downward. Alteration resulted in destruction of fresh glass from ~750 mbsf downward, but minerals are less altered. Because of the alteration, the deepest biostratigraphic datum was at ~850 mbsf and the deepest paleomagnetic datum was at ~1300 mbsf. Additional age control deeper than ~1300 mbsf is provided by an age range of 10.97–11.85 Ma inferred from a nannofossil assemblage at ~1403 mbsf and a preliminary U-Pb zircon concordia intercept age of 13.6 +1.6/−1.7 Ma, measured postcruise on a rhyolite peperite in Unit VI at ~1390 mbsf.
Based on the seismic profiles, the Miocene–Oligocene hiatus (~17–23 Ma) was predicted to lie at ~1250 mbsf, but strata at that depth (Unit V, 1120–1312 mbsf) are much younger (~9 Ma), indicating that we recovered a thicker Neogene section of volcaniclastics and associated igneous rocks than anticipated. Our preliminary interpretation of shipboard geochemistry of solids is that arc-front versus rear-arc sources can be distinguished for individual intervals in the upper, relatively distal 1320 m of the section (Units I–V), whereas data for the lower, proximal 25% of the section (Units VI–VII) overlap and exceed the compositional fields for Neogene rear-arc seamounts and Quaternary arc-front volcanoes. This suggests that the compositional divergence between arc-front and rear-arc magmas only fully developed after ~13 Ma.
Background and objectives
Expedition 350 was one of three closely related International Ocean Discovery Program (IODP) expeditions carried out in sequence in the Izu-Bonin-Mariana (IBM) arc system in 2014 (Figures F1, F2, F3). Expedition 350 was the first expedition to drill in the Izu rear arc; all previous Integrated Ocean Drilling Program sites were drilled in or near the Izu-Bonin arc front or fore arc (Figure F1B), leading to an incomplete view of Izu arc magmatism. Thus, the main objective of Expedition 350 was to reveal the history of “the missing half” of the subduction factory (Tamura et al., 2013). The second expedition (351) will focus on IBM arc origins by drilling west of the Kyushu-Palau Ridge (Figure F3), where it is inferred that the foundation, origin, and early evolution of the IBM arc are recorded (Arculus et al., 2013). The third expedition (352) will examine the processes of subduction initiation, by drilling the outer IBM fore arc (Pearce et al., 2013).
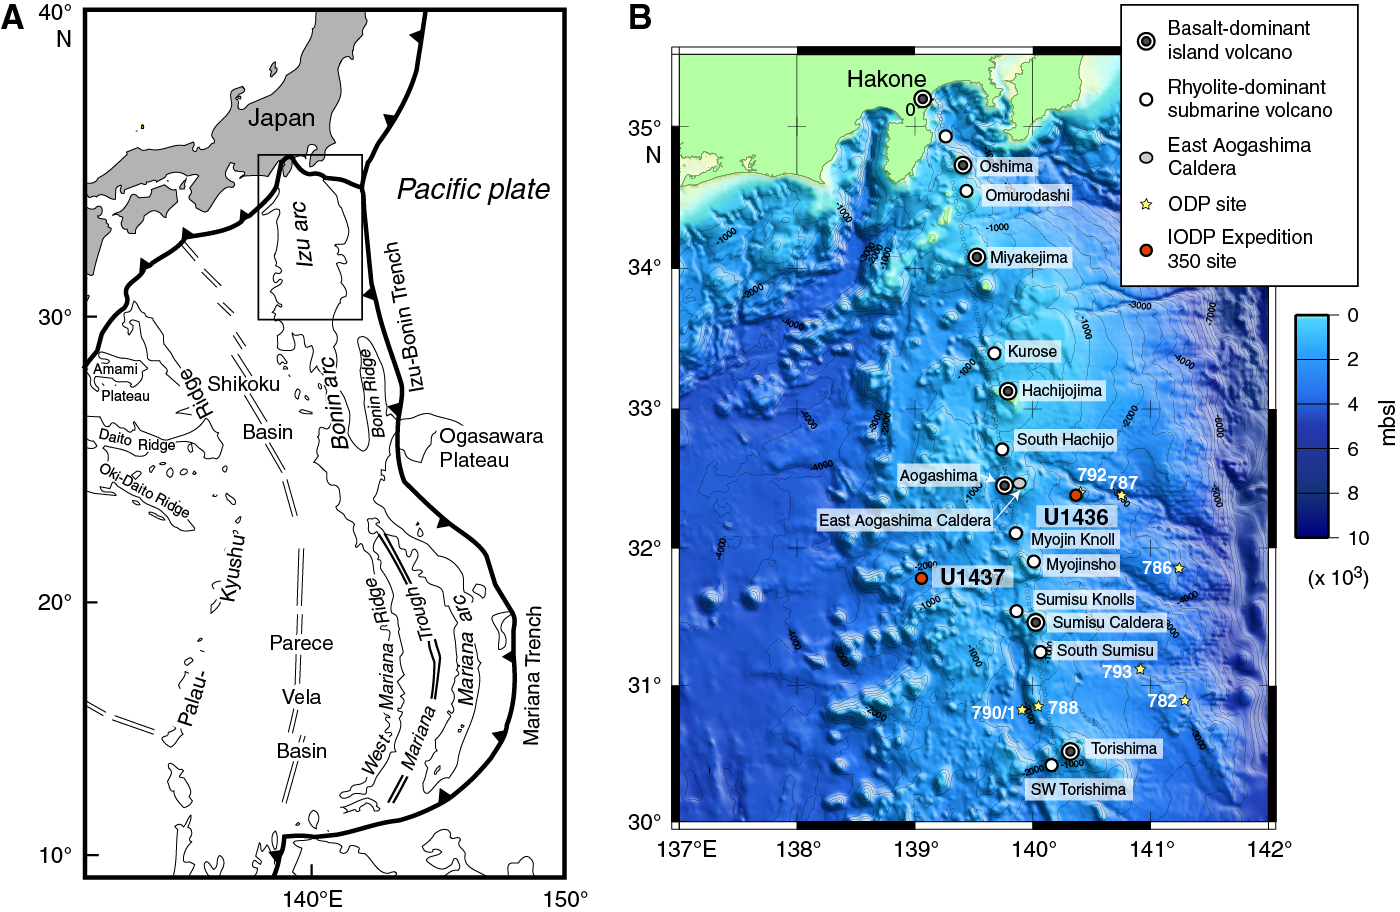
Figure F1. Tectonic setting of IBM arc.
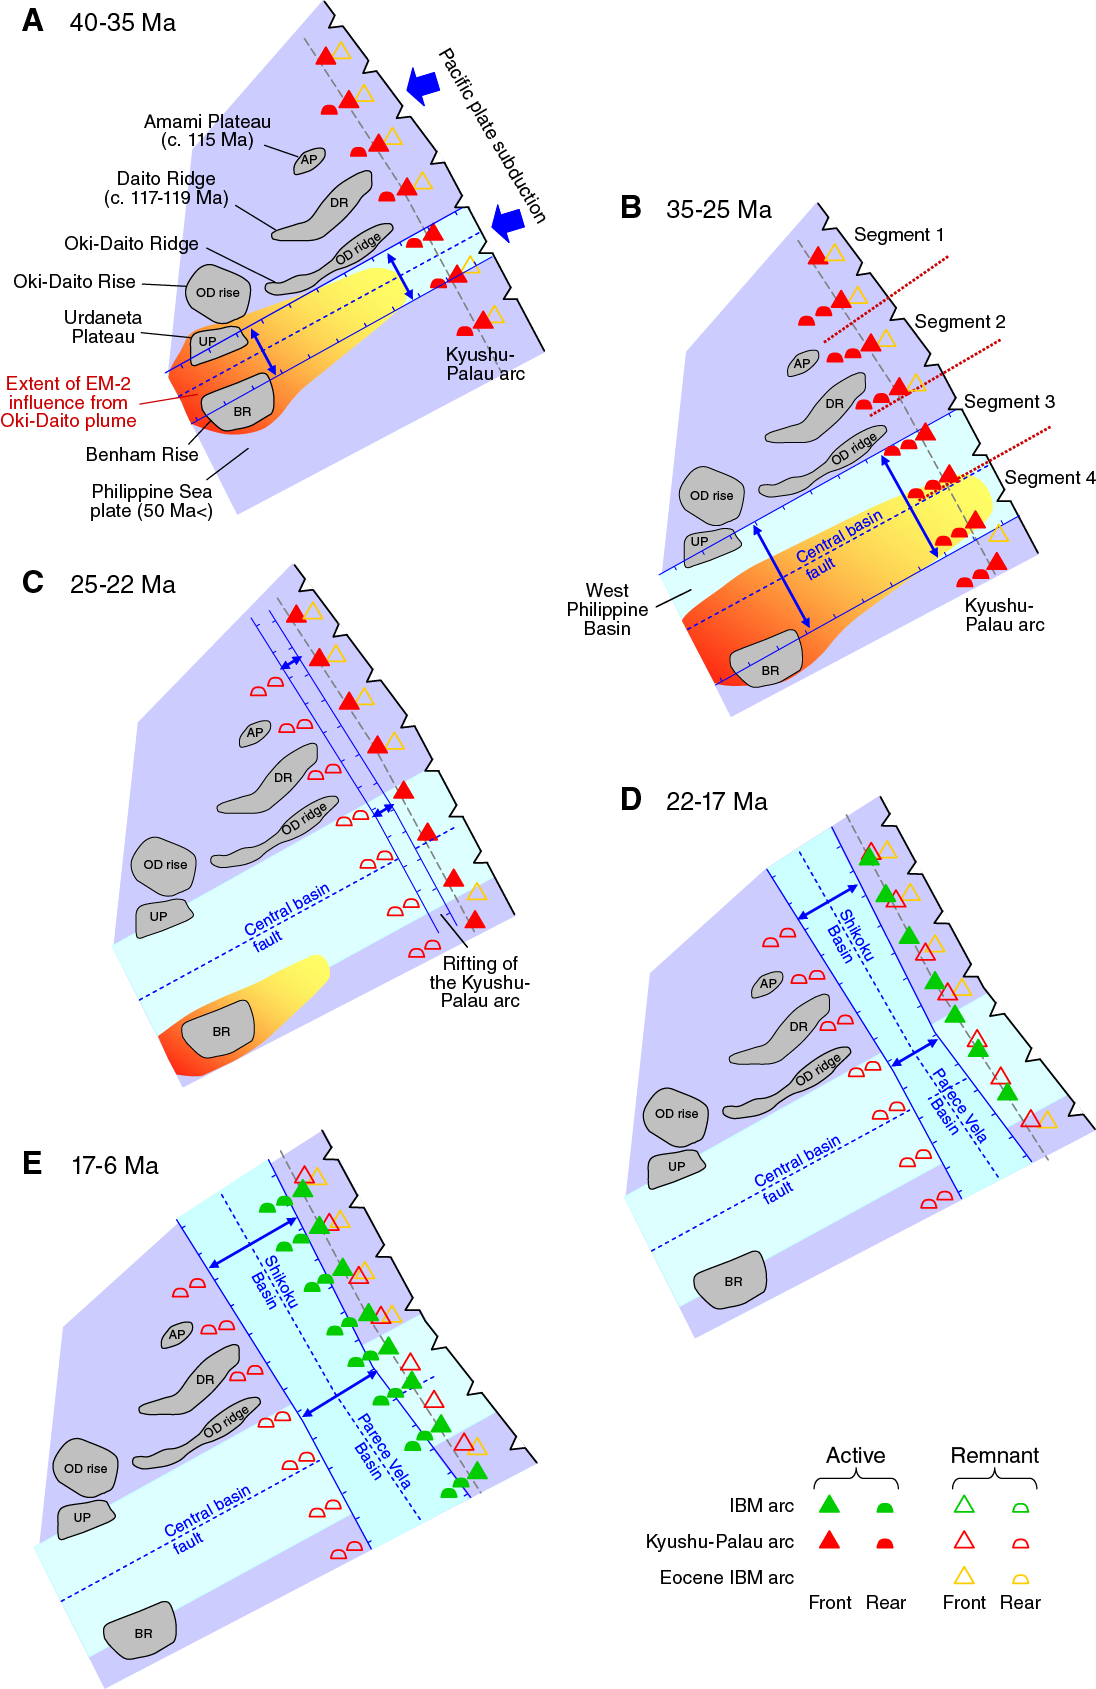
Figure F2. Evolution of IBM arc.
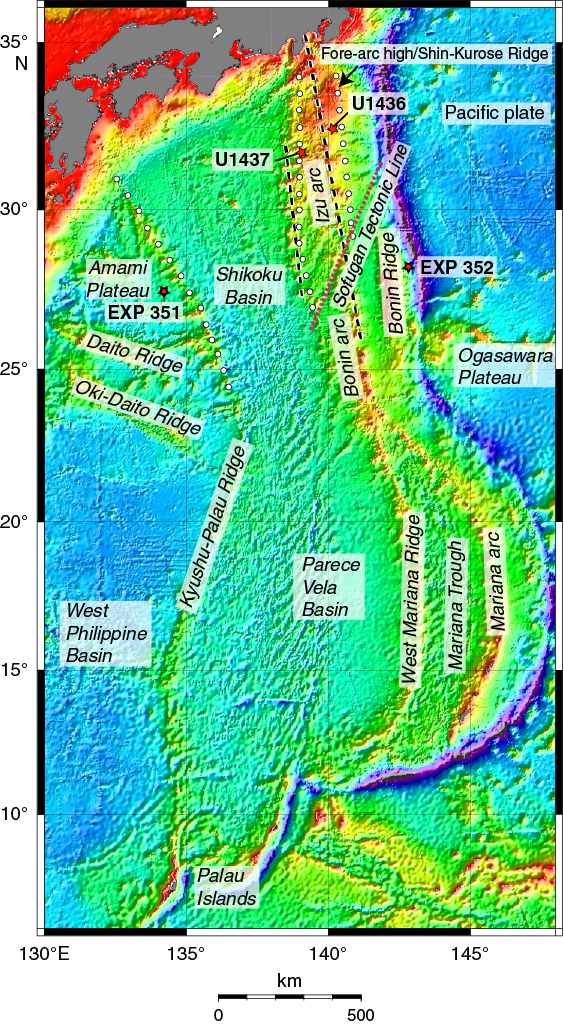
Figure F3. Bathymetric features.
The goal of Expedition 350 was to core and log one site on the Izu rear arc, Site U1437 (proposed Site IBM-3C). This site was chosen to provide a temporal record of rear-arc magma compositions, ideally from Paleogene to Neogene time, allowing comparison with the previously drilled fore-arc magmatic record and determination of across-arc geochemical variations throughout the history of the arc system. Rear-arc magmatic evolution is important to understand because the chemistry of the samples dredged from the tops of rear-arc volcanoes are more similar to the average composition of continental crust than those of arc-front volcanoes, and seismic crustal structure suggests that the rear arc overlies the majority of “continental type” crust in the Izu arc system (Tamura et al., 2013). The Izu rear arc is therefore important for understanding how arc magmas and intracrustal differentiation produces crust that is similar in composition to the “averaged continental crust.”
A secondary goal of Expedition 350 was to obtain a geotechnical core for a potential future deep (5500 meters below seafloor [mbsf]) drilling program at Site U1436 (proposed Site IBM-4) with the D/V Chikyu. Although this operation took only 1 day of the 60 day expedition, it yielded a rich, relatively complete record of Late Pleistocene fore-arc sedimentation that is strongly influenced by arc-front explosive volcanism. This record includes a distinctive black glassy mafic ash layer that may record a large-volume subaqueous eruption on the Izu arc front, investigated further in an additional three days of operations at the end of the expedition. Investigations at Site U1436 are highly complementary to the main objective of Expedition 350, the rear-arc subduction factory (Site U1437), because they will enable us to further understand the formation and the evolution of the Izu arc system.
Before presenting our scientific results, we first review general information on the evolution of the IBM arc system and then provide background on three topics related to our scientific results in the Izu arc: the evidence that Paleogene crust lies beneath both drilled sites, the Quaternary arc-front volcanic record, and the Neogene rear-arc volcanic record.
Evolution of the IBM arc system
The IBM arc formed in response to subduction of the Pacific plate over the past 52 My (Stern et al., 2003). Subduction began as part of a hemisphere-scale foundering of old, dense lithosphere in the western Pacific (Bloomer et al., 1995; Cosca et al., 1998). During the subduction initiation stage (~52–47 Ma), igneous activity successively produced low-K mid-ocean-ridge basalt (MORB)-like tholeiite, boninite, and subordinate low-K rhyolite across the region that now lies in the fore arc. This suggests that sinking of the downgoing plate was rapidly followed by a dramatic episode of asthenospheric upwelling and melting, sometimes enhanced by solute-bearing water fluxes released from the downgoing plate, over a zone that was thousands of kilometers long and as wide as 200 km (Reagan et al., 2010). As subduction proceeded, hydrous mantle melting overprinted decompression mantle melting, establishing the first mature arc in Eocene to Oligocene time (Taylor, 1992; Ishizuka et al., 2006a, 2006b, 2011). This mature arc is labeled the “Kyushu-Palau arc” on Figure F2A and F2B. Eocene arc-front lava, dated at ~40–42 Ma by 40Ar/39Ar by Ishizuka et al. (2011), has been drilled in what is now the Izu fore-arc basement. However, no Oligocene arc rocks (lava or intrusions) have been recovered in the Izu arc, although Oligocene turbidites with andesitic clasts rest upon Eocene lava in what is now the fore arc (Taylor, Fujioka, et al., 1990; Gill et al., 1994), indicating that Oligocene arc volcanism occurred somewhere west in the region. By ~25 Ma, rifting began along the length of the Kyushu-Palau arc (Figure F2C), and opening of the Shikoku Basin isolated the rear-arc volcanoes from the arc-front volcanoes (Figure F2D), producing the Kyushu-Palau Ridge remnant arc, which has Eocene and Oligocene rear-arc rocks. However, Oligocene Kyushu-Palau arc-front rocks have not been found, although they are inferred to underlie the Neogene IBM arc on Figure F2 Moreover, they may lie beneath the rear arc, as inferred by Kodaira et al. (2008) and discussed further below (see Figures F4, F5). Seafloor spreading of the Shikoku and Parece Vela Basins at ~25–17 Ma was likely accompanied by a hiatus in arc magmatism (Figure F2D), but the fore-arc sedimentary record shows that arc-front volcanism resumed by ~17 Ma (Stern et al., 2003), referred to as the Neogene arc, and shown as the IBM arc on Figure F2D and F2E, where the Neogene IBM arc front is shown in nearly the same position as the Paleogene arc front. However, pre-Quaternary rocks have not been recovered from the IBM arc front, perhaps because they are buried or could be partly remelted and/or remobilized during the Quaternary. In contrast, the Izu rear arc (Figure F2E) has not been extensively buried or modified by Quaternary magmatic processes, so Neogene rocks are well preserved; these are dominated by ~17 to 3 Ma northeast-trending rear-arc seamount chains (Figure F6), described in Neogene rear arc volcanism, Izu arc. The Marianas segment of the IBM arc (Figure F1A) differs from the Izu segment by lacking the rear-arc seamount chains; instead, a new episode of arc rifting began at ~7 Ma, resulting in opening of the Mariana Trough back-arc basin by seafloor spreading at ~3–4 Ma (Figure F3) (Yamazaki and Stern, 1997). Rifting of the Izu arc began at ~3 Ma, behind the arc front, described in Neogene rear arc volcanism, Izu arc.
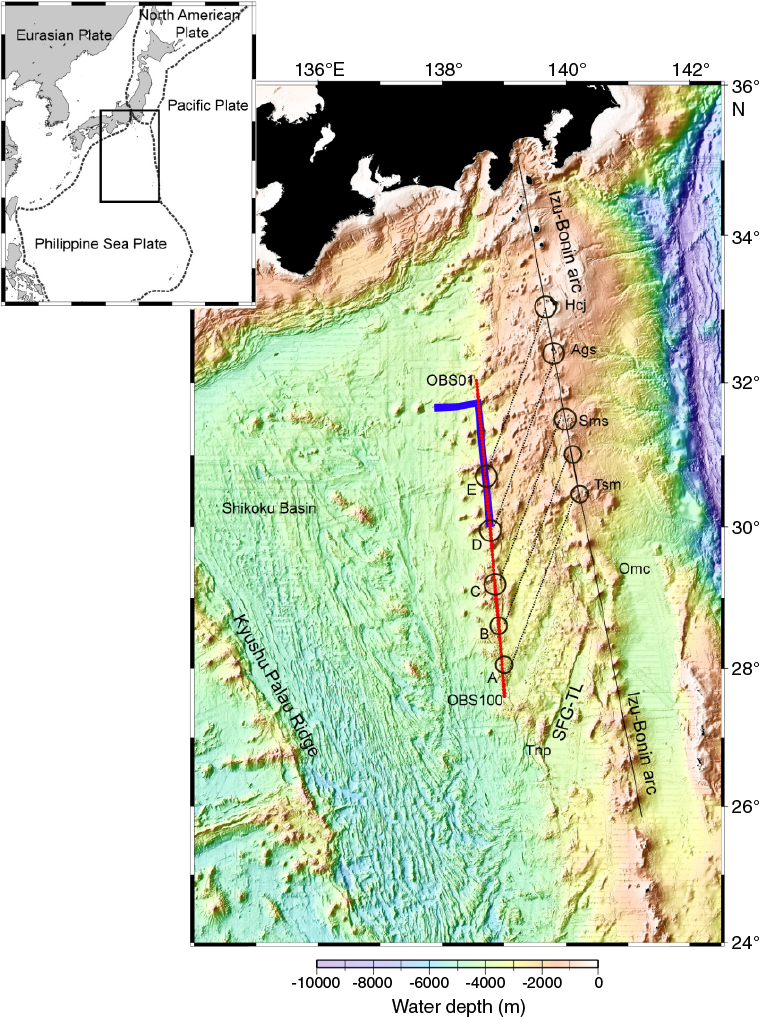
Figure F4. Wide-angle seismic profile location.
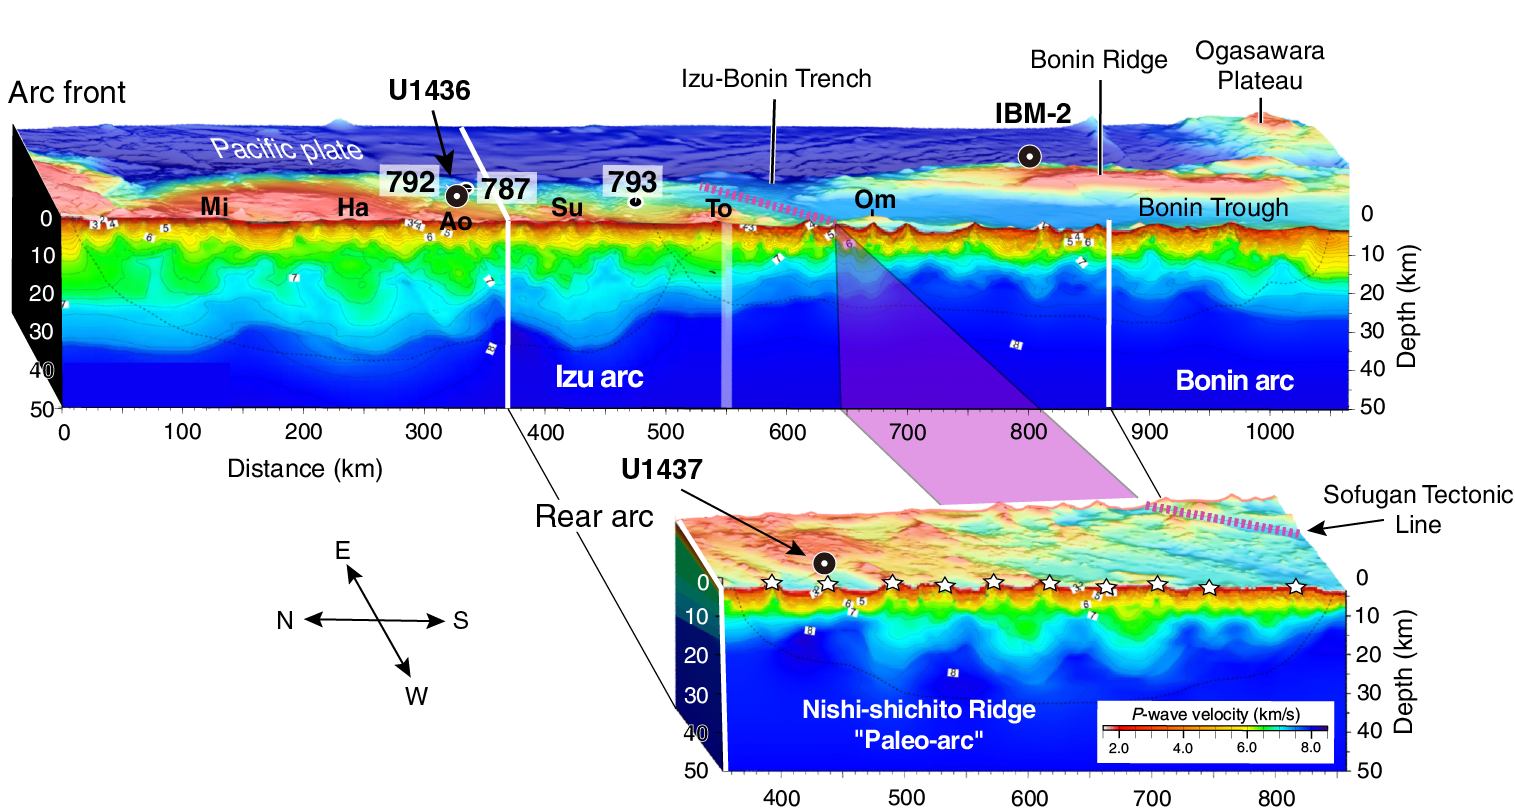
Figure F5. Wide-angle seismic profiles.
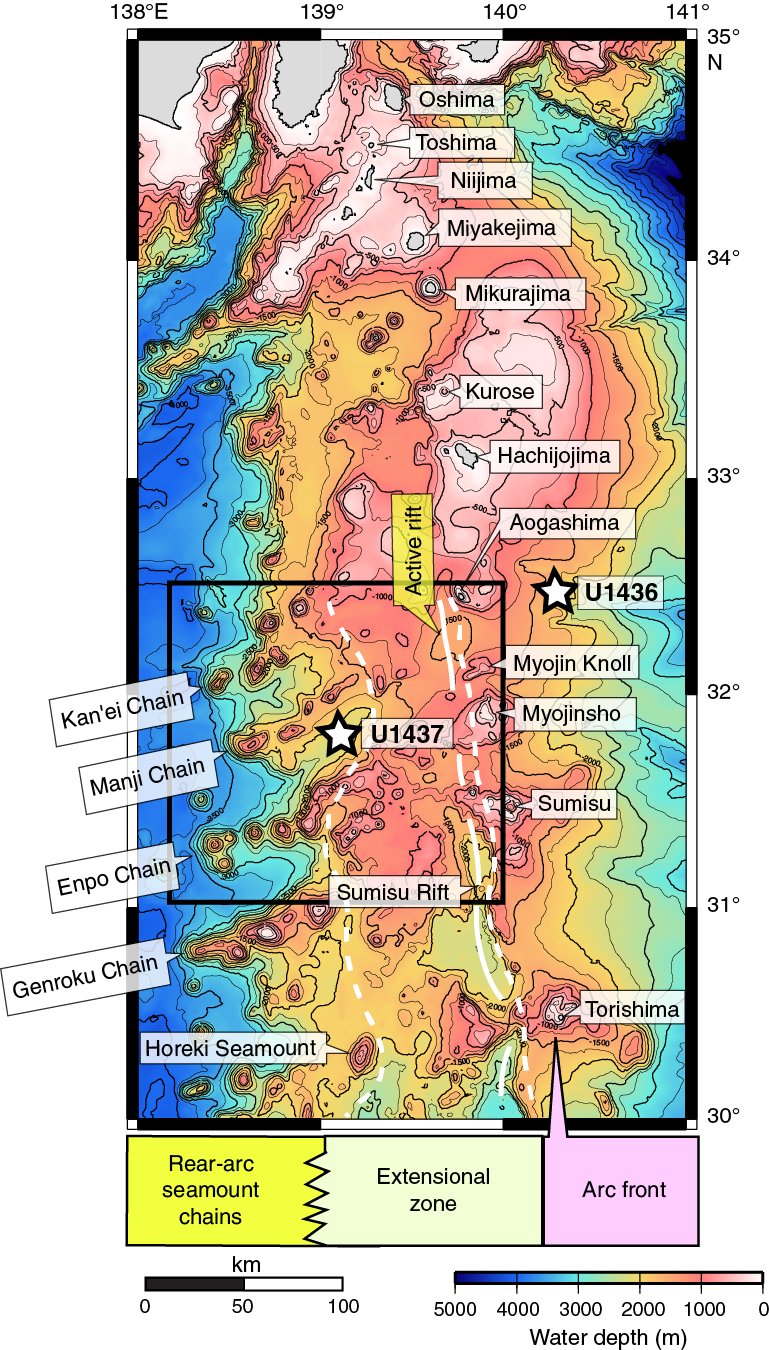
Figure F6. Volcano-tectonic domains within Izu arc.
We know more about the Neogene history of the IBM arc than we do about its Paleogene history; yet it is thought that most of the IBM crust was generated in the Paleogene (Eocene–Oligocene; Kodaira et al., 2008). Furthermore, silicic volcanoes of the Quaternary arc front and Miocene granitic rocks in the Izu collision zone on Honshu are inferred to have formed by melting of Eocene–Oligocene arc crust (Tamura et al., 2009, 2010). As discussed in Scientific results, Neogene rhyolite volcanism may be more important in the Izu rear-arc seamount chain than previously thought and could have resulted from melting of Paleogene “arc basement.” For this reason, we will now review the evidence for Paleogene arc basement highs in the Izu arc and discuss constraints on their age and origin.
Paleogene arc basement highs in the Izu arc
Magnetic and seismic surveys, summarized in this section, indicate that both IODP Sites U1436 and U1437 lie along buried north–south ridges that consist of magmatic crystalline rocks, which are inferred to be Oligocene–Eocene (Paleogene) in age. However, no Oligocene lava or crystalline rocks have been found in the Izu arc, as summarized here.
Three conspicuous, approximately north–south rows of long-wavelength magnetic anomalies were identified by Yamazaki and Yuasa (1998) in the Izu-Bonin arc system and attributed to loci of middle- to lower-crustal magmatic bodies (Figure F3):
- The western north–south anomaly corresponds to the Kyushu-Palau Ridge, where Eocene and Oligocene lava was dredged; these have been geochemically characterized as rear-arc magmas (Ishizuka et al., 2011), rifted off the Paleogene arc during the opening of the Shikoku Basin (Kodaira et al., 2008).
- The eastern north–south anomaly lies in the modern fore arc near the arc front and corresponds to the Shin-Kurose Ridge (Figure F3) (Yamazaki and Yuasa, 1998), also referred to as the Izu fore-arc high (Taylor, Fujioka, et al., 1990). The Shin-Kurose Ridge/fore-arc high forms a bathymetric high in the northern Izu arc and is buried beneath Oligocene to Quaternary volcaniclastic and sedimentary rocks in the southern Izu arc, at Ocean Drilling Program (ODP) Site 792 and Site U1436. Andesite lava in the lowermost 82 m at Site 792 was referred to as “Oligocene basement,” on the basis of K/Ar ages (Taylor, Fujioka, et al., 1990; Taylor, 1992). However, 40Ar/39Ar dating on the lava from two different depths gave consistent and well-defined plateaus of 40.4 ± 0.8 Ma and 40.6 ± 0.3 Ma, or Eocene ages (Ishizuka et al., 2011) (Figure F7). Similarly, andesite lava “basement rocks” drilled in the modern fore-arc basin outboard of this, at ODP Site 793, are Eocene (41 Ma; Ishizuka et al., 2011). Farther outboard, in the outer arc high drilled at ODP Site 786, the basement consists of boninite lava (45.3–46.7 Ma) overlain by andesite lava (44.7 Ma; all by 40Ar/39Ar; Ishizuka et al., 2006a), all Eocene in age. Thus, Oligocene basement has not been found in the fore arc.
- The central north–south magnetic anomaly lies buried in the Izu rear arc (Figure F3) and is referred to as the Nishi-shichito Ridge (Figures F4, F5) (Yamazaki and Yuasa, 1998). This basement high has not been drilled and was one of the objectives of Expedition 350. Kodaira et al. (2008) ran a wide-angle seismic profile along the length of the rear-arc Nishi-shichito Ridge and compared it to a wide-angle seismic profile made along the length of the arc front by Kodaira et al. (2007a, 2007b) (Figure F5). They divided the arc front into segments based on variations in the thickness of middle crust and did the same for the rear-arc Nishi-shichito Ridge. They concluded that although the thickness of the middle crust for each rear-arc segment is smaller than the arc front, the bulk compositions of the crust are almost identical. Furthermore, they used the match on middle crustal thicknesses to infer that the Nishi-shichito Ridge is a “paleo-arc” that obliquely rifted off the arc front in an extension direction parallel to the northeast–southwest Sofugan Tectonic Line (Figure F4). The Sofugan Tectonic Line is the boundary between the Izu and Bonin arc segments (Figure F3); south of it lies the prominent Bonin Ridge and the deep fault-bounded Ogasawara Trough to the west, produced by Eocene to early Oligocene arc magmatism and back-arc extension, respectively. Both the prominent arc ridge and the fault-controlled back-arc basin are absent north of the Sofugan Tectonic Line, so we infer that the Sofugan Tectonic Line originated as an accommodation fault between a region of high extension to the south and little or no extension to the north. Kodaira et al. (2008) propose that oblique rifting of the Nishi-shichito Ridge paleoarc off the arc front occurred during the opening of the Shikoku Basin, sometime after ~30 Ma. If the oblique rifting model is correct, the crystalline basement beneath Site U1437, not reached during Expedition 350, may represent rear-arc crust but formed in a position much closer to the arc front than it is now; alternatively, it may represent arc-front crust that has become stranded in the rear arc by rifting. New seismic surveys undertaken in preparation for drilling at Site U1437, described briefly in Scientific results, also support the interpretation that the rear arc is underlain by Paleogene arc basement rocks.
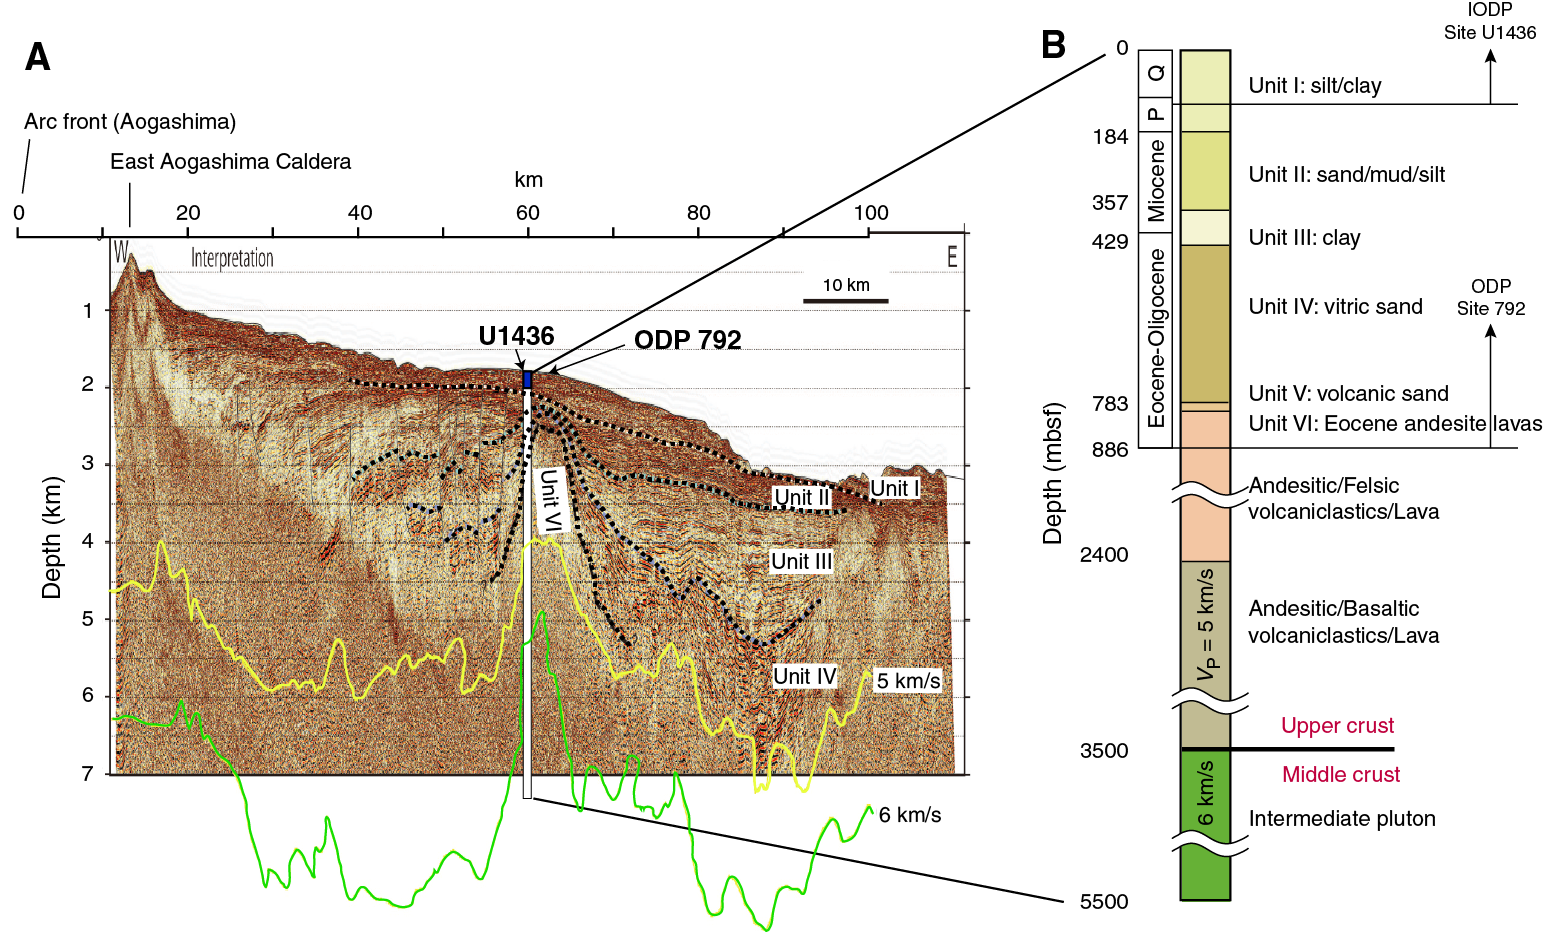
Figure F7. MCS Section IBM4-EW5 E-W profile.
Quaternary arc-front volcanic record, Izu arc
A brief overview of Quaternary arc-front volcanism is provided as background for discussion of Pleistocene volcaniclastics encountered at Sites U1436 and U1437.
The IBM volcanic arc system is an excellent example of an intraoceanic convergent margin where the effects of crustal anatexis and assimilation are considered to be minimal (Stern et al., 2003; Tatsumi and Stern, 2006). Nonetheless, volume estimates of rock types from the Quaternary Izu arc suggest that dacite and/or rhyolite form a major mode, although basalt and basaltic andesite (<57 wt% SiO2) are clearly the predominant eruptive products (Tamura and Tatsumi, 2002). About half of the edifices at the Quaternary arc front are calderas dominated by rhyolite (Figures F8, F9) (Yuasa and Kano, 2003). Turbidites sampled during ODP Leg 126 in the Izu arc, which range in age from 0.1 to 31 Ma, are similarly bimodal (Gill et al., 1994).

Figure F8. Periodic variation in average crustal thickness.

Figure F9. Sr, Nd, and Pb isotopes.
The Quaternary arc front of the Izu arc shows along-strike correlations between crustal structure and the average composition of arc-front magmas, shown by an active source wide-angle seismic study along the northernmost 550 km of the Izu arc front (Figure F5). As illustrated in Figure F8, there is an along-arc periodic variation in average crustal thickness with a wavelength of ~80–100 km, reflecting variations in the thickness of the middle crust (whereas the lower crust has uniform thickness). These periodic variations correlate well with the average chemical composition of the overlying arc-front volcanoes; that is, the thicker middle crust underlies the basaltic island volcanoes, whereas the thinner middle crust underlies the rhyolitic submarine volcanoes (mainly calderas). Thus, the velocity structure of this part of the Izu arc crust, which has a complex 50 My history, appears to correlate well with the chemical composition of the Quaternary volcanoes. Contrary to the situation common for continental arcs, the basaltic volcanoes overlie lower average velocity (more continental-like) crust compared with the silicic volcanoes, which overlie thinner middle crust. This may indicate that the silicic volcanoes formed by melting of Eocene–Oligocene arc crust (Tamura et al., 2009) and that this process thinned the middle crust beneath them in some way. If this model is correct, the rear arc may show similar variation (i.e., silicic volcanoes on thinner middle crust and more mafic volcanoes on thicker middle crust). However, unlike the arc front, rear-arc Miocene volcanoes (white stars in Figure F5) do not correlate with the underlying crustal structure (possibly Oligocene–Eocene).
Neogene rear-arc volcanism, Izu arc
We refer to all Neogene volcanic rocks behind the Izu arc front as rear-arc volcanic rocks. Rear-arc volcanic rocks (Figures F6, F10) include (1) the ~17–3 Ma east northeast–trending basaltic to rhyolitic rear-arc seamount chains, (2) the <3 Ma bimodal back-arc knolls of the broad extensional zone, and (3) the <1.5 Ma bimodal volcanic rocks of the active rift immediately behind the arc front. Thus, Izu rear-arc volcanism falls into two magmatic suites: the <3 Ma bimodal rift-type magmas and the ~17–3 Ma basalt to rhyolite rear-arc seamount-type magmas. Both types lie within the rear part of the arc (i.e., behind the arc front) and lie on arc crust, although the westernmost end of the rear-arc seamount chains lies on Shikoku Basin oceanic crust. The bimodal rift-type magmas differ from both the arc front and the rear-arc seamount chains in trace element and radiogenic isotopic ratios; this has been variably attributed to (1) a transition from flux to decompression mantle melting as arc rifting commences, (2) a change in the character of slab-derived flux, or (3) a change in the mantle source through mantle wedge convection (Hochstaedter et al., 1990a, 1990b, 2001; Ishizuka et al., 2003a, 2006b; Tollstrup et al., 2010).
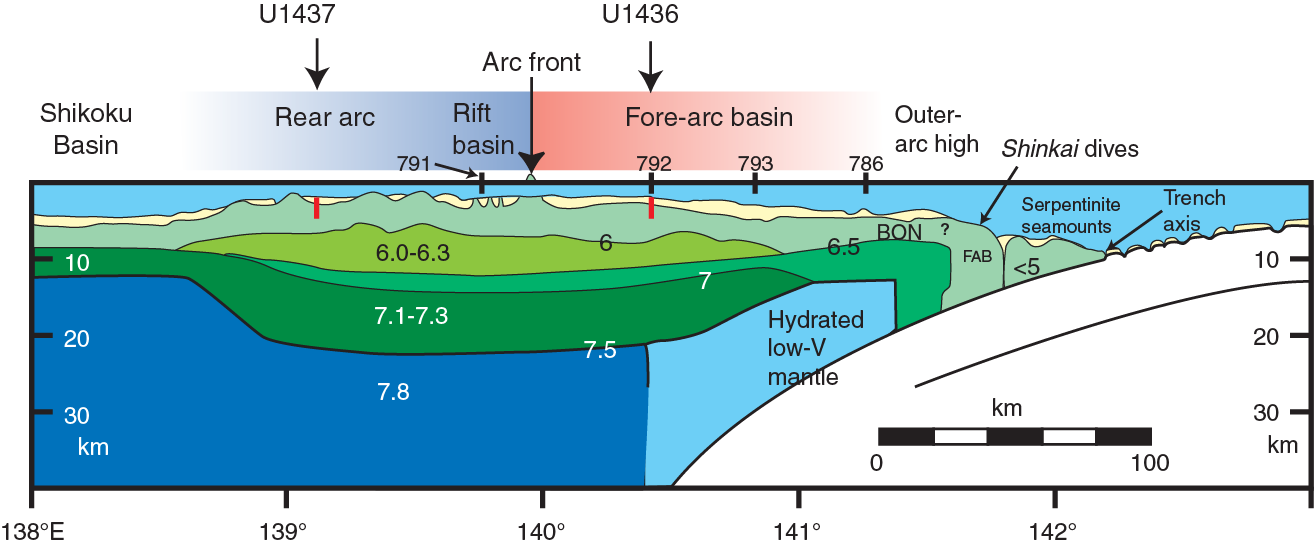
Figure F10. Wide-angle seismic profile across Izu arc.
The Izu rear-arc seamount chains are as long as ~80 km and strike N60°E (Figure F6). The tops of the Izu rear-arc volcanic chains were sampled by dredging, and their compositions range from basalt to rhyolite (Ishizuka et al., 1998, 2003b; Hochstaedter et al., 2000). Three main hypotheses have been proposed for the origin of the seamount chains:
- They are related to compression caused by collision between the southwest Japan and Izu arcs, associated with opening of the Japan Sea (Karig and Moore, 1975a; Bandy and Hilde, 1983).
- They formed along Shikoku Basin transform faults (Yamazaki and Yuasa, 1998).
- They overlie diapirs in the mantle wedge (Figure F11), such as the “hot fingers” proposed for northeast Japan (Tamura et al., 2002).
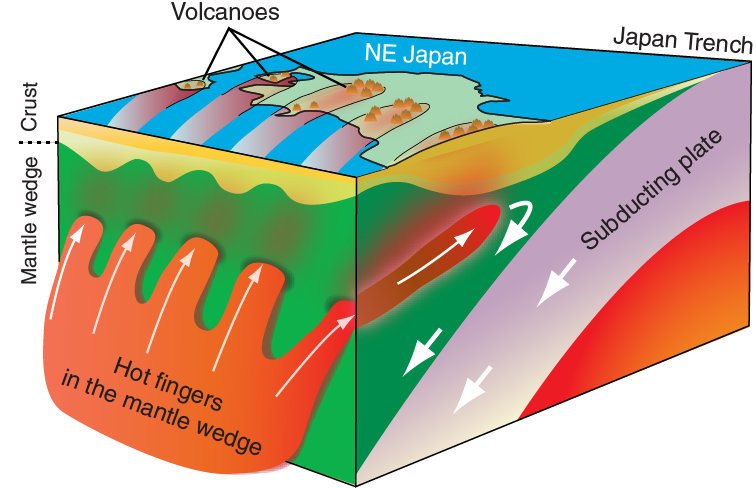
Figure F11. Hot fingers hypothesis.
In some cases (e.g., Manji and Genroku seamount chains), the seamount chains seem aligned with large volcanoes on the arc front (e.g., Aogashima and Sumisu) (Figure F6); however, the alignment is imperfect, and it is not clear which hypothesis a perfect alignment would support.
A striking characteristic of volcanic arcs is the asymmetry in geochemical characteristics with distance from the trench, which was known prior to the advent of plate tectonics (Kuno, 1959; Dickinson and Hatherton, 1967). Izu arc-front rocks are low-K, but the rear-arc type lava is medium- to high-K (Gill, 1981) (Figure F12). Similarly, arc-front volcanic rocks are strongly depleted in incompatible light rare earth elements (REEs) relative to the middle and heavy REEs, whereas lava from rear-arc seamount chains is enriched in light REEs. Gamma radiation logs obtained during Expedition 350 rear-arc drilling should record higher K, U, and Th and lower Th/U than those from drilling at the Izu-Bonin fore-arc sites, where volcaniclastics come from the arc front. On both K2O versus SiO2 and REE plots, the composition of the rear-arc seamount chain magmas is more similar to the continental crust composition than the arc-front magmas (Figure F12). Thus, the Izu rear-arc magmatism and crust formation appears to be a better analog to generate continental crust than the arc front.
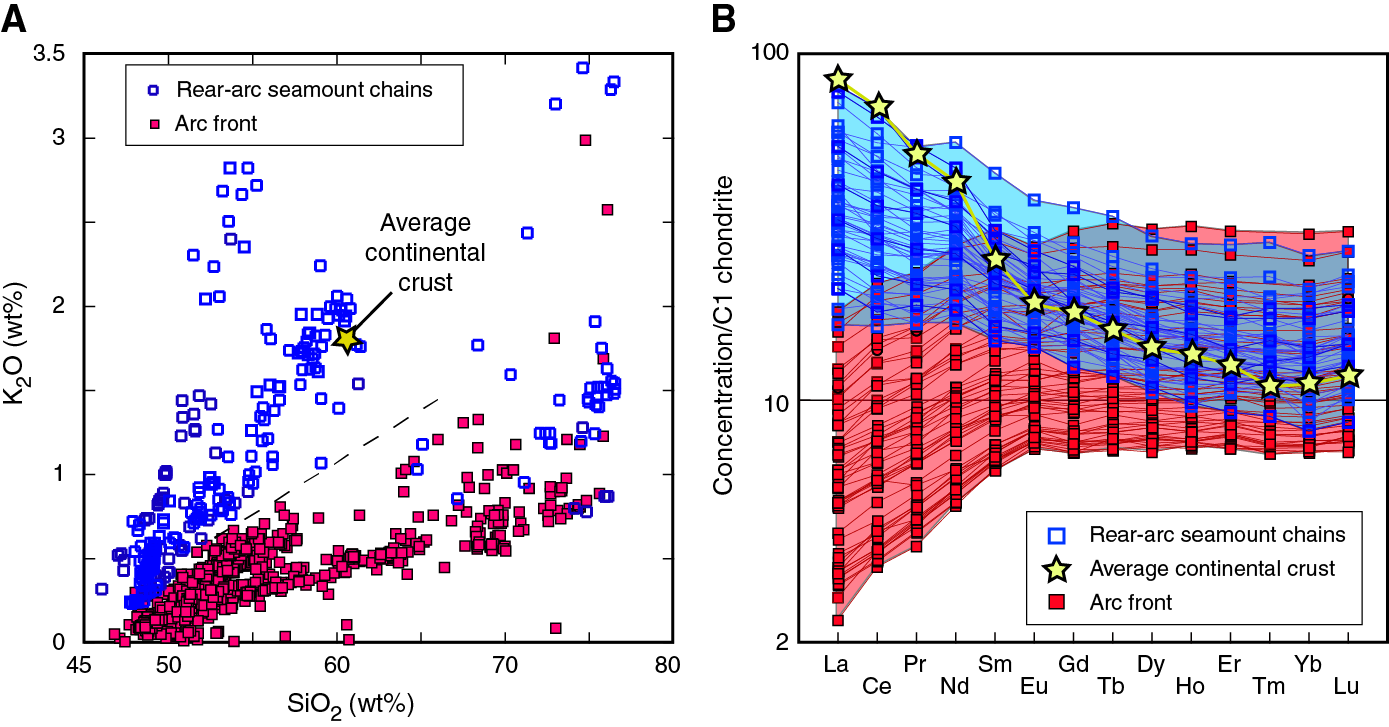
Figure F12. K2O vs. SiO2 of Izu arc front lavas.
Although Site U1437 is in a location that should be topographically shielded from more concentrated arc front–derived density currents, more dilute equivalents, as well as arc front–derived ash fall deposits, may be present. It should be possible to distinguish between arc-front and rear-arc seamount chain sources because the lava of the rear-arc seamount chains is enriched in alkalis, high-field-strength elements (e.g., Nb and Zr), and other incompatible elements but has less enriched Sr, Nd, Hf, and Pb isotopes compared to the lava of the arc front (Hochstaedter et al., 2001; Ishizuka et al., 2003a; Tamura et al., 2007) (Figure F12). However, the <3 Ma bimodal volcanic rocks of the broad extensional zone and narrow active rift are not easily distinguished from rear-arc seamount chain or arc-front rocks (Hochstaedter et al., 2001), and Site U1437 may not be completely shielded from density currents from those sources. Therefore, we expect to be able to distinguish rear-arc and arc-front magmas for all rocks ranging from 17 to 3 Ma but not necessarily for rocks <3 Ma.
We do not know if arc geochemical asymmetry was present early in the history of the arc (in the Paleogene) or if it is strictly a Neogene feature. These two options are presented as “from the beginning” and “from the middle” hypotheses in Figure F13. Paleogene rocks were drilled in the fore arc, so their chemistry is known; however, no drilling has been done in the rear arc, so its Paleogene chemistry is unknown.
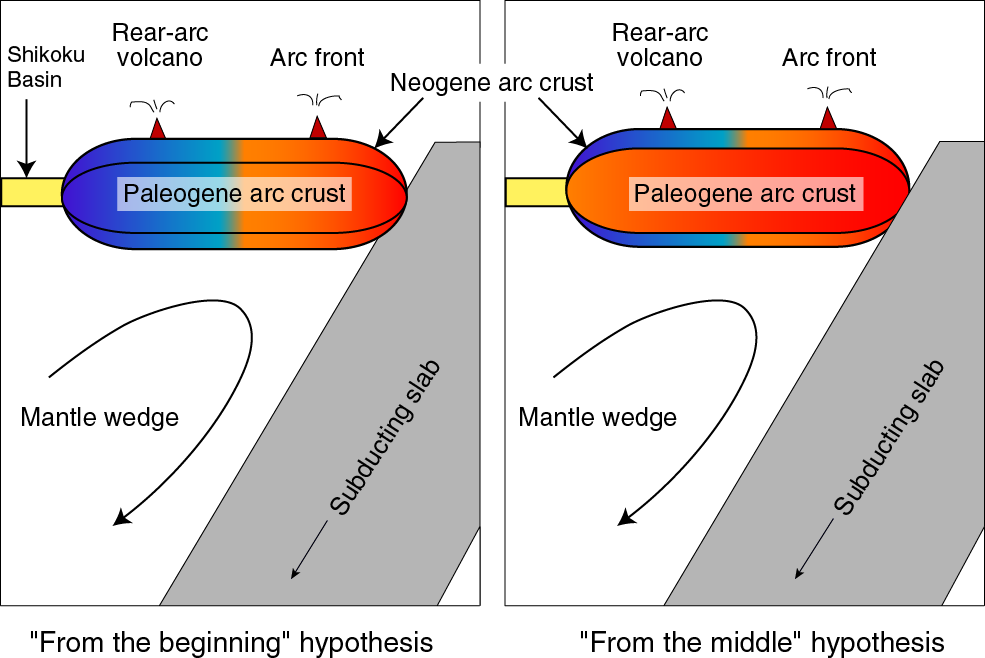
Figure F13. Hypotheses for the evolution of Izu arc crust.
Site U1437 lies in a ~20 km wide basin in the low area between two major constructional volcanic ridges: the Manji and Enpo rear-arc seamount chains. It is therefore classified as a volcano-bounded intra-arc basin using the criteria elucidated by Smith and Landis (1995) as illustrated in Figure F14A. In contrast, the active rift to the east of Site U1437 is a fault-bounded intra-arc basin (Figure F14B). For simplicity, the volcano-bounded basin bounded by the Enpo and Manji rear-arc seamount chains is referred to as the Enpo-Manji volcano-bounded basin (Figure F15). Similarly, we propose that future workers refer to other basins between rear-arc seamount chains by the names of the chains that bound them (e.g., Genroku-Enpo Basin and Manji-Kan’ei Basin, Figure F6).
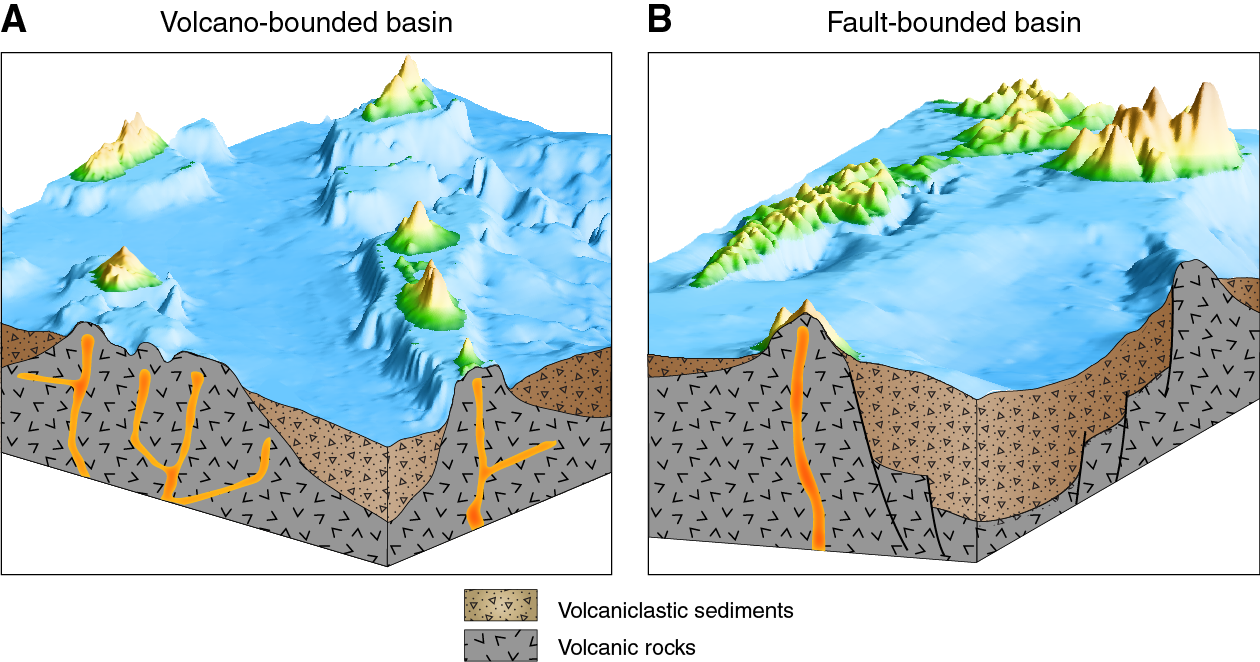
Figure F14. Two main basin types recognized within arcs.
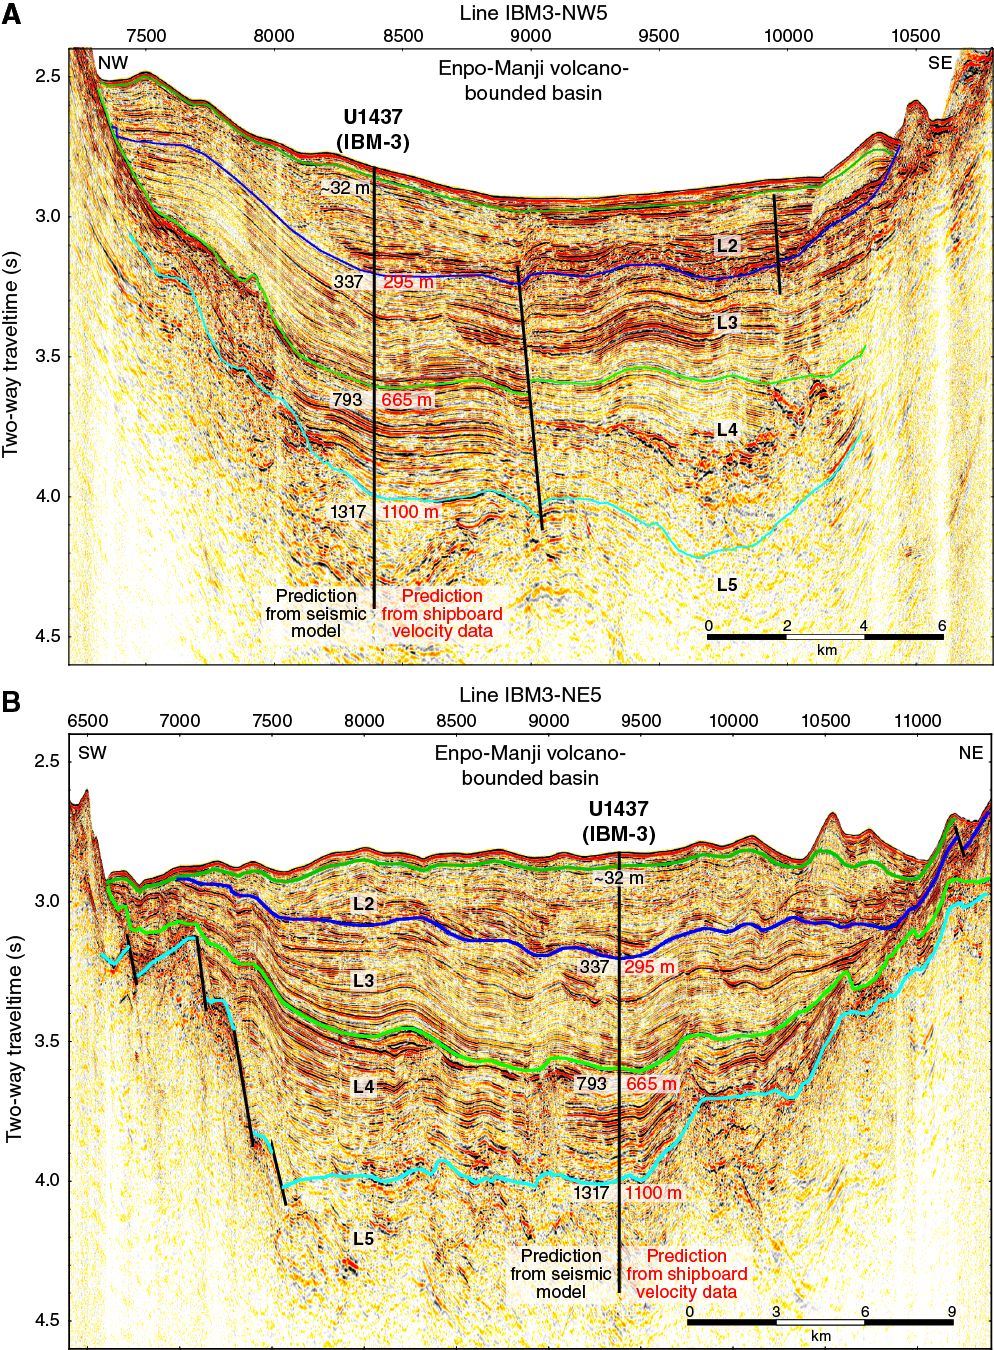
Figure F15. Seismic lines with interpreted seismic layers.
Scientific results
New descriptive scheme for volcaniclastic rocks
The lithologic classification of sedimentary, volcaniclastic, and igneous rocks recovered by Expedition 350 uses a new scheme for describing volcaniclastic and nonvolcaniclastic sediments but uses generally established (International Union of Geological Sciences [IUGS]) schemes for igneous rocks (Figures F16, F17; Tables T1, T2, T3). The new scheme was devised to improve description of volcaniclastic sediments and their mixtures with nonvolcanic (siliciclastic, chemical, and biogenic) sediments but maintain the usefulness of prior schemes for describing nonvolcanic sediments. The new scheme follows the recommendations of a dedicated core description workshop held in January 2014 in College Station, Texas (USA), prior to the cruise (attended by participants of 2014 IODP Expeditions 349, 350, 351, and 352), and was modified and tested during Expedition 350. The new scheme was devised for use in a spreadsheet-based descriptive information capture program designed by IODP (DESClogik), and the spreadsheet configurations were modified to use this scheme. This scheme was devised to facilitate the understanding of volcano-sedimentary processes by making reproducible and quantifiable observations of volcanic input to the sedimentary record. Also during Expedition 350, the new scheme shown in Figures F16 and F17 was applied to microscopic description of core samples, and the DESClogik microscope spreadsheet configurations were modified to use this scheme.
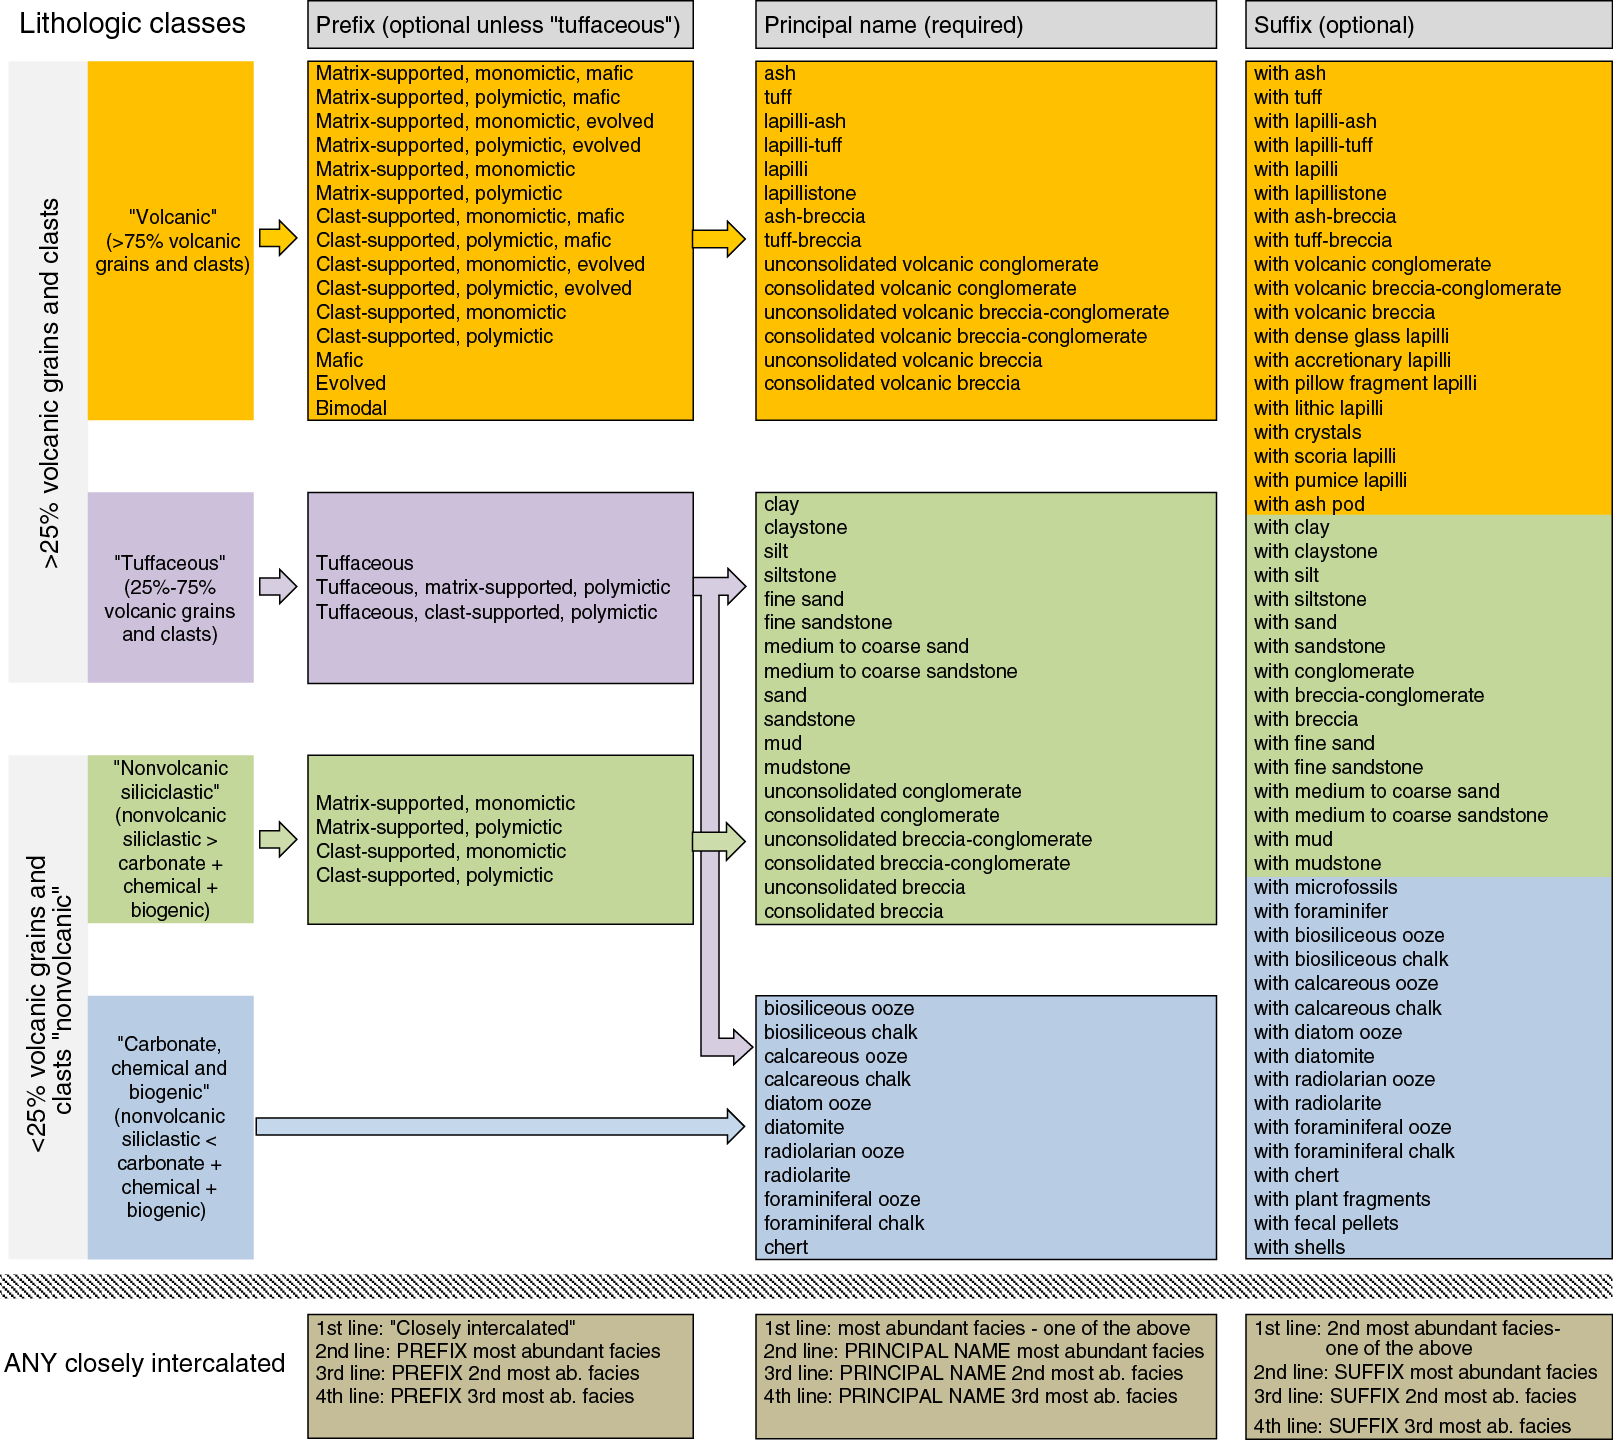
Figure F16. Sedimentary and volcaniclastic lithology naming conventions.
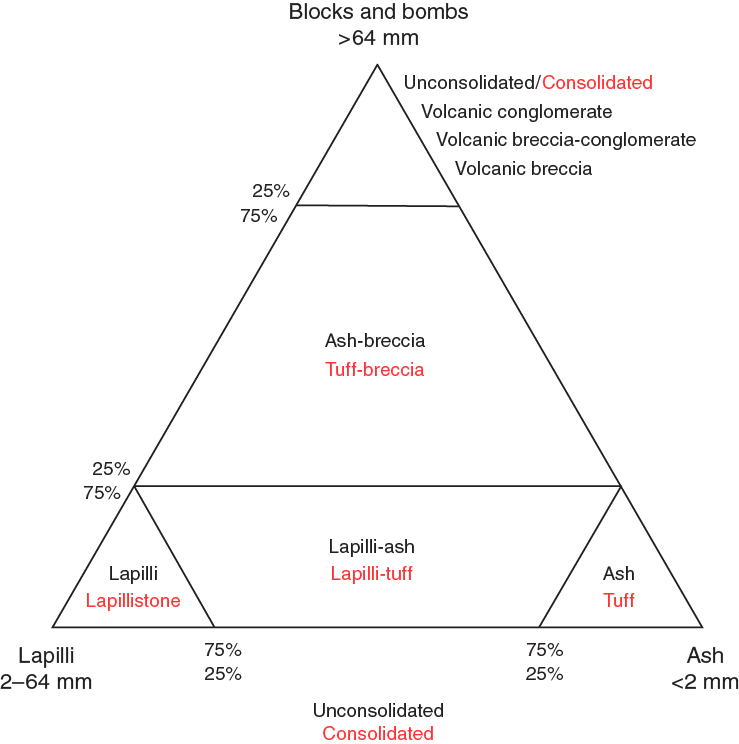
Figure F17. Volcaniclastic grain size.
Table T1. Unit descriptions. Download table in .csv format.
Table T2. Extrusive and hypabyssal volcanic rock nomenclature. Download table in .csv format.
Table T3. Volcanogenic material abundance. Download table in .csv format.
Rationale
During Expedition 350, sediments and sedimentary rocks were classified using a rigorously nongenetic approach, which integrates volcanic particles into the sedimentary descriptive scheme typically used by IODP (Figures F16, F17). This is necessary because volcanic particles are the most abundant particle type in arc settings like those drilled during the IBM expeditions. The methodology developed allows, for the first time, a comprehensive description of volcanogenic and nonvolcanogenic sediments and sedimentary rocks and integrates with descriptions of coherent volcanic and igneous rocks (i.e., lava and intrusions) and the coarse clastic material derived from them. This classification allows expansion to bioclastic and nonvolcanogenic detrital realms.
The purpose of the new classification scheme (Figures F16, F17) is to include volcanic particles in the assessment of sediments and rocks recovered in cores, be accessible to scientists with diverse research backgrounds and experiences, allow relatively quick and smooth data entry, and display data seamlessly in graphical presentations. The new classification scheme is based entirely on observations that can be made by any scientist at the macroscopic and microscopic level, with no genetic inferences, making the data more reproducible from user to user.
Classification and nomenclature of deposits with volcanogenic clasts has varied considerably throughout the last 50 y (Fisher, 1961; Fisher and Schmincke, 1984; Cas and Wright, 1987; McPhie et al., 1993; White and Houghton, 2006), and no consensus has yet been reached. Moreover, even the most basic descriptions and characterizations of mixed volcanogenic and nonvolcanogenic sediments are fraught with competing philosophies and imperfectly applied terminology. Volcaniclastic classification schemes are all too often overly based on inferred modes of genesis, including inferred fragmentation processes or inferred transport and depositional processes and environments. However, submarine-erupted and deposited volcanic sediments are typically much more difficult to interpret than their subaerial counterparts, partly because of more complex density-settling patterns through water relative to air (e.g., the ability of pumice to float is proportional to the volume of a clast) and the ease with which very fine grained sediment is reworked by water. Soft-sediment deformation, bioturbation, and low-temperature alteration are also more significant in the marine realm relative to terrestrial environments.
The goal of the new classification scheme is to make the description of volcanic-sedimentary mixtures more accessible to nonspecialists and also more “database ready” so that volcanic inputs can be evaluated quantitatively.
Units
Sediments and sedimentary rocks, including volcaniclastic, siliciclastic, and bioclastic, were described at the level of (1) the descriptive interval (a single descriptive line in the DESClogik spreadsheet) and (2) the lithostratigraphic unit (Table T1). A descriptive interval typically consists of a single lithofacies distinct from those immediately above and below it (e.g., a tuff interval intercalated between mudstone intervals); it is typically analogous to beds, with thicknesses classified in the same way (e.g., Ingram, 1954). In the case of closely intercalated, monotonous, repetitive successions (e.g., alternating thin sand and mud beds), lithofacies were grouped within the descriptive interval; this was done by using the lithology prefix “closely intercalated,” followed by the principal name, which represents the most abundant facies, followed by suffixes for the subordinate facies, in order of abundance (Figure F16). Lithostratigraphic units are assemblages of multiple descriptive intervals containing similar facies that are typically tens to hundreds of meters thick. Lithostratigraphic units should be clearly distinguishable from each other by several characteristics, such as composition, bed thickness, grain size class, and internal homogeneity. Following IODP tradition, they are numbered sequentially Unit I, Unit II, and so on, from the top to the bottom of the hole.
Sedimentary lithologic classes
The new descriptive scheme used during Expedition 350 defines four sedimentary lithologic classes, based on types of particles (Figure F16; Table T2):
- Volcanic lithologic class, defined as >75% volcanic particles.
- Tuffaceous lithologic class, containing 25%–75% volcanic-derived particles mixed with nonvolcanic particles. The definition of the term “tuffaceous” (25%–75% volcanic particles) is modified from Fisher and Schmincke (1984).
- Nonvolcanic siliciclastic lithologic class, containing <25% volcanic siliciclastic particles, where nonvolcanic siliciclastic particles dominate chemical and biogenic particles.
- Biogenic lithologic class, containing <25% volcanic siliciclastic particles, where nonvolcanic siliciclastic particles are subordinate to chemical and biogenic particles.
Principal names
In our new scheme, the principal name for sediments and sedimentary rocks is based on grain size (Figure F16) and is purely descriptive; it does not depend on interpretations of fragmentation, transport, or depositional or alteration processes. The sedimentary grain size classes of Wentworth (1922) are used for the nonvolcanic siliciclastic and tuffaceous lithologic classes, whereas the grain size classes of Fisher and Schmincke (1984) are used for the volcanic lithologic class.
We use the general term “particles” to refer to the fragments that make up volcanic, tuffaceous, and nonvolcanic siliciclastic sediments and sedimentary rocks, regardless of the size of the fragments. However, we adopt a strict definition of the terms “grains” and “clasts,” using clasts to describe particles >2 mm in size and grains to describe particles <2 mm in size. This size cut-off (2 mm) corresponds to the sand–granule grain size division of Wentworth (1922) and the ash–lapilli grain size divisions of Fisher (1961), Fisher and Schmincke (1984), Cas and Wright (1987), and McPhie et al. (1993) (Table T3). In addition, we include important information on the angularity of clasts by using the term “conglomerate” for a deposit where the clasts are exclusively (>95 vol%) rounded and subrounded, “breccia-conglomerate” where clasts are predominantly (>50 vol%) rounded and/or subrounded, and “breccia” where clasts are predominantly (>50 vol%) angular.
Prefixes
During Expedition 350, the prefix “monomict” was applied where clast compositions were restricted to a single type and “polymict” was applied where clast compositions of multiple types were present (Figure F16). Where not obscured by alteration, an estimate of the compositional range of volcanic clasts was represented on macroscopic descriptions by three entries: “mafic,” “bimodal,” and “evolved,” with intervals described as mafic inferred to be basalt and basaltic andesite and intervals described as evolved inferred to be intermediate and silicic in composition. In macroscopic analysis, mafic versus evolved intervals are defined by the grayscale index of the main particle component, with mafic grains and clasts usually ranging from black to dark gray and evolved grains and clasts ranging from dark gray to white. Microscopic examination further aided in assigning the prefix mafic or evolved using glass shard color and mineralogy; however, precise determination of bulk composition requires chemical analysis. During Expedition 350, the prefix “matrix-supported” was used where smaller particles visibly envelop each of the clasts and “clast-supported” was used where clasts (defined as >2 mm in diameter, above) form the sediment framework.
Suffixes and other parameters
The suffix is used for a subordinate component that deserves to be highlighted. It is restricted to a single term (e.g., “with foraminifer,” “with crystals,” etc.). Bed thicknesses followed the terminology of Ingram (1954), and for simplicity, sorting values were restricted to three terms (well, moderately, and poor) and clast roundness values were also restricted to three terms (rounded, subrounded, and angular). Volcanic components included three major types (vitric, crystal, and lithic) sorted by their abundance into “dominant,” “2nd order,” and “3rd order.” Vitric clasts and grains include pumice and scoria (light colored and dark colored, respectively) as well as dense glass, and “fiamme” was used to describe flat wispy volcanic particles with no implication for origin (e.g., welding versus burial/diagenetic compaction). Crystals are described as grains because they are typically <2 mm in size, and their shape (euhedral, subhedral, or anhedral) and type (e.g., quartz or feldspar) is noted where possible. Lithic grains and clasts were described as angular, subrounded, or rounded with types (e.g., volcanic evolved or volcanic mafic) noted. In macroscopic descriptions, matrix can be well, moderately, or poorly sorted with types (e.g., vitric, crystal, or lithic) noted.
Summary of volcaniclastic rock descriptive scheme
The new volcaniclastic descriptive scheme applied during Expedition 350 uses a more nongenetic approach than proposed by previous authors because the sediments and rocks are named based on materials that are visible macroscopically and microscopically and not on the basis of inferred fragmentation, transport, and depositional processes (i.e., pyroclasts, autoclasts, hydroclasts, epiclasts, and reworked volcanic clasts [Fisher and Schmincke, 1984; Cas and Wright, 1987; McPhie et al., 1993]). Nonetheless, process interpretations can be entered as comments in the database; these may include inferences regarding fragmentation processes, eruptive environments, mixing processes, transport processes, alteration, and so on. The new descriptive scheme allows more quantitative evaluation of volcanic input and its nature, as demonstrated in the various lithostratigraphy, geochemistry, and interpretation sections in this report.
Site U1436: Izu fore-arc record of arc-front explosive volcanism
Site U1436 is located at 32°23.88′N, 140°21.93′E (1776 m water depth), in the western part of the Izu-Bonin fore-arc basin ~60 km east of the arc-front volcano Aogashima and ~170 km west of the axis of the Izu-Bonin Trench, 1.5 km west of Site 792 (Figures F1, F3, F18). See Table T4 for coring summary.
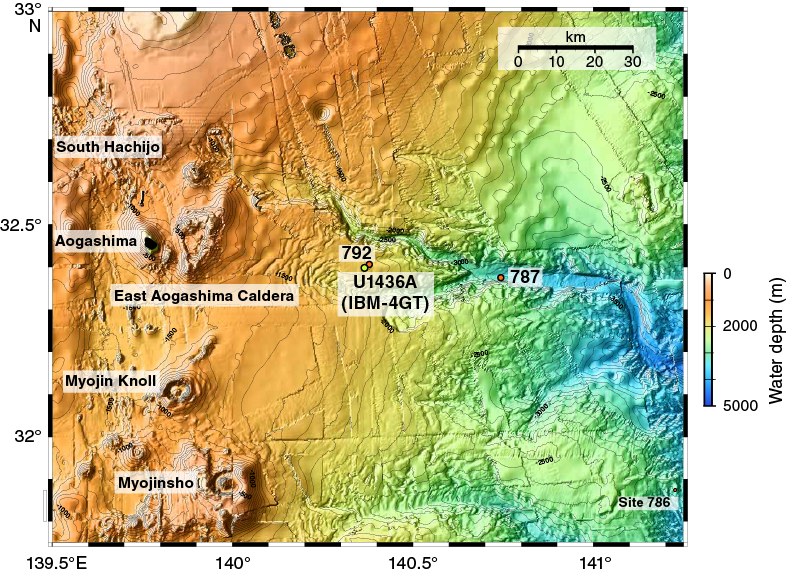
Figure F18. Location of Site U1436.
Table T4. Coring summary. Download table in .csv format.
The plan for Site U1436 was to carry out a 1 day operation to core 150 mbsf and collect geotechnical samples in preparation for potential future drilling at proposed Site IBM-4. Here, the Chikyu is proposed to drill 5.5 km below seafloor to reach arc middle crust, which is inferred to represent juvenile continental crust. The origin of continental crust remains one of the biggest unsolved problems in Earth science because continental crust, though volumetrically insignificant on a planetary scale, is an important reservoir for many trace and minor elements. The “andesite model” proposes that subduction zone magmatism produces the nuclei of new continental crust. However, the processes involved (e.g., partial melting of mantle sources, crystallization differentiation, or other processes) remain poorly understood. Ultradeep drilling into arc crust is the best way to sample unprocessed juvenile continental-type crust as it is first generated at intraoceanic arcs, before its primary features are overprinted by accretion or incorporation into a larger or more mature continent. Geotechnical Site U1436 is important for assessing the suitability of near surface conditions for this ambitious undertaking.
Although Site U1436 was scheduled as a geotechnical hole for proposed Site IBM-4, it yielded a rich, relatively complete record of Late Pleistocene fore-arc sedimentation, strongly influenced by arc-front explosive volcanism. This is highly complementary to the main objective of Expedition 350, the rear-arc subduction factory (Site U1437), in terms of understanding the Izu arc system as a whole. In addition, Site U1436 gave scientists the opportunity to “test drive” the newly devised descriptive scheme for volcaniclastic rocks, described above.
The Izu fore arc is a repository of ash/tuff erupted in the Izu-Bonin arc front because the wind prevailingly blows from west to east. Mafic effusive eruptive products are better preserved on the arc-front islands, whereas more silicic materials from explosive volcanism are preserved in adjacent deep ocean basins. The major objective of Site U1436 (besides collecting geotechnical samples) is to characterize the chemistry, age, provenance, and textural characteristics of mafic and silicic explosive volcanic products from the arc front in order to better understand outputs that are not preserved on land. At Site U1436, this stratigraphic record consists of tuffaceous mud interstratified with mafic and evolved ash and lapilli-ash.
Age model, biostratigraphy, paleomagnetism, and physical properties
Although coring was attempted to 150 mbsf, the deepest sample was recovered at 131.7 mbsf (Figure F19). Thirteen out of 16 biostratigraphic datums and 1 magnetostratigraphic datum were selected to construct an age-depth relationship for this site and to estimate the linear sedimentation rates (LSRs) and mass accumulation rates (MARs). Biostratigraphic and magnetic reversal data are in agreement for the Late–Middle Pleistocene section, and the age model was constructed using all datum types. Both the biostratigraphic and magnetostratigraphic datums indicate a possible hiatus between Cores 350-U1436C-17F and 350-U1436A-14X (66–74 mbsf), with linear segments above (0–66 mbsf) and below (74–127 mbsf) the inferred hiatus; LSRs are 71 m/My above the inferred hiatus and 45 m/My below it. At nearby Site 792, a hiatus was identified at 87 mbsf. A comparison of LSRs between Sites U1436 and 792 over the same interval shows broadly similar values (81–120 m/My at Site 792) in the Late–Middle Pleistocene sequence. In the late Pliocene to early Pleistocene interval, however, Site U1436 shows a low LSR (46 m/My) compared to that of Site 792 (122 m/My). This difference could be due to underestimation of the LSR below the hiatus at Site U1436 because the tie points are not well constrained as a result of the rarity of marker species. The higher MAR in the younger part of the succession could explain the higher LSR, which could be related to greater volcanic input.

Figure F19. Shipboard age model.
The biochronology at Site U1436 was primarily based on planktonic foraminifers and calcareous nannofossils. All the core catcher samples from Holes U1436A–U1436C were examined, and studies of both fossil groups showed that the upper 132 m of the cored interval in Hole U1436A (the deepest hole) span the last 2.7 My (late Pliocene–Holocene). The timing of bioevents in the undisturbed part of the succession agrees with paleomagnetic data down to the Brunhes/Matuyama reversal (0.781 Ma) at 56.8 mbsf. Deeper than 66 mbsf, several nannofossil and foraminifer bioevents were missing, indicating the presence of a hiatus. Below this potential hiatus, the rarity of markers and the occurrence of reworked specimens made identifying bioevents difficult. Planktonic foraminifers and calcareous nannofossils were generally well preserved and abundant, except in some layers where the concentration of biogenic constituents was reduced via dilution by volcaniclastics. The Pleistocene/Pliocene boundary was placed between the presence of the top of Globorotalia pseudomiocenica (2.39 Ma) in Sample 350-U1436A-18X-CC (~112 mbsf) and the occurrence of the top of Globoturborotalita decoraperta (2.75 Ma) in Sample 20X-CC (~132 mbsf). Benthic foraminifer assemblages (i.e., extinction of Stilostomelidae) corroborate this biochronology.
Paleomagnetic analysis in Hole U1436A comprised archive-half demagnetization and remanence measurement at 10 mT steps to 40 mT. Severe core disturbance resulted in complete destruction of the depositional remanence in many intervals, and discontinuous recovery (Figure F19) compromised the recognition of magnetostratigraphy in the lower half of the hole. Nevertheless, intervals of continuous recovery of tuffaceous mud yielded a good paleomagnetic record, with the drill string overprint largely removed. The base of normal Chron C1n (the Brunhes/Matuyama boundary; 0.781 Ma) was recorded at 56.8 mbsf in one of the last continuous tuffaceous mud intervals.
One discrete paleomagnetic cube was sampled per section, mostly targeting undisturbed tuffaceous mud. Discrete samples in the discontinuous record below the hiatus allowed us to recognize two additional datums: the top of normal Chron C1r.1n (0.988 Ma) between Samples 350-U1436A-9H-4, 66–68 cm (reversed), and 10F-2, 64–66 cm (normal), and the base of normal Chron C1r.1n (1.072 Ma) between Samples 10F-2, 64–66 cm, and 16X-2, 53–55 cm (reversed). Discrete samples and a patchy record in the archive half superconducting rock magnetometer (SRM) measurements indicate that Core 17X is all reversed polarity and probably still lies in the dominantly reversed Matuyama interval (<2.581 Ma).
Shear strength, natural gamma radiation (NGR), and color reflectance L* parameter all decrease in the interval deeper than 50 mbsf, which is likely related to an increase in the relative abundance of mafic ash layers in that interval. Mafic ash layers have an average magnetic susceptibility value that is more than twice as high as the average value for evolved layers.
Lithostratigraphy
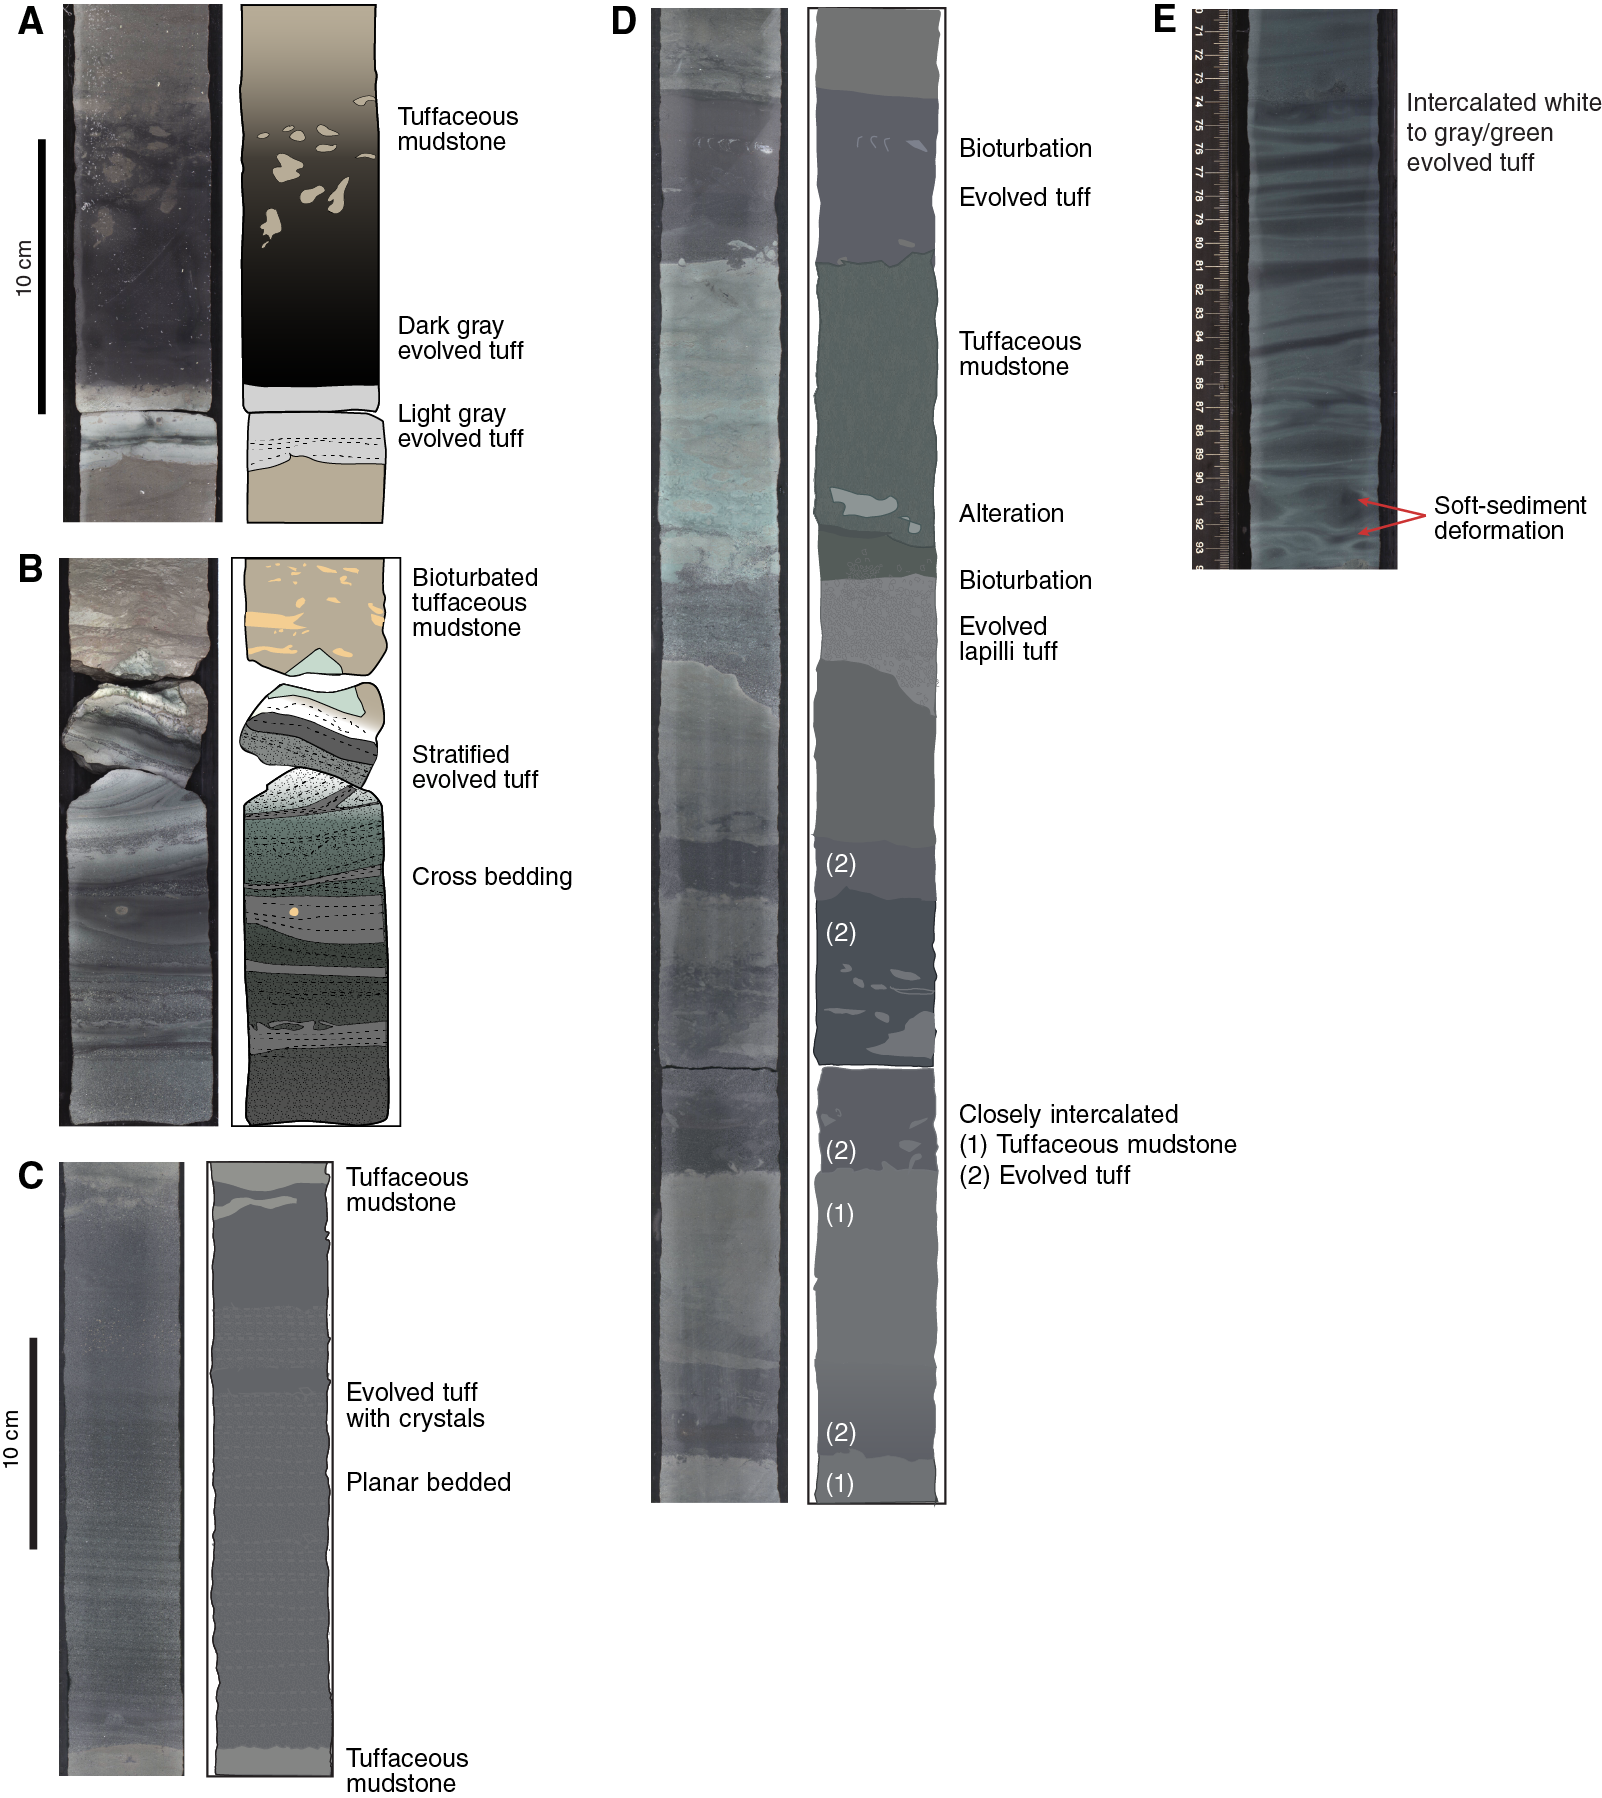
Out of the 71.6 m of core recovered in Hole U1436A, a total of 5.5 m of whole-round samples were removed for shore-based geotechnical testing and shipboard paleontological and interstitial water analysis. Of the remaining recovery, 65.7 m was measured and described as a single lithostratigraphic unit (Unit I) (Figure F20). Unit I consists of mud with dispersed ash (referred to as tuffaceous mud) with intercalated intervals of ash and lapilli-ash (~150 intervals total). Of these, ~80 intervals are mafic ash and scoria lapilli-ash and ~70 intervals are evolved ash and pumice lapilli-ash. In total, Unit I comprises ~40 m of tuffaceous mud and ~26 m of ash and lapilli-ash. The mafic intervals are 50% thicker than the evolved beds, for a total mafic to evolved thickness ratio of 1.5:1. Representative images of the tuffaceous mud and mafic and evolved volcaniclastics are shown in Figure F21A–F21C.
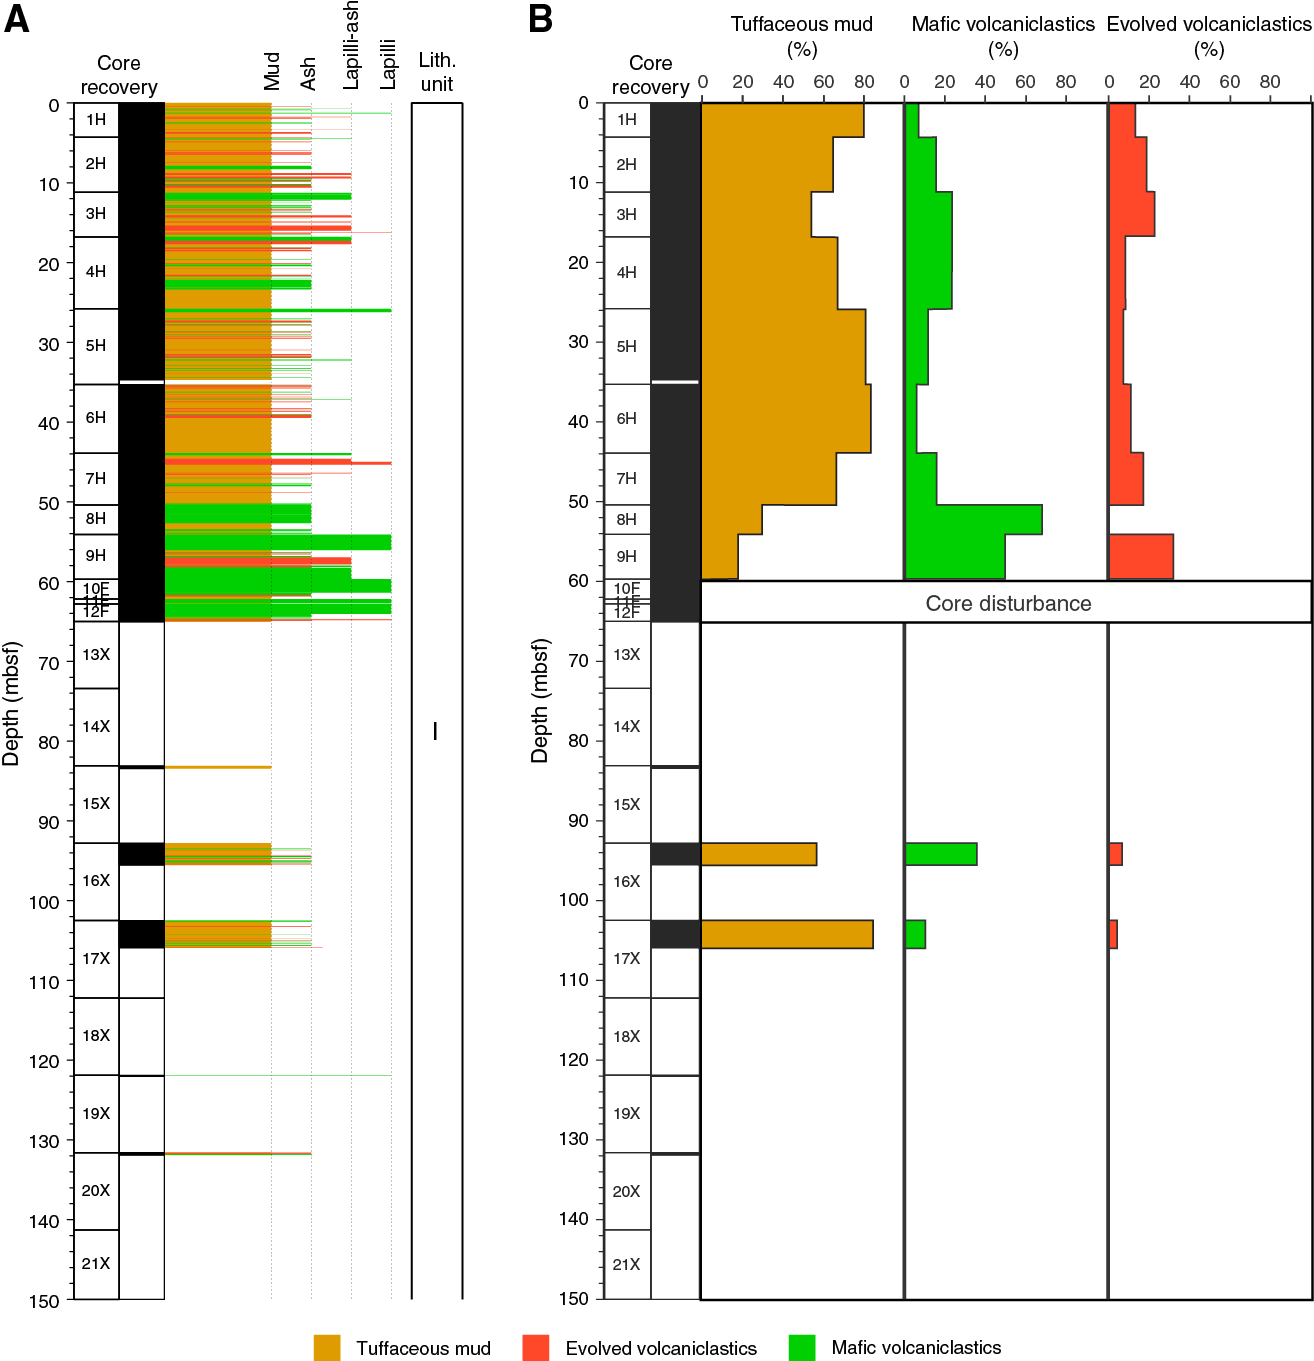
Figure F20. Summary lithostratigraphic log, Hole U1346A.
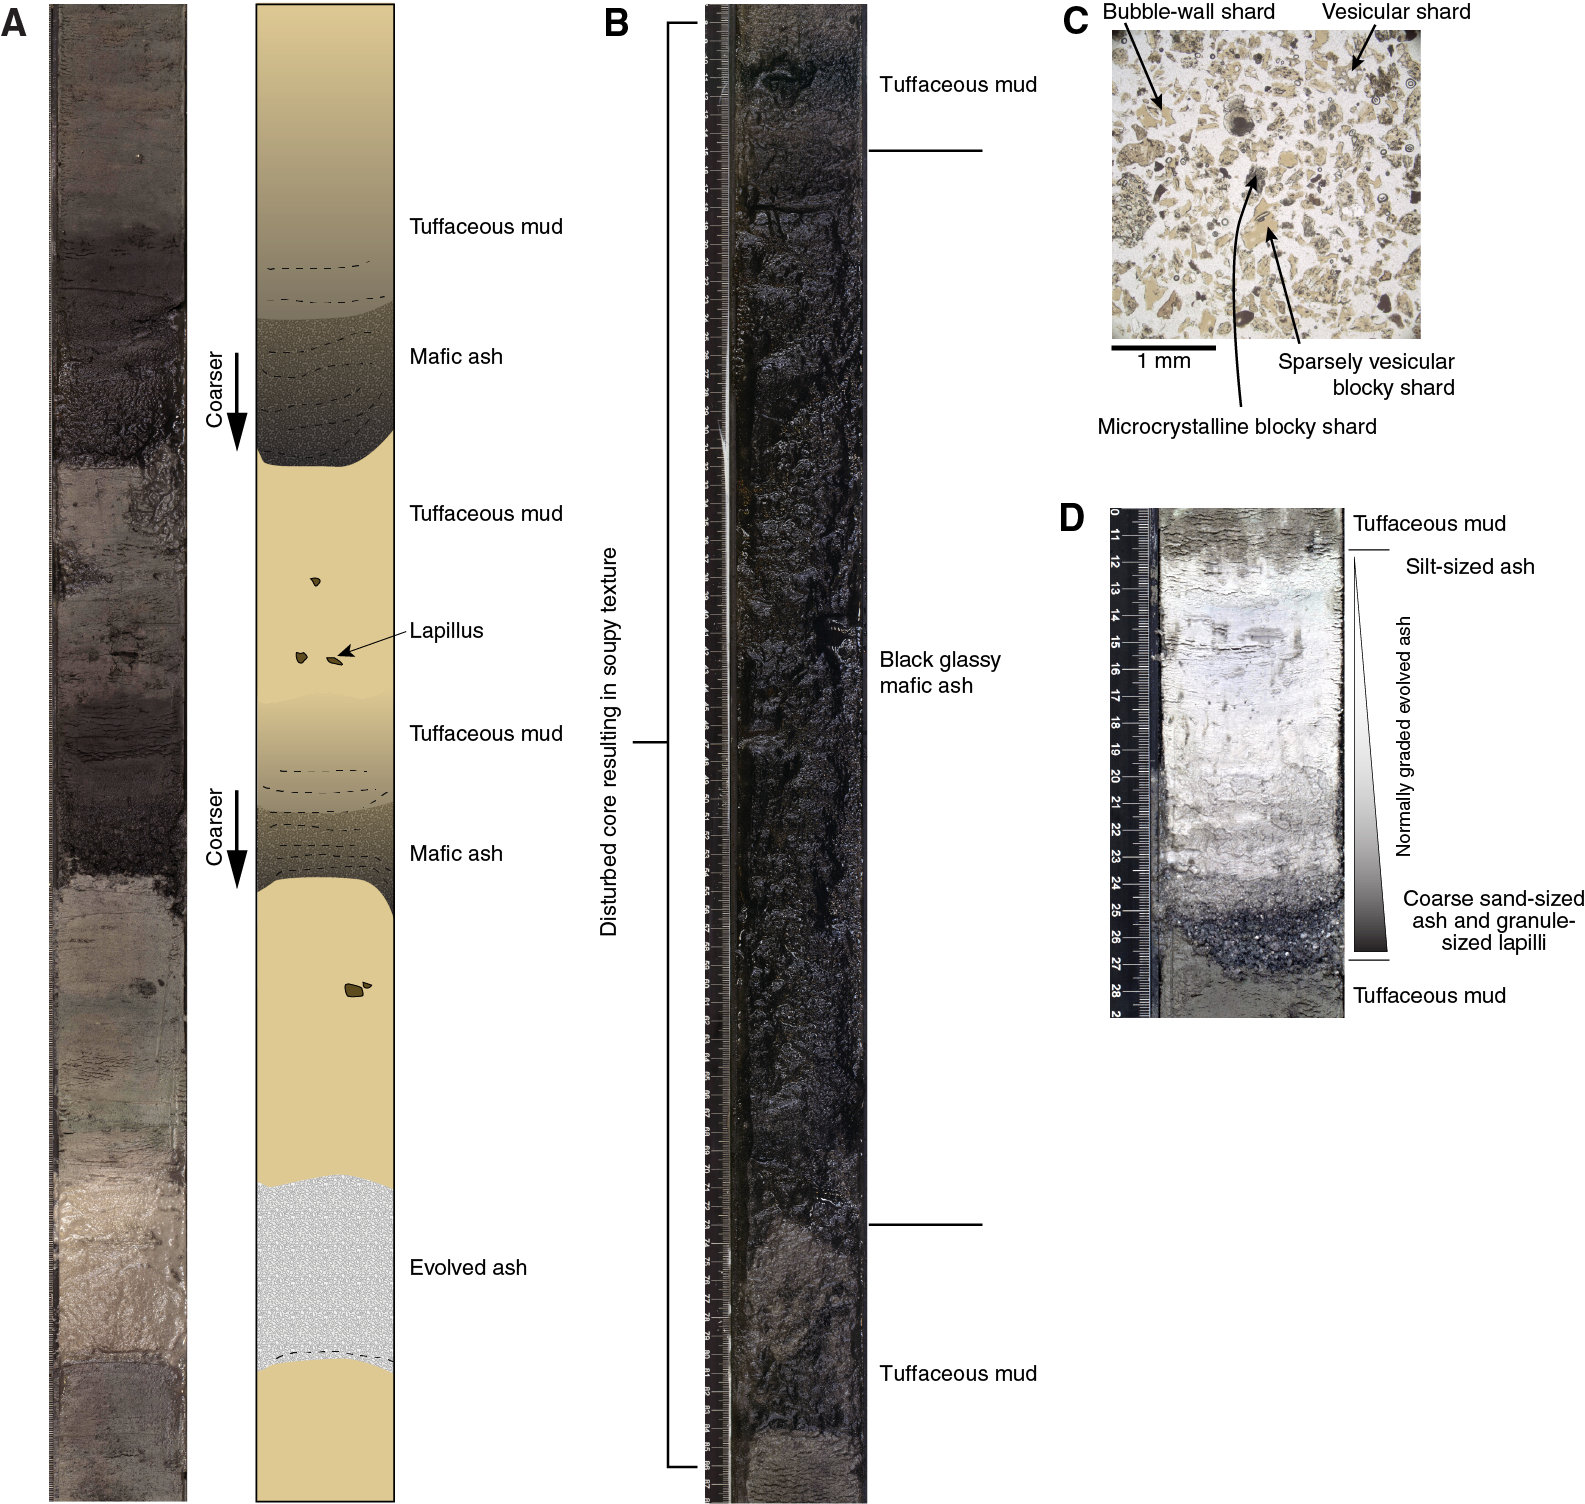
Figure F21. Hole U1436A lithologies.
Tuffaceous mud intervals average 25 cm in thickness, are up to 420 cm thick, and are massive and bioturbated. They consistently contain abundant ash, mainly vitric with rare crystals, and foraminifers. The tuffaceous mud is light gray to dark gray brown, commonly with a greenish hue. Rare glauconite (1–2 cm thick) occurs in tuffaceous mud near the top contacts with evolved ash intervals.
The mafic ash and scoria lapilli-ash intervals average 14 cm in thickness and are up to 230 cm thick, but this maximum thickness was probably greatly expanded by core disturbance (Core 350-U1436A-8H, the distinctive black glassy mafic ash discussed further below). The evolved ash and pumice lapilli-ash intervals average 9 cm in thickness and as thick as 60 cm. Pumice and scoria lapilli clasts are commonly <1 cm and angular; larger clasts are up to ~3 cm and subrounded. Most of the mafic lapilli-ash intervals have subordinate pumice, and most of the evolved lapilli-ash intervals have subordinate scoria. Most mafic and evolved intervals are normally graded with sharp bottom contacts and diffuse/gradational tops showing upcore increase in mud content.
The tuffaceous mud is interpreted to record hemipelagic background sedimentation with substantial ash contribution from explosive eruptions and/or resedimentation products, presumably originating chiefly from the Izu-Bonin arc front. Mafic and evolved ash and lapilli-ash intervals may record distinct explosive events, also from the Izu-Bonin arc front, although evolved ash may be from more distal sources. The mode of transport and deposition of the mafic and evolved ash and lapilli-ash intervals is not clear but involves some combination of subaqueous fallout and vertical settling through the water column and/or density currents.
A very distinctive ash facies, referred to as the black glassy mafic ash, occurs in interval 350-U1436A-8H-1, 0 cm, to 8H-2, 108 cm (50.22–52.66 mbsf). It lies at the top of a core and shows evidence for fall-in and thickening by core disturbance; as a result, its recovered thickness does not represent its original thickness. A second interval of black glassy mafic ash occurs in interval 8H-3, 49–64 cm (53.47–53.62 mbsf), which is attributed to mid-core flow-in. The layers contain macroscopically visible foraminifers and are the most mafic samples analyzed shipboard at Site U1436 (basaltic andesite). Under the microscope the glass is brown to greenish brown with few microlites. Glass particles are flat, blocky, curviplanar and/or plastically deformed, and contain vesicles (Figure F21D). The distinctive black glassy ash facies appears unusually homogeneous in componentry and texture, suggesting an eruption-fed origin. The overwhelmingly glassy nature of the ash further suggests subaqueous explosive eruption. The black glassy mafic ash attracted a great deal of interest in the science party because it could possibly be the product of a large-volume mafic explosive eruption. For this reason, and because time became available near the end of the cruise as a result of equipment failure at Site U1437, we returned to Site U1436 to drill three more holes (U1436B, U1436C, and U1436D) in the hope of recovering undisturbed cores containing these layers. The best example of the black glassy mafic ash was ultimately recovered in Hole U1436D, where it was contained within one core section (interval 350-U1436D-7F-2, 15–73 cm [52.97–53.55 mbsf]), overlain and underlain by tuffaceous mud (Figure 21C), thus constraining the thickness of the distinctive black glassy mafic ash to 58 cm.
Geochemistry
Inorganic and organic geochemistry measurements at Site U1436 aimed to characterize the interstitial water chemistry and elemental composition of igneous rocks and sediment samples as well as to determine the hydrocarbon gas concentrations within the sediments.
Headspace samples were analyzed routinely from every core in Hole U1436A as part of the shipboard hydrocarbon safety program. No hydrocarbon gases other than methane were detected in the cored sequences. Methane was either present in very low concentrations near or below the detection limit with an average concentration of 2.5 parts per million by volume (ppmv). Downhole interstitial water compositions obtained from selected whole-round samples (~1 per core) from Hole U1436A are generally in good concordance with previous observations at nearby Site 792 (Leg 126). Pore water Na/Cl scatters around an average of 0.86 throughout the sampled interval, which is equivalent to modern seawater. Variations in pore water compositions may be controlled by stronger seawater infiltration into porous ash-rich sections compared to muddy deposits. The most prominent deviations occur in pore waters from tuffaceous mud collected at ~13–27 mbsf, where sulfate concentrations subtly decrease (minimum = 25.8 mM) compared to seawater (28.9 mM) with concomitant subtle increases in pH and alkalinity and decreases in calcium. Magnesium concentrations are slightly elevated compared to Site 792 values at the same depths and show no evidence for magnesium sequestration because of volcanic glass alteration and clay mineral precipitation observed in the deeper sections of Site 792.
Concentrations of major elements and several trace elements in solid samples from Hole U1436A were measured by inductively coupled plasma–atomic emission spectroscopy (ICP-AES) and additional portable X-ray fluorescence (pXRF) analysis (Figure F22). Reconnaissance pXRF and ICP-AES results show excellent agreement for K2O and CaO; ICP-AES data include light elements (SiO2, Al2O3, and Na2O) not reliably obtained by pXRF, and pXRF data appear more reliable for zirconium. Composite lapilli (n = 11) and bulk ash samples (n = 3) were analyzed for a complete set of major elements by ICP-AES. Loss on ignition (LOI) values range between 0.54 and 3.8 wt% (9.8 wt% for impure tuffaceous mud) and are generally higher in evolved ash and lapilli samples compared to mafic samples. These LOI values are elevated compared to those from regional fresh subaerial volcanic rocks and in some cases indicative of secondary hydration of volcanic glass.

Figure F22. ICP-AES and pXRF results.
All but one of the Hole U1436A volcaniclastic samples define broadly linear trends in Harker diagrams (SiO2 = 54.4–70.1 wt%). They classify as low-K rocks and are indistinguishable from intermediate to acidic rocks from basalt-dominant island volcanoes of the arc front (e.g., Aogashima Volcano ~56 km to the west), although basalt (with <53 wt% SiO2; present in arc-front volcanoes) has not been found in the volcaniclastics at Site U1436. The most mafic samples are from the black glassy ash lithofacies and are basaltic andesite (55 wt% SiO2). One interval of evolved lapilli-ash (at ~45 mbsf) contains pumice with elevated K2O, indicating that it did not come from Aogashima or the East Aogashima Caldera ~45 km to the west, which have lower K2O. This pumice is similar in composition to those from submarine calderas including three within 65 km of the drill site (Myojin Knoll, Myojinsho Volcano, and South Hachijo), which exist south and north of Aogashima. Rhyolite-dominant submarine caldera volcanoes with elevated K2O are common in the arc front (Tamura et al., 2009).
Turbidites (younger than 1 Ma) from Site 792, which is 1.5 km east of Site U1436, have compositions similar to volcaniclastics collected at Site U1436. However, they are a little lower in TiO2 and higher in K2O at the same SiO2 content compared with the main trend of Site U1436 volcaniclastics, except for the high K2O pumice. Turbidites, by their nature, show a mixing trend between mafic and felsic end-members. Thus, the differences between turbidites and volcaniclastics at Sites 792 and U1436, respectively, are consistent with the existence of two types of pumice at Site U1436, which results in the turbidite mixing line being slightly different from the fractionation trends shown in Site U1436 volcaniclastics.
Site U1437: Izu rear arc
Site U1437 is located in the Izu rear arc and is ~330 km west of the axis of the Izu-Bonin Trench (Figures F1, F3) and ~90 km west of the arc-front volcanoes Myojinsho and Myojin Knoll (Figure F23A) at 2117 meters below sea level. See Table T4 for coring summary.
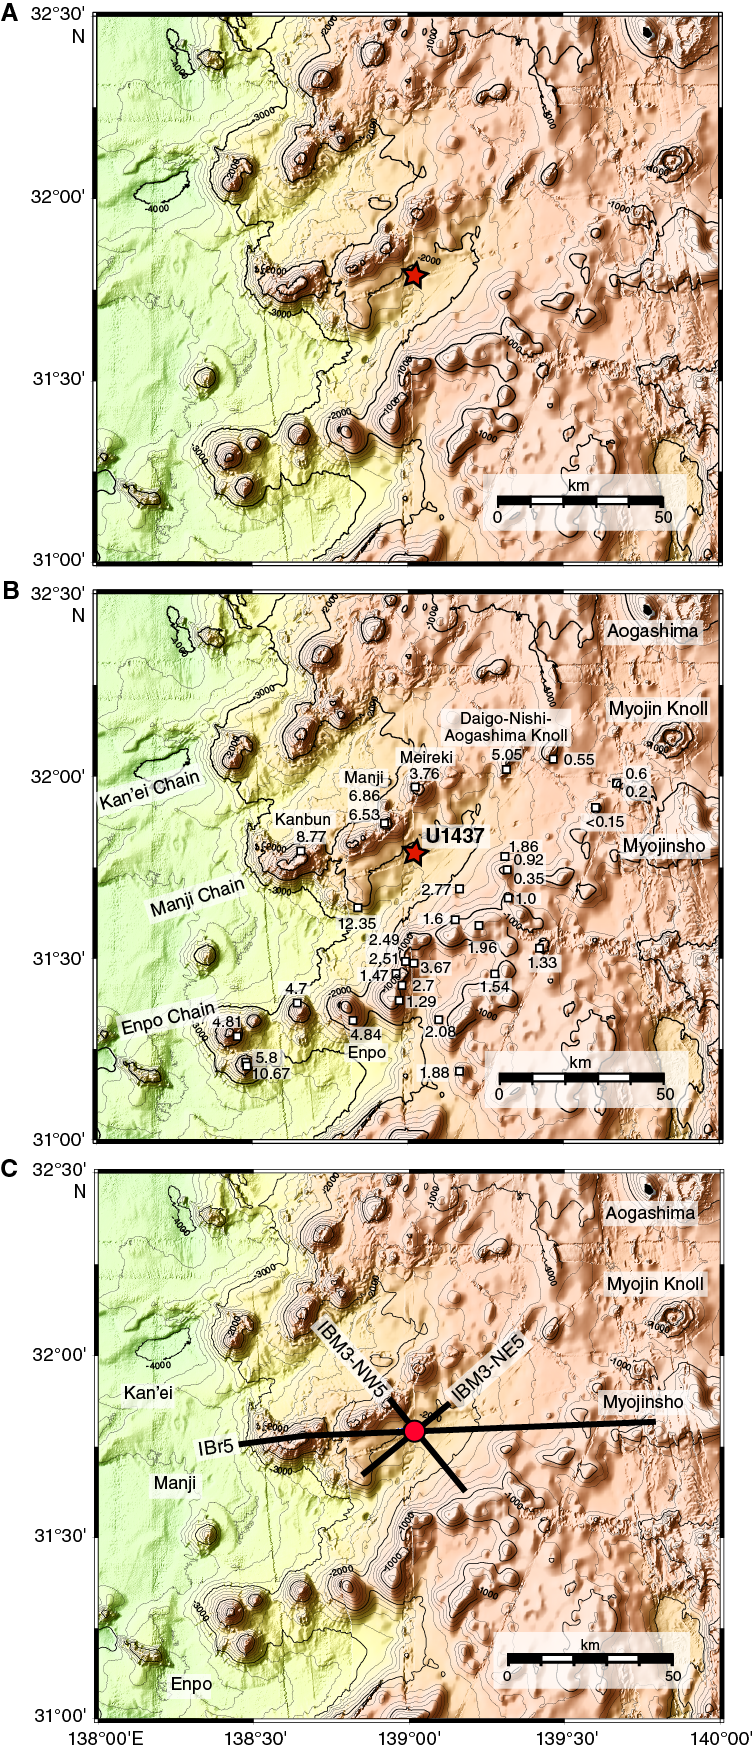
Figure F23. Bathymetric map.
The preliminary results of seismic surveys for Site U1437 are summarized briefly here from Tamura et al. (2013); full results of the seismic surveys will be presented in a full paper at a later time after drilling results are integrated (M. Yamashita, pers. comm., 2014). Numerous lines were shot in two different campaigns; parts of three seismic sections that cross at Site U1437 are plotted on Figure F23C and described here (Figures F15A, F15B, F24). Line IBr5 is the longest seismic line, running east–west from the Manji rear-arc seamount chain across the Enpo seamount chain to the arc front; it was shot both by wide-angle ocean-bottom seismometer (OBS) and by multichannel seismic (MCS) (Figure F24). The wide-angle OBS survey shows the velocity structure of the upper ~10 km, and the MCS line shows the upper ~5 km. Generally, the velocity transition to >5 km/s is thought to represent the transition to igneous rocks, perhaps representing arc upper crust lava or crystalline rocks, and the velocity transition to 6 km/s is generally thought to represent the transition to middle crust (e.g., see boundaries picked in Figure F24). Tamura et al. (2013) estimated the 5 km/s iso-velocity contour to lie at ~2100 mbsf at Site U1437 and suggested that these rocks could be Oligocene–Eocene “igneous basement,” consisting of lava and/or intrusions. Line IBM3-NW5 (Figure F15A) clearly shows that Site U1437 lies in a volcano-bounded basin between the Enpo and Manji rear-arc seamount chains.
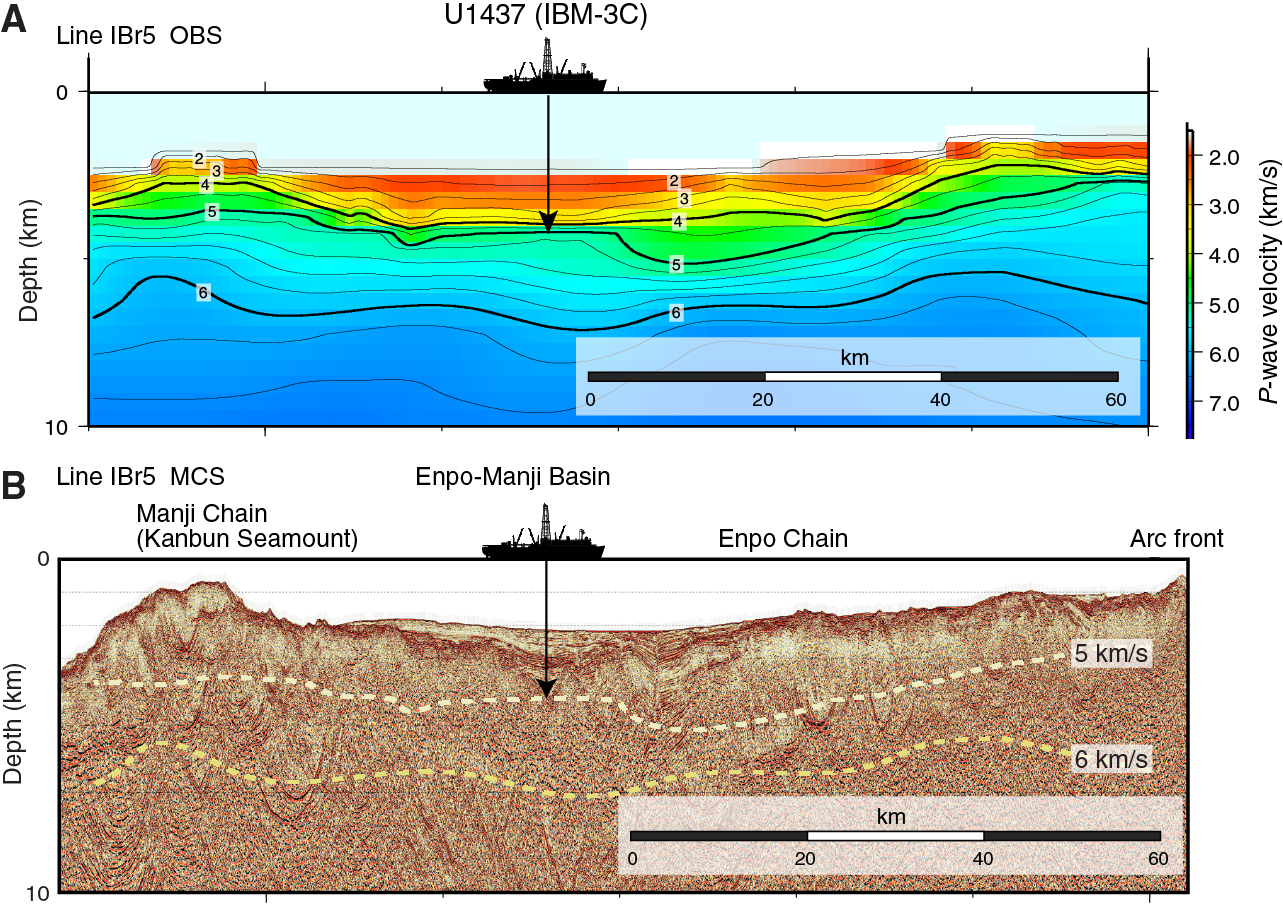
Figure F24. Seismic Line IBr5.
Biostratigraphy, magnetostratigraphy, and age model
The biochronology for Site U1437 was established based on planktonic foraminifers and calcareous nannofossils (Figure F25). Core catcher samples and several extra samples from within the core from Holes U1437B, U1437D, and U1437E were analyzed for planktonic foraminifer and calcareous nannofossil content. Deeper than 1403 mbsf, no age-diagnostic microfossils were found. Both fossil groups show that the upper 1403 m of the succession spans from the lower Pleistocene to the upper Miocene (maximum age detectable was ~11–12 Ma). The timing of bioevents agrees well with magnetostratigraphic data. Deeper than 1403 mbsf, the bioevents were difficult to establish because of poor preservation and low microfossil abundance. The decrease in preservation/abundance corresponds to a lithologic change from a succession dominated by tuffaceous mud/mudstone to one dominated by volcanic material.

Figure F25. Shipboard biostratigraphic and magnetostratigraphic datums.
Foraminifers
A total of 146 core catcher samples were examined for planktonic and benthic foraminifer content. In the upper ~543 m of the succession (Holocene to lower Pliocene) planktonic foraminifers are generally abundant, diverse, and show moderate to good preservation. Recognizing foraminifer datums deeper than ~543 mbsf became increasingly challenging because of a combination of low foraminifer abundance, lack of age-diagnostic species in most of the assemblages, poor preservation, and/or induration of sediments. Induration posed great difficulties in extracting the foraminifers. At 805–1009 mbsf (lithostratigraphic Unit III), many samples are barren of foraminifers, or where foraminifers are present, they show strong evidence of both plastic deformation and recrystallization, presumably due to compaction. Less deformed foraminifers were recovered at 1021–1088 mbsf, but most are present as internal molds.
In terms of datums, the Pliocene/Pleistocene boundary (2.588 Ma) is placed somewhere between 372 and 416 mbsf. Many typical age-diagnostic fauna are very rare or absent in this succession. The datums in the lower part of the succession (deeper than ~570 mbsf) indicate an age of at least 6 Ma.
Calcareous nannofossils
Calcareous nannofossils were abundant and well preserved throughout Holes U1437B and U1437D to 669 mbsf. At 677–1806 mbsf, moderate to poor preservation is recorded and several samples are barren in nannofossils. A Middle–Upper Pleistocene sequence was recovered in Hole U1437B (0–439 mbsf). In Hole U1437D (427–1104 mbsf), the succession spans the upper Miocene to Pliocene. The last reliable datum indicator is the top of Triquetrorhabdulus rugosus (871 mbsf). Since the preservation of nannofossils quickly deteriorates deeper than 677 mbsf, it was not possible to recognize other bioevents in the middle Pliocene to upper Miocene part of the succession. Preservation in Hole U1437E is very poor, and from 1312 mbsf downhole the majority of the samples are barren in nannofossils. A broad age range of 10.97–11.85 Ma is provided for Sample 350-U1437E-36R-CC (1403 mbsf; Biozone CN5b). Biozones CN10a to CN6 are not identifiable because preservation issues affect the presence of markers (e.g., the different species of Discoaster, Catinaster, and Minylitha convallis).
Magnetostratigraphy at Site U1437 was determined from 30 mT demagnetization and measurement of natural remanent magnetization of archive section halves using the SRM, supported by polarity identified by measurement of discrete samples after alternating field or thermal demagnetization. A total of 29 magnetostratigraphic datums, marking the tops and bases of normal polarity chrons and subchrons, were identified. Every chron and subchron in the sequence down to Subchron C3An.2n (6.436 Ma; 1056.65 mbsf) was recognized. Where biostratigraphic datums were available, they agreed very well and consistently with the magnetostratigraphic interpretation, but magnetostratigraphy became the main control on the depositional age model deeper than 550 mbsf.
Normal polarity of Subchron C3An.2n persisted to the bottom of Hole U1437D, but cores in Hole U1437E, which started at the same subbottom depth as the base of Hole U1437D, commenced immediately in reversed polarity. We suggest that a normal fault at or near the base of Hole U1437D has caused a loss of section between the two holes. Pattern matching of the polarity record in Hole U1437E indicated that the reversed polarity interval began immediately above normal Subchron C4n.1n, and magnetostratigraphy could then be followed down as far as the top of Chron C4An (8.771 Ma) at 1302 mbsf. Magnetostratigraphy in Units VI and VII was impossible to recognize, with the exception of reversed polarity seen at 1389.35 mbsf (igneous Unit 1), which was the first indication that coring had proceeded below the base of normal Chron C5n.2n (9.984–11.056 Ma) spanning the upper part of the lowest nannofossil age range.
Extrapolating the magnetostratigraphy from the last datum at 8.771 Ma (1302 mbsf) near the base of lithostratigraphic Unit V to 1402 mbsf substantially underestimates the age of the nannofossil datum of 10.97–11.85 Ma at this depth. The most likely explanation is a hiatus at the lithostratigraphic Unit V/VI boundary (1320 mbsf).
At Site U1437 it was possible to identify a Pleistocene to upper Miocene succession (Figure F25). Fourteen biostratigraphic and 29 magnetostratigraphic datums obtained in the upper 1303 mbsf of the succession were selected to construct the age-depth model. The age model has not been extended deeper than 1303 mbsf because no biostratigraphic or magnetostratigraphic datums are detectable from 1303 to 1806 mbsf. Also, no biostratigraphic datums are recognized deeper than 867 mbsf; thus, the age model for 867–1303 mbsf was constructed using only magnetic reversal datums.
Seven intervals were selected to calculate the LSR, assuming constant sedimentation rates within those intervals. The LSRs range from a minimum of 98 m/My to a maximum of 259 m/My. The highest LSR (259 m/My) is found from the top of lithostratigraphic Unit II through the upper part of Unit III, to ~825 mbsf. A minimum LSR of 98 m/My is recorded from 825 to 844 mbsf. Lithostratigraphic Units IV and V record an increase in LSR with values of 157 and 146 m/My.
An offset in the LSR between intervals 868–1056 and 1122–1302 mbsf corresponds to the change from Hole U1437D to U1437E and also to a missing interval in the magnetostratigraphy. The probable explanation is a normal fault between the two holes, resulting in a partial loss of section within lithostratigraphic Unit IV. If the LSRs within lithostratigraphic Unit V are extrapolated to Unit VI, ages are about 0.6 My less than the minimum age constraint given by the nannofossil assemblage at 1403 mbsf (10.97–11.85 Ma); a hiatus or erosion is the most likely explanation for this discrepancy, given that sedimentation rates would be expected to be high in the coarse-grained Unit VI.
One additional age control point was added postcruise before publication of this report. Sample 350-U1437E-35R-1, 76 cm, to 35R-2, 55 cm (1388.86–1390.07 mbsf) from igneous Unit 1 (see below) has a preliminary U-Pb zircon concordia intercept age of 13.6 +1.6/−1.7 Ma (2σ error; mean square of weighted deviation [MSWD] = 2.12; number of analyses n = 9) (Schmitt, pers. comm., 2014). This age is not entirely consistent with the broad and preliminary age range of 10.97–11.85 Ma provided by nannofossil age indicators at 1403 mbsf and will require postcruise resolution.
Lithostratigraphy and physical properties
Site U1437 was drilled in three holes (U1437B, U1437D, and U1437E), which we divide into seven lithostratigraphic units (Figures F26, F27A, F27B; Table T5) and one igneous unit, all described in this section. Physical properties for Site U1437 (Figure F27A, F27B) are discussed with reference to the lithostratigraphic units below. Summary lithostratigraphic logs for Holes U1437B, U1437D, and U1437E are shown in Figure F28A, F28B, and F28C, respectively. The downhole evolution in proportion of tuffaceous mud and volcaniclastics is shown in Figure F29, dividing the volcaniclastics further into relative proportion of mafic and evolved materials (Holes U1437B and U1437D) or composition of volcanic clasts (Hole U1437E).
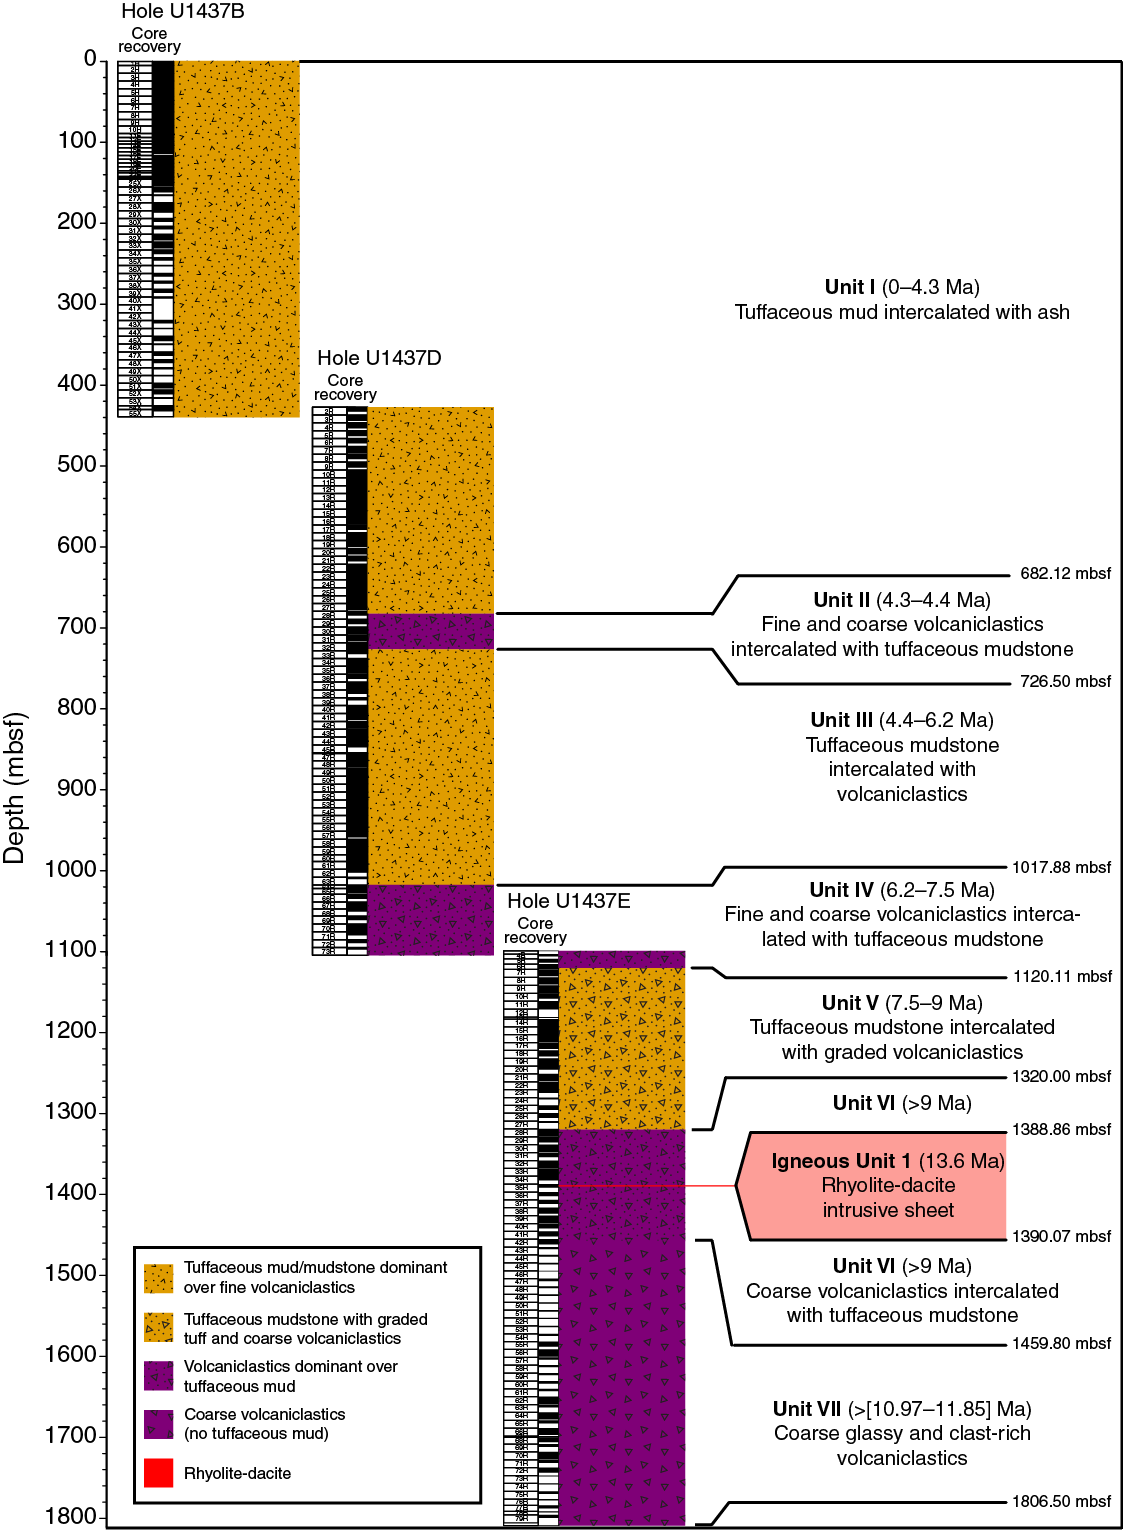
Figure F26. Summary lithostratigraphic log, Site U1437.
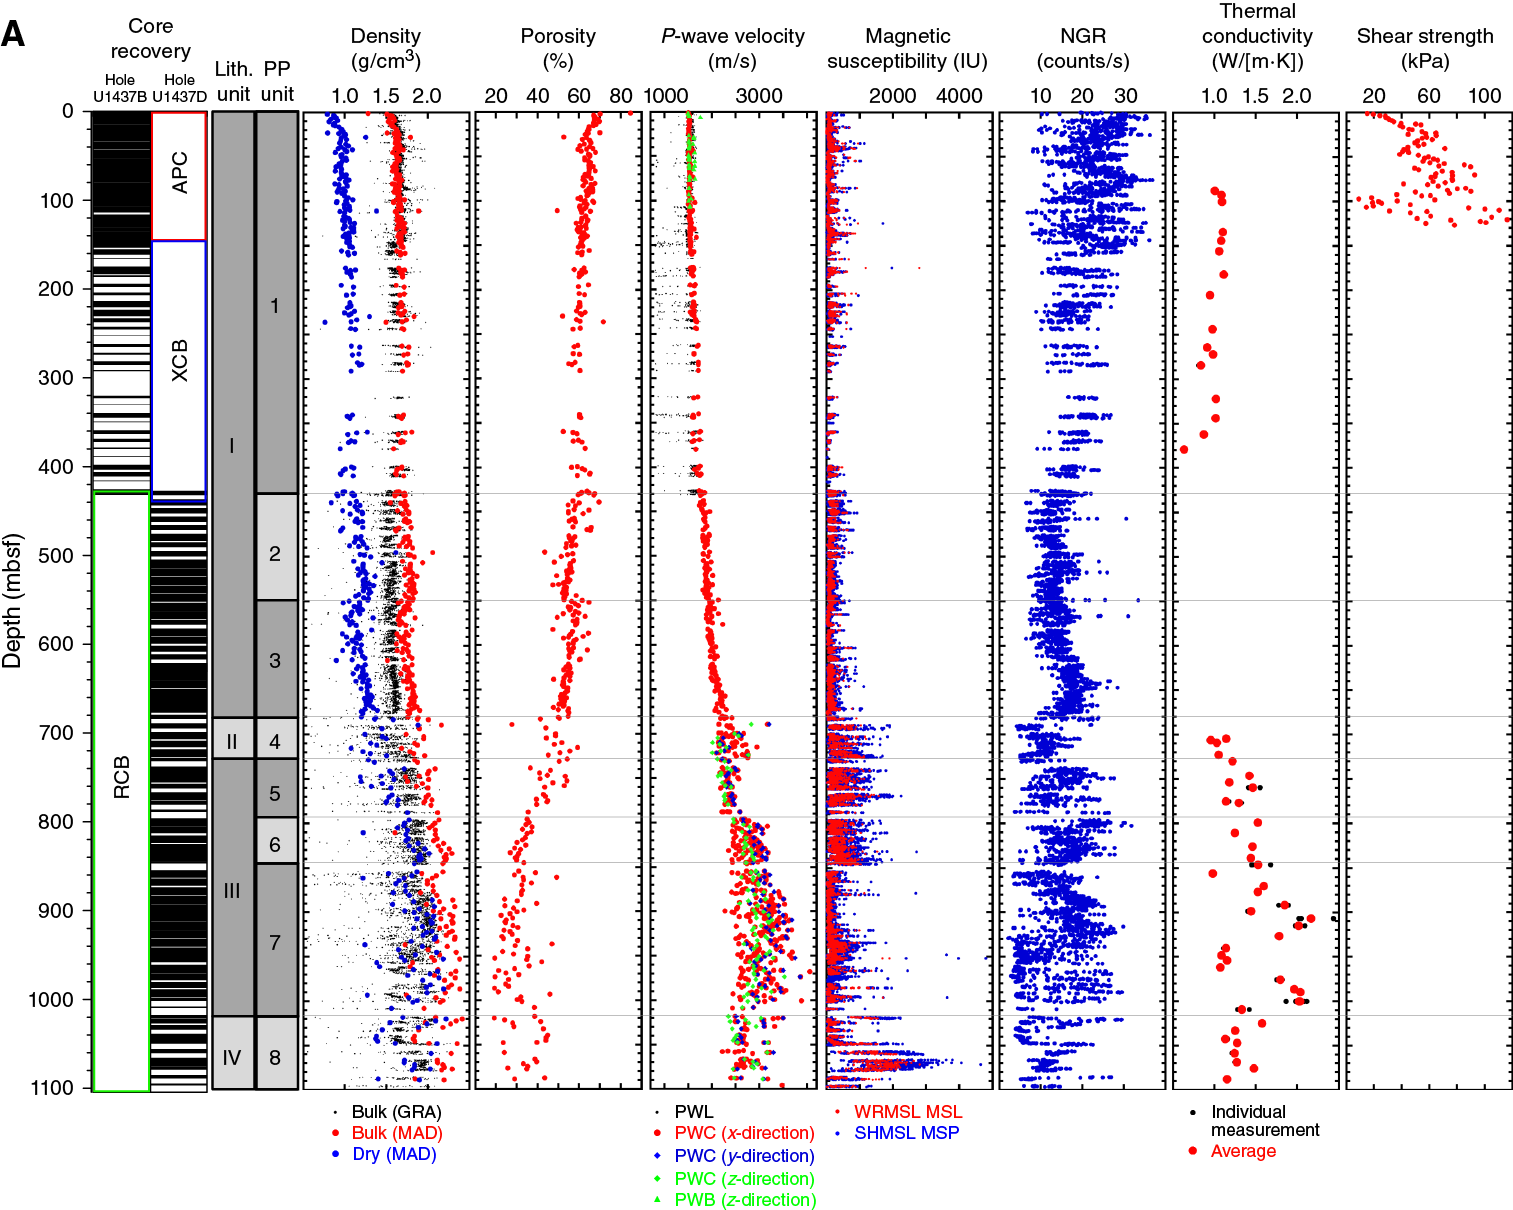
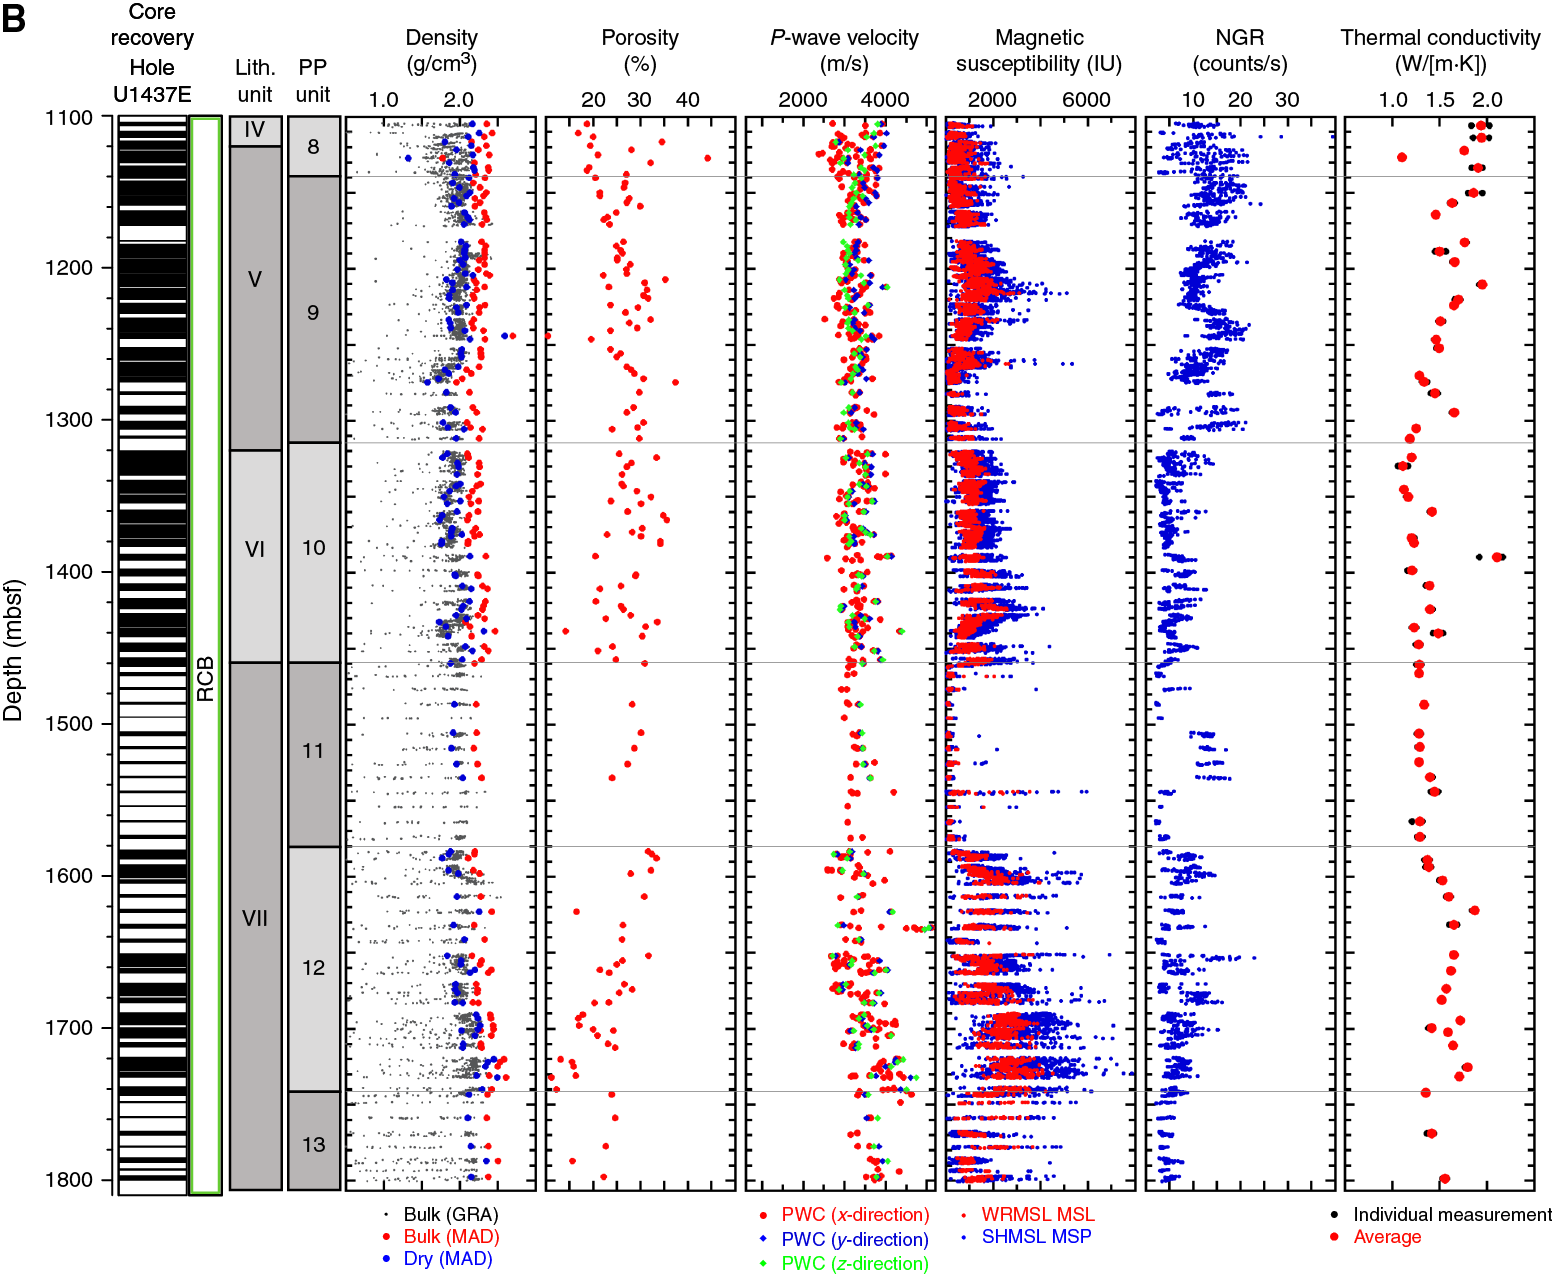
Figure F27. Physical properties summary.
Table T5. Lithostratigraphic units. Download table in .csv format.
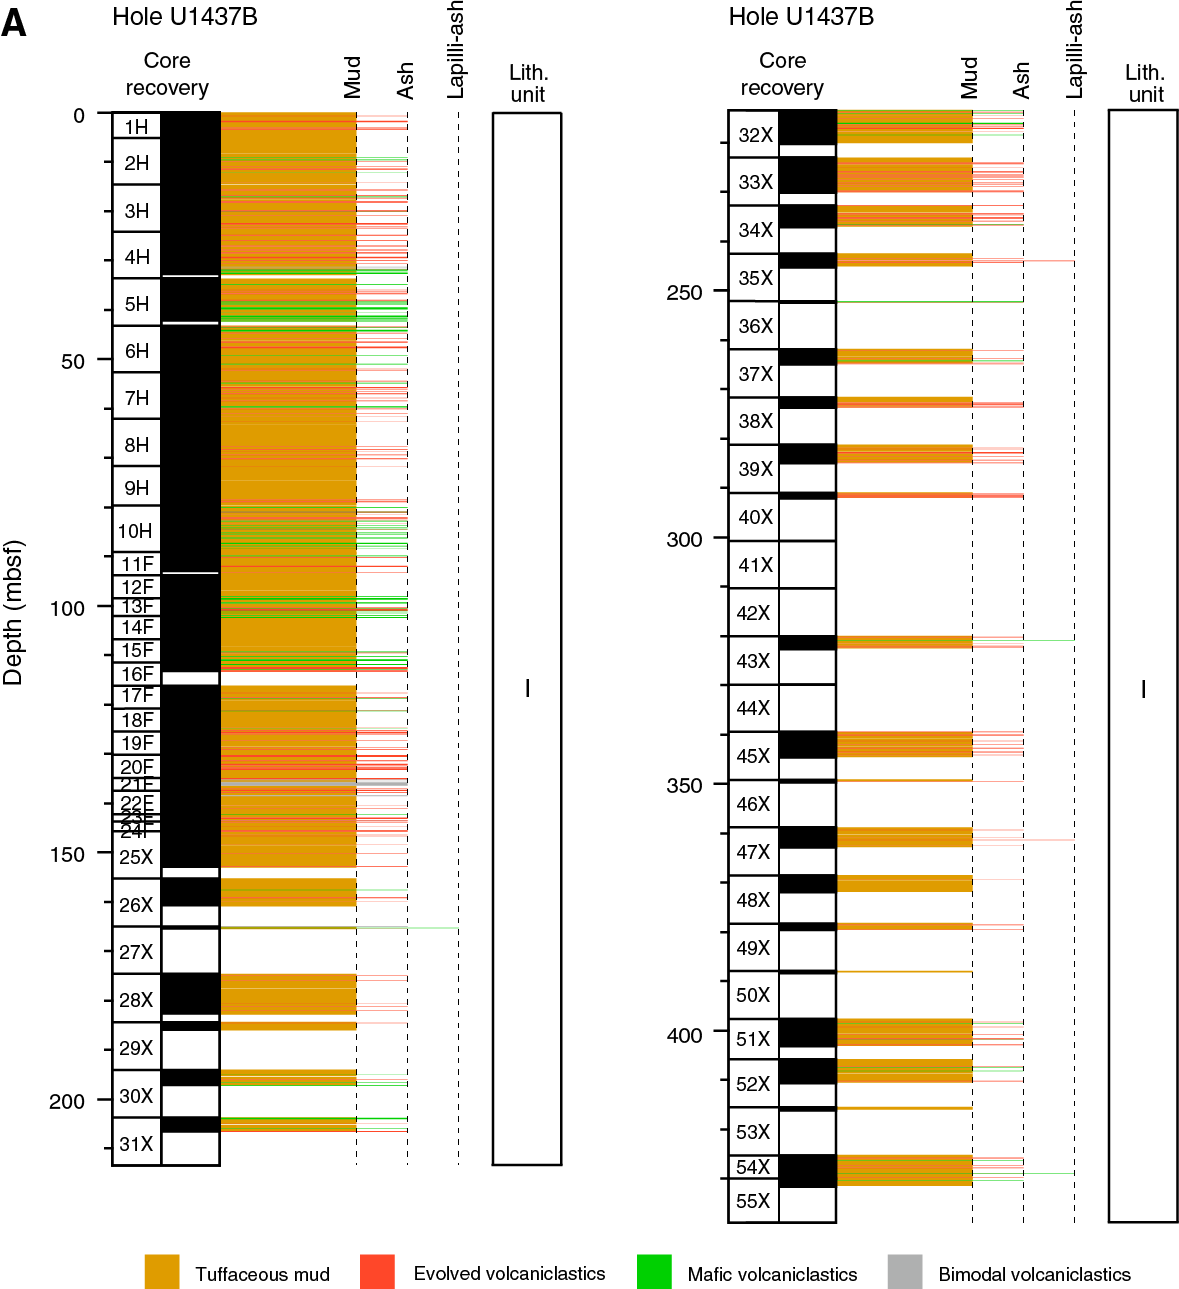
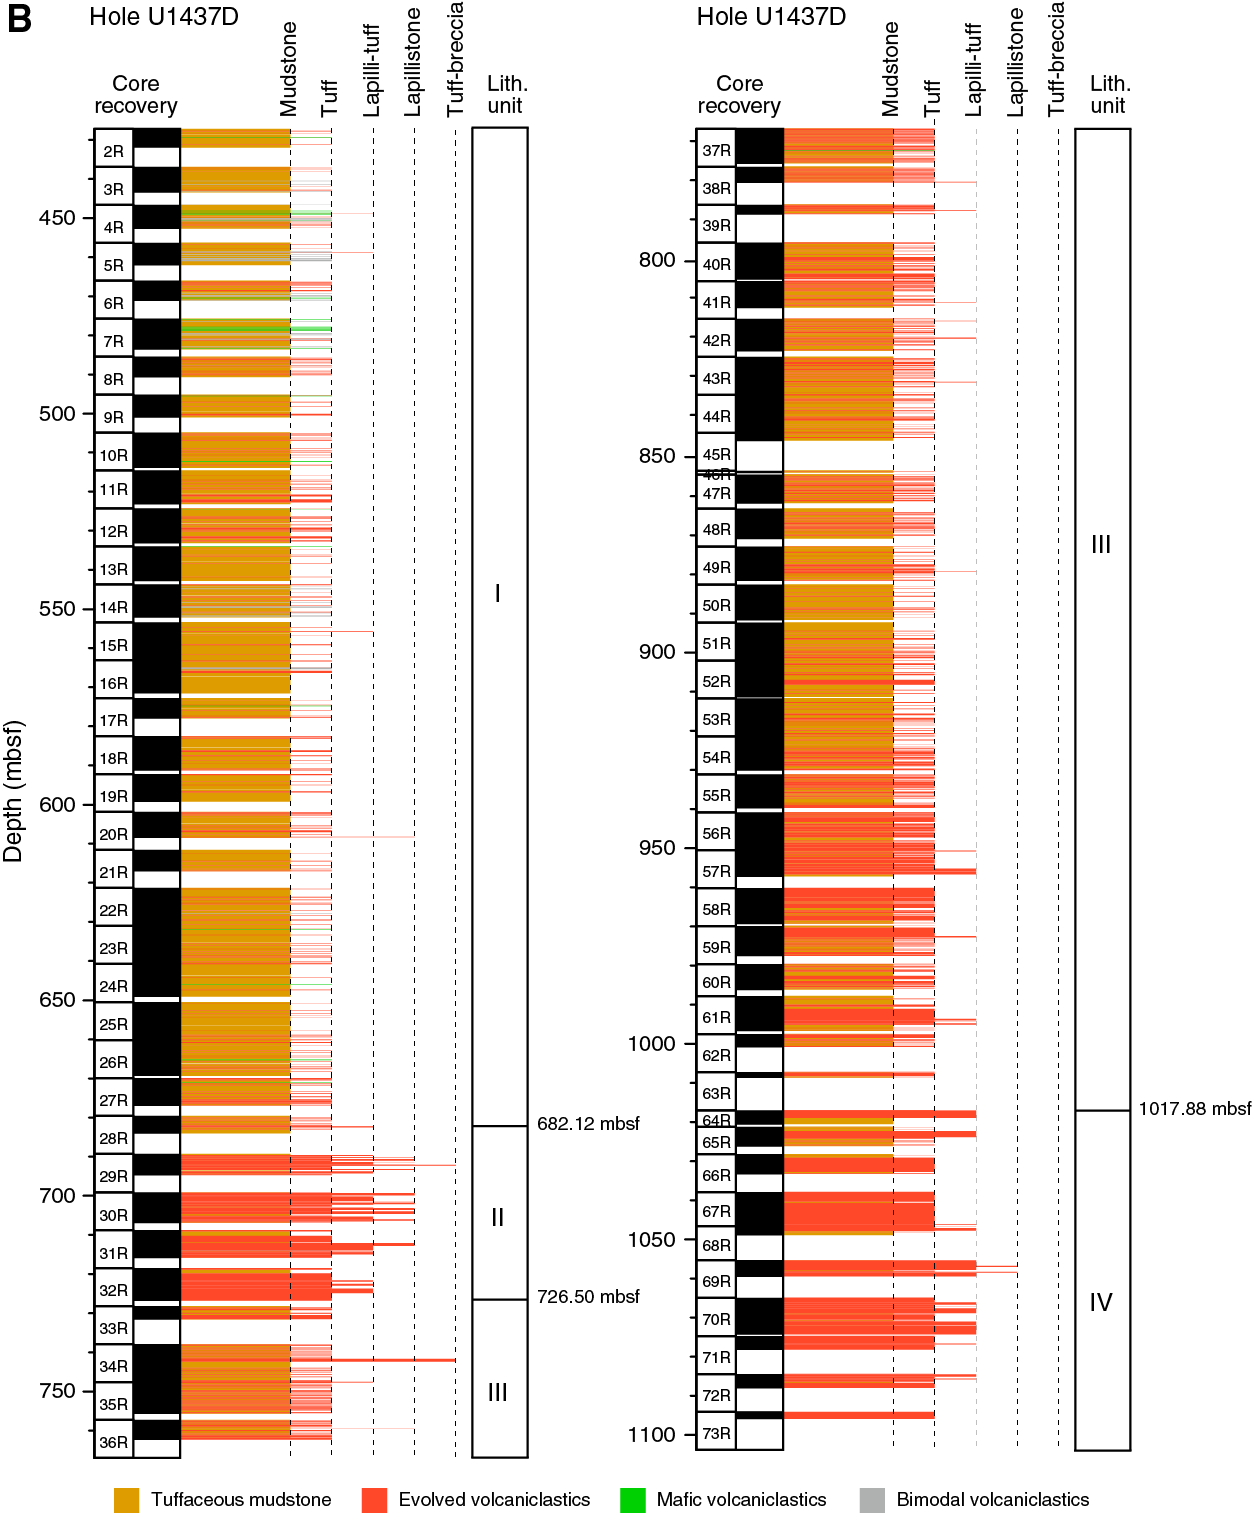
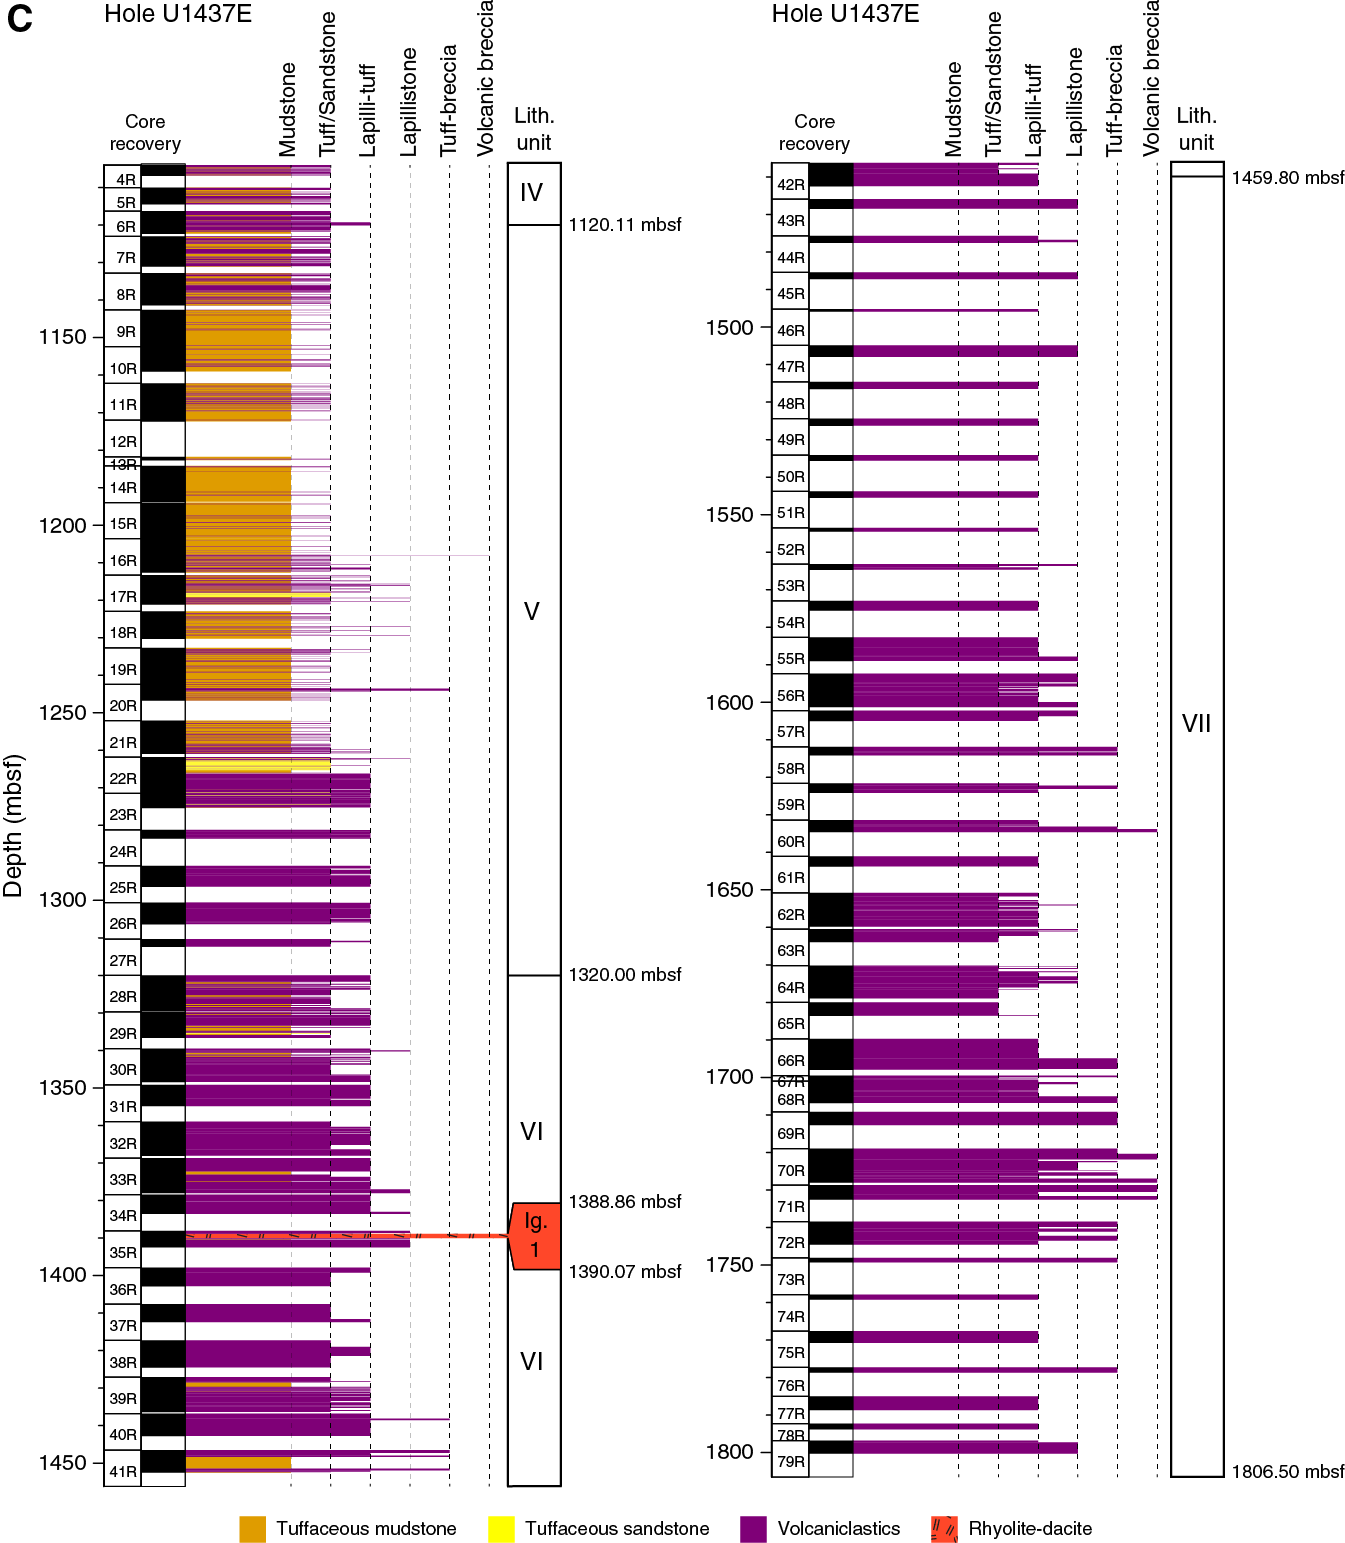
Figure F28. Summary lithostratigraphic logs, Site U1437.
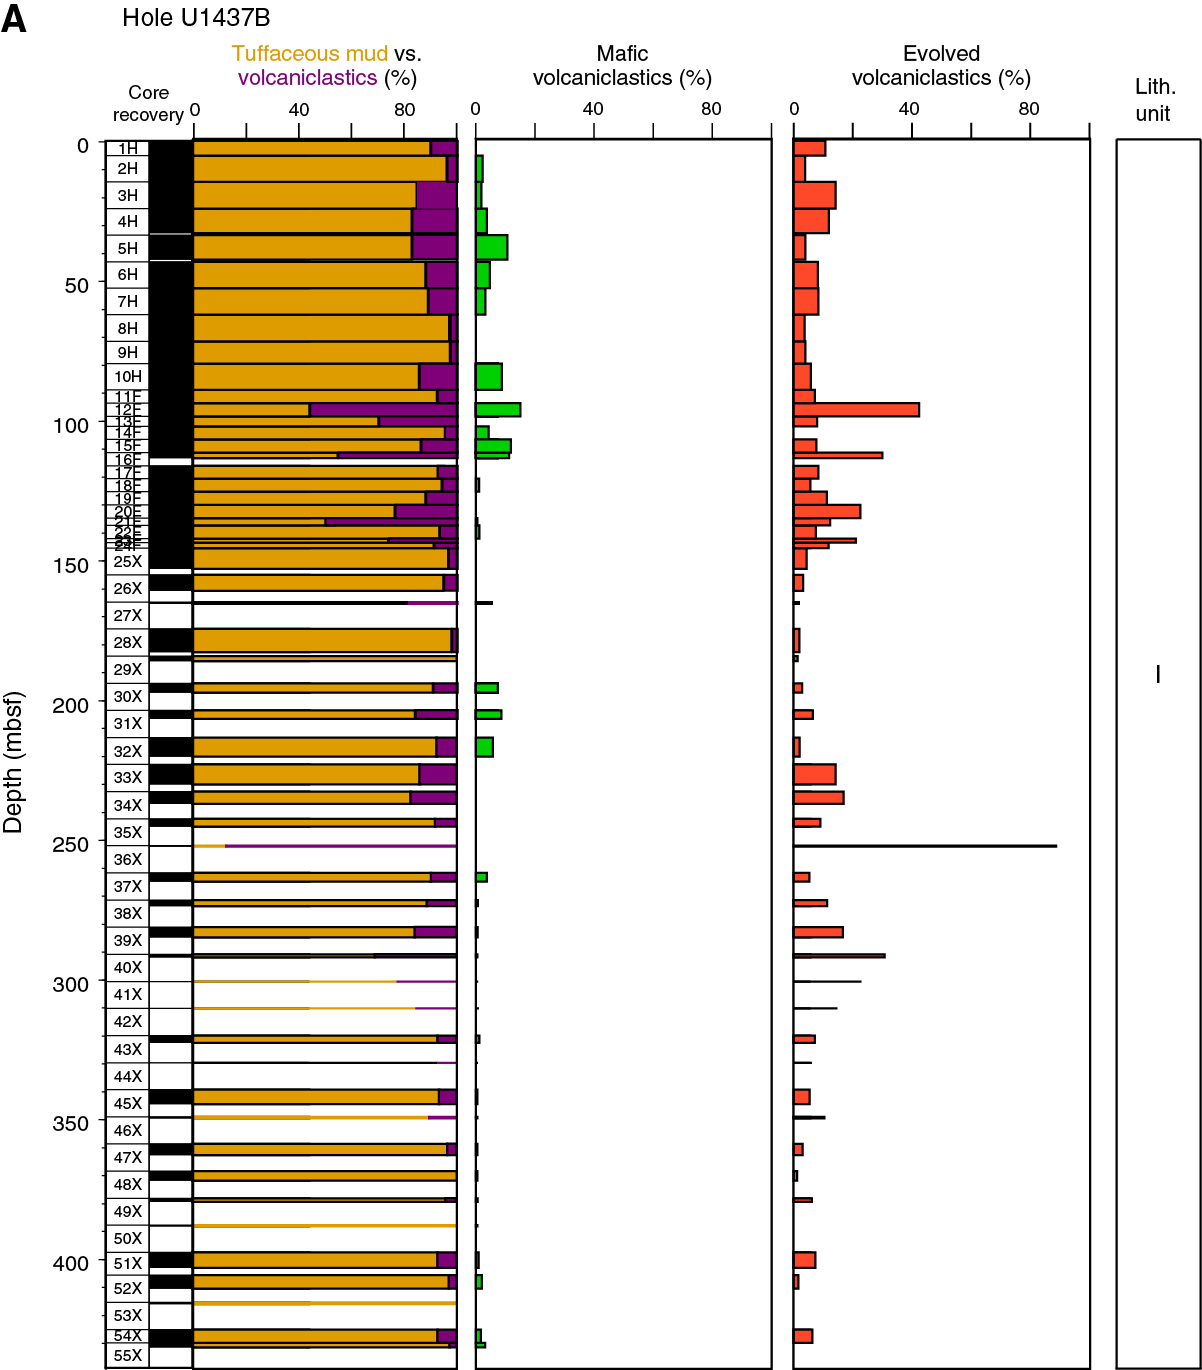
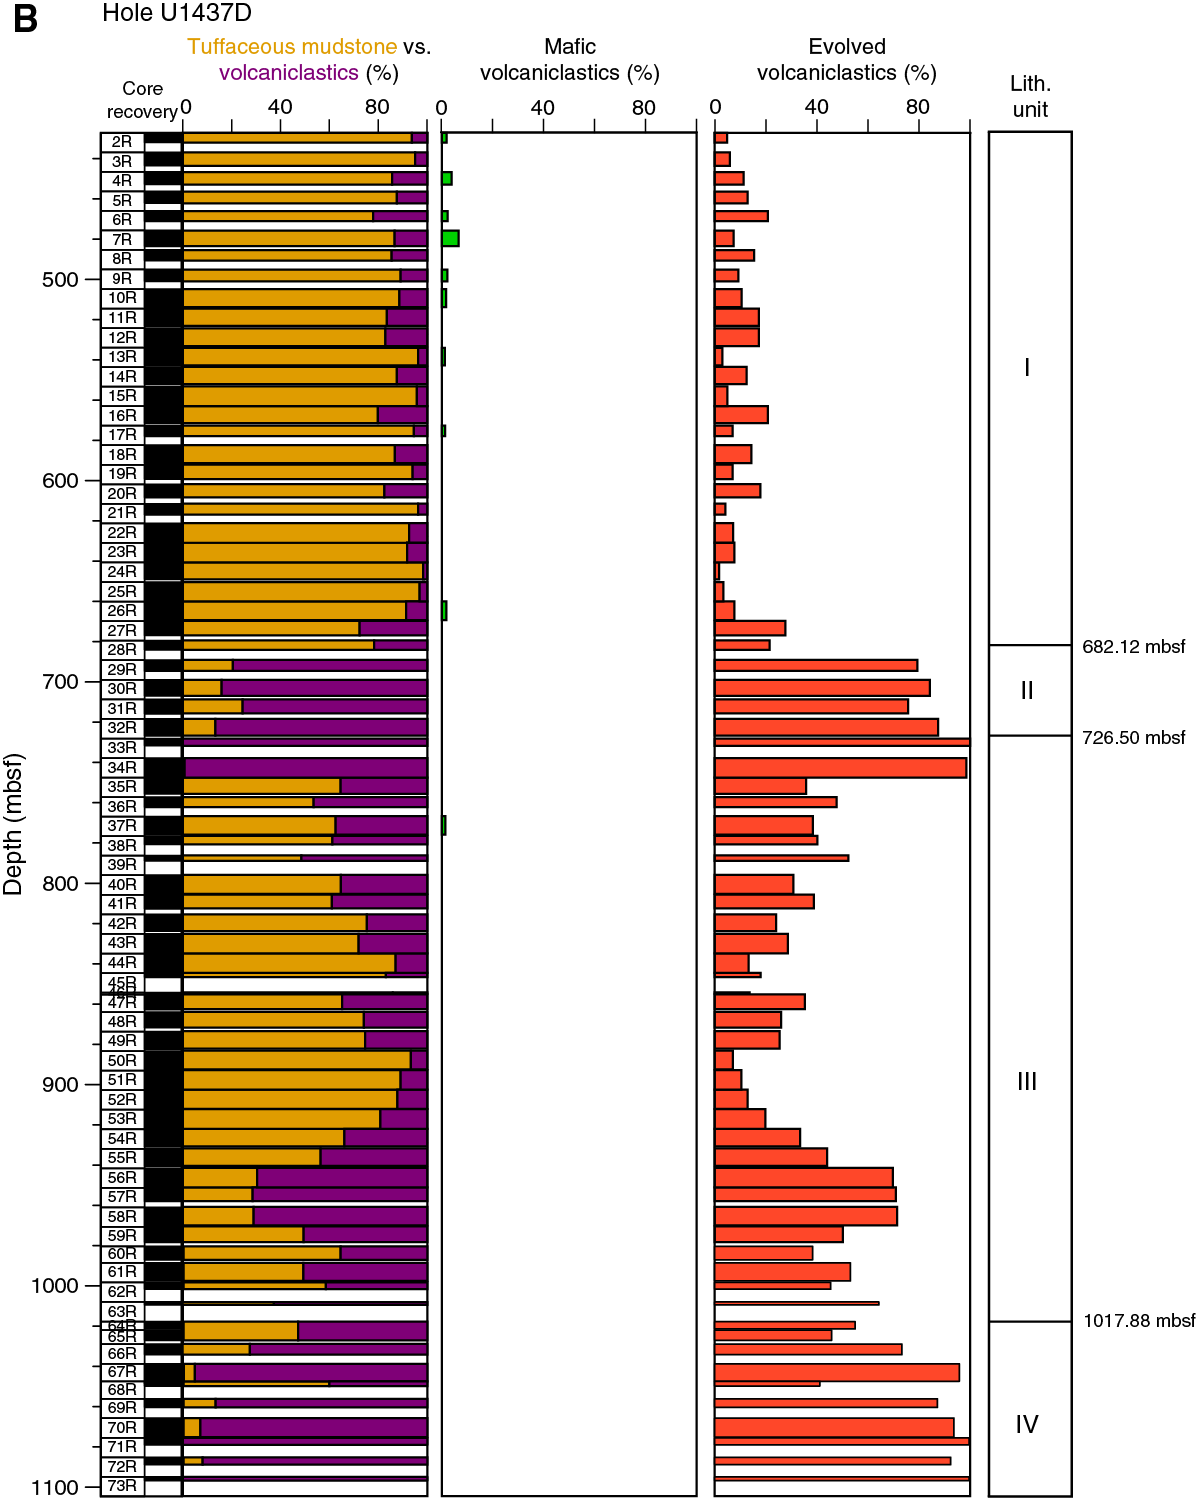
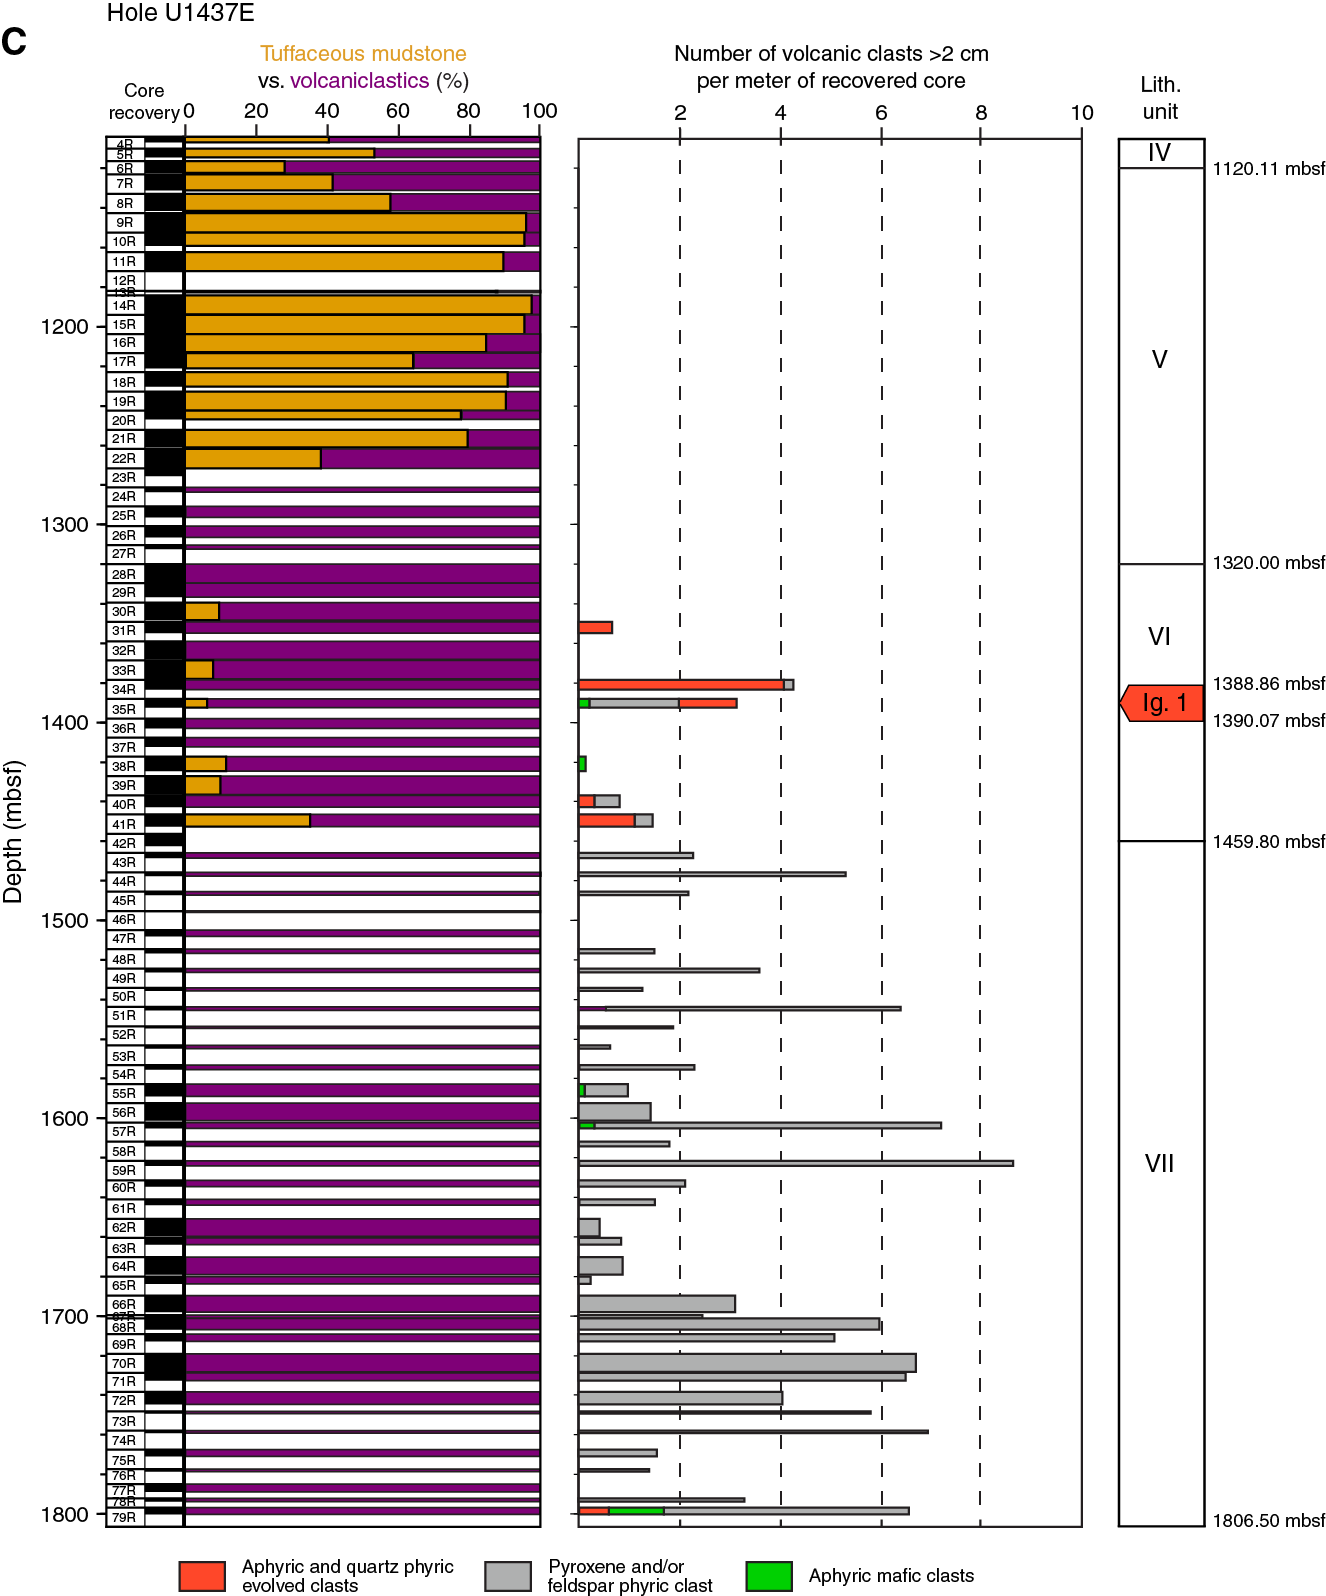
Figure F29. Downhole proportions of mud and volcaniclastics.
Lithostratigraphic Units I–VII are distinguished from each other based on the proportion and characteristics of tuffaceous mud/mudstone and interbedded tuff, lapilli-tuff, and tuff-breccia. The tuffaceous mud/mudstone is strongly to intensely bioturbated. Alteration becomes more pervasive and increases in intensity downhole; it is initially predominantly glauconitic–smectitic and eventually becomes more chloritic. Iron sulfides are pervasive throughout both holes, especially as replacements of worm burrows, and according to rock magnetic properties, greigite is progressively replaced by pyrite downhole in Hole U1437D. Compaction of sediment at Site U1437 increases linearly from ~0% shallower than ~410 mbsf to ~36% at the base of Hole U1437D (~1100 m). The transition from unconsolidated to lithified rocks occurred progressively; however, sediments were considered lithified from 427 mbsf (top of Hole U1437D) downward.
Lithostratigraphic Unit I
Unit I (interval 350-U1437B-1H-1, 0 cm, to 350-U1437D-28R-2, 112 cm [0–682.12 mbsf]) is 0–4.3 Ma in age, 682.12 m thick, and consists largely (88%) of mud/mudstone with 25%–75% dispersed ash, referred to as tuffaceous mud/mudstone (Figure F28). For fine-grained deep marine sediment, it has a high sedimentation rate of ~118 m/My in the uppermost 230 m (0~2 Ma) and ~200 m/My in the lower part of Unit I (2~4.3 Ma). Unit I has minor (12%) volcaniclastics, consisting almost entirely of ash (unlithified) or tuff (lithified) intervals (n = 649); only 11 of these intervals contain lapilli, for a total thickness of 59 cm, or just 1.2% of the volcaniclastics. Furthermore, the lapilli are small, averaging ~1 cm in size. Ash or tuff beds have a median thickness of just 8 cm, whereas tuffaceous mud/mudstone intervals have a median thickness of 26 cm. The sparseness, thinness, and fine grain size of discrete volcaniclastic layers in lithostratigraphic Unit I is enigmatic, given that it accumulated in close proximity to volcanoes of the active rift and back-arc knolls extensional zone (<3 Ma) and rear-arc seamount chains (>3 Ma), in addition to lying within 90 km of the arc front (Figure F6).
Unit I includes five lithofacies types. The most common is tuffaceous mud/mudstone containing abundant fine colorless glass shards and rare crystals, plus carbonate materials such as foraminifers. It is typically bioturbated and commonly has green horizons (possibly glauconite) where it overlies evolved ash/tuff. Pyrite clots and greigite are associated with bioturbation in the tuffaceous mudstone.
We differentiated three lithofacies of ash/tuff: evolved (white to dark gray), mafic (black) (Figure F30), and bimodal. Evolved ash/tuff intervals (n = 480) are four times as common as the mafic ash/tuff intervals. The evolved ash/tuff intervals are on average only 7 cm thick but individual intervals can reach a maximum of 70 cm, with the thickest intervals occurring mainly between 100–140 and 530–600 mbsf. The evolved ash/tuff intervals are mainly vitric with sharp bases, and tops that grade upward into tuffaceous mudstone, some with a crystal-rich base dominated by plagioclase with lesser pyroxene. Some ash/tuff intervals are laminated with darker layers richer in crystals and pumice grains and lighter layers richer in glass shards. Hornblende is found in only 7% of the evolved ash/tuff intervals; these are mainly in the lowermost part of lithostratigraphic Unit I, where hornblende-bearing ash has elevated K2O contents relative to most of the other evolved ash intervals, suggesting that these record rear-arc seamount volcanism rather than arc-front or rift volcanism (see Geochemistry). The mafic ash/tuff intervals are macroscopically black, containing brownish glass, although inspection under the microscope reveals that the ash commonly includes some colorless evolved glass. Their average thickness is 8 cm, with a maximum of 30 cm. They are often normally graded with sharp bases rich in plagioclase and pyroxene crystals and diffuse, bioturbated upper boundaries. A small number of intervals (n = 47) are described as bimodal because microscopic inspection reveals that these intervals contain >25% of both colorless and colored glass, but colorless glass predominates in most cases.
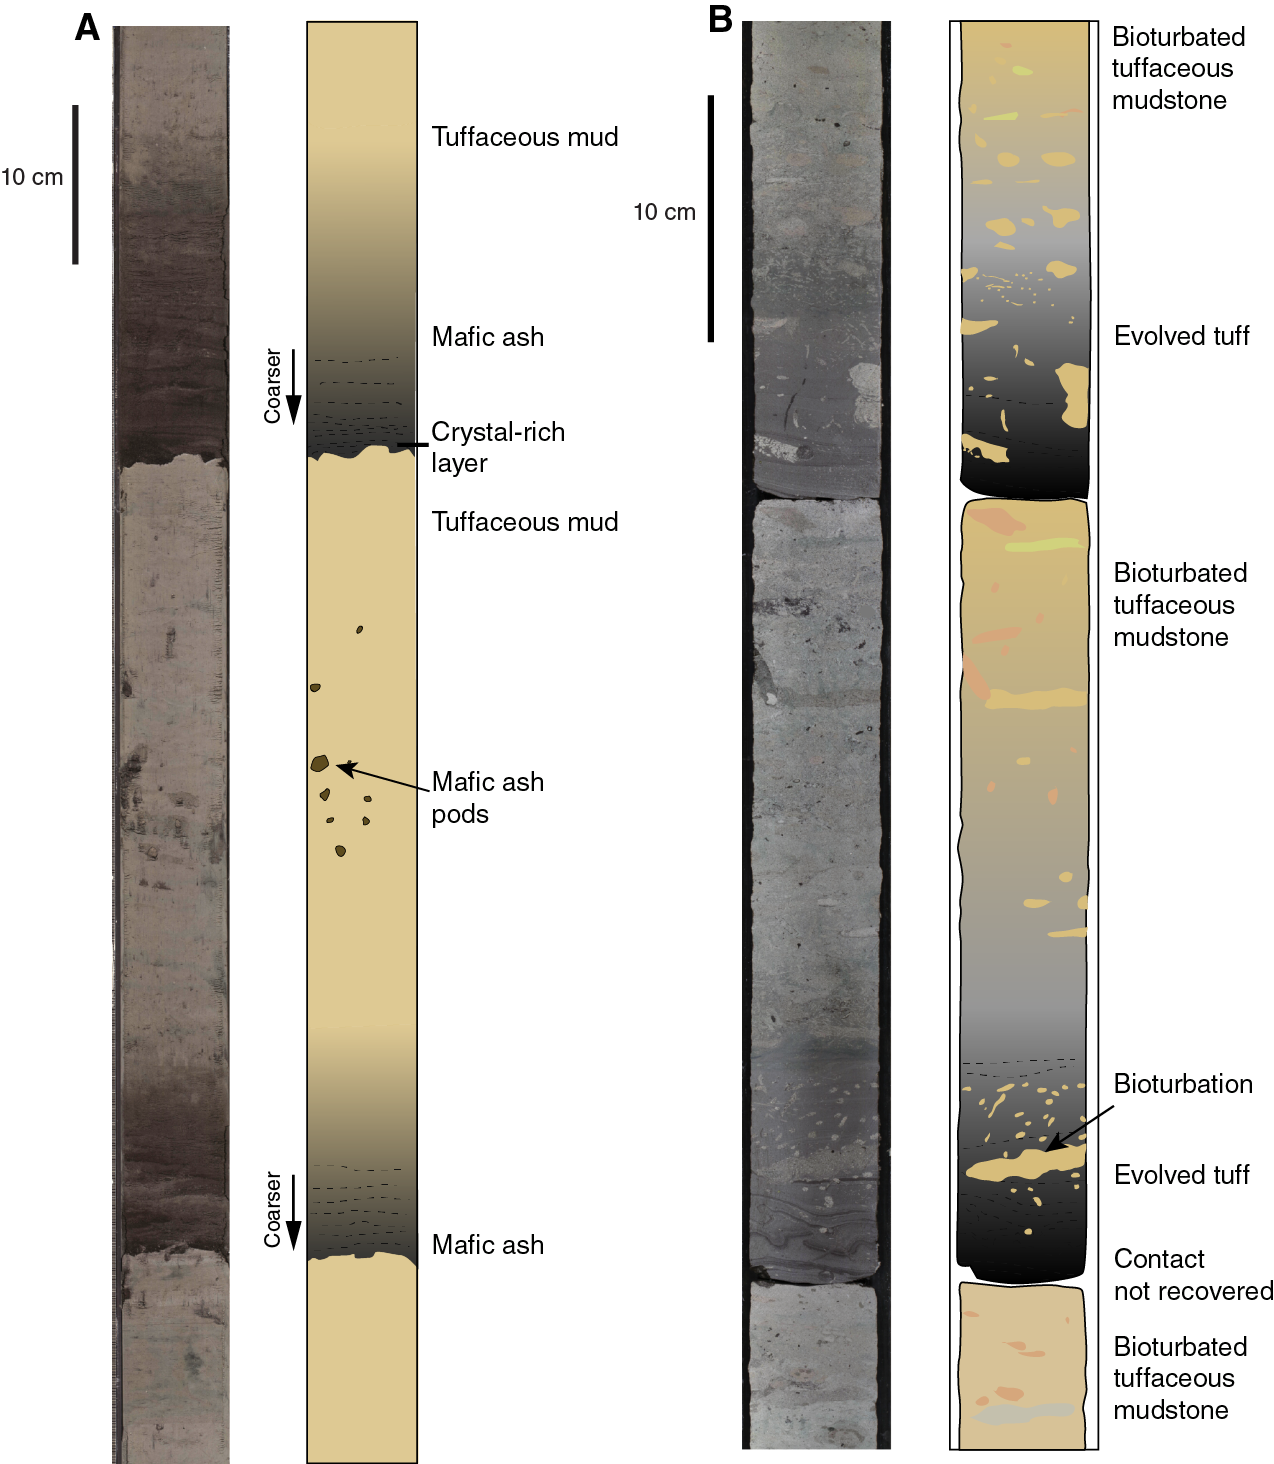
Figure F30. Unit I.
The fifth and final lithofacies includes 11 lapilli-ash/lapilli-tuff and lapillistone intervals with subrounded mafic scoria and/or evolved pumice and subordinate lithic clasts.
Unit I is divided into three physical properties (PP) units (1, 2, and 3, Figure F27A). PP Unit 1 (0–430 mbsf) is characterized by a downhole increase in bulk density (from 1.5 to 1.6 g/cm3) and P-wave velocity (from 1501 to 1848 m/s) and a corresponding downhole decrease in porosity (from 70 to 65 vol%). The top of PP Unit 2 (430–550 mbsf) is marked by an initial increase in porosity (from 61 to 67 vol%) then a downhole continuation of the decrease observed through PP Unit 2. The top of PP Unit 3 (550–682 mbsf) is characterized by a sharp increase in porosity (from 52 to 65 vol%) and a corresponding decrease in bulk density (from 1.8 to 1.6 g/cm3), followed by more normal downhole trends similar to those seen in PP Unit 2. The color reflectance ratio of a*/b* displays a significant decrease in the scatter of the data, indicating that color is less variable through PP Unit 3 than in PP Unit 2. The base of PP Unit 3 corresponds to the base of lithostratigraphic Unit I (Figure F27A).
Lithostratigraphic Unit II
Unit II (interval 350-U1437D-28R-2, 112 cm, to 32R-CC, 7 cm [682.12–726.50 mbsf]) is 44.38 m thick, with much more abundant volcaniclastics (~75%) and much less tuffaceous mudstone (~25%) than is present in Units I or III (Figures F28, F29). Additionally, the volcaniclastics in Unit II are coarser grained than those in adjacent Units I and III (Figure F28), with pumice lapilli-tuff and pumice lapillistone forming slightly more than half of the thickness and tuff forming slightly less than half. The volcaniclastics in Unit II also differ from those of Units I and III by being entirely evolved (no mafic volcaniclastics present; Figures F28, F29). The volcaniclastic intervals are planar bedded or cross bedded, are normally or reversely graded (Figure F31), and are on average 16 cm thick with a maximum of 95 cm.
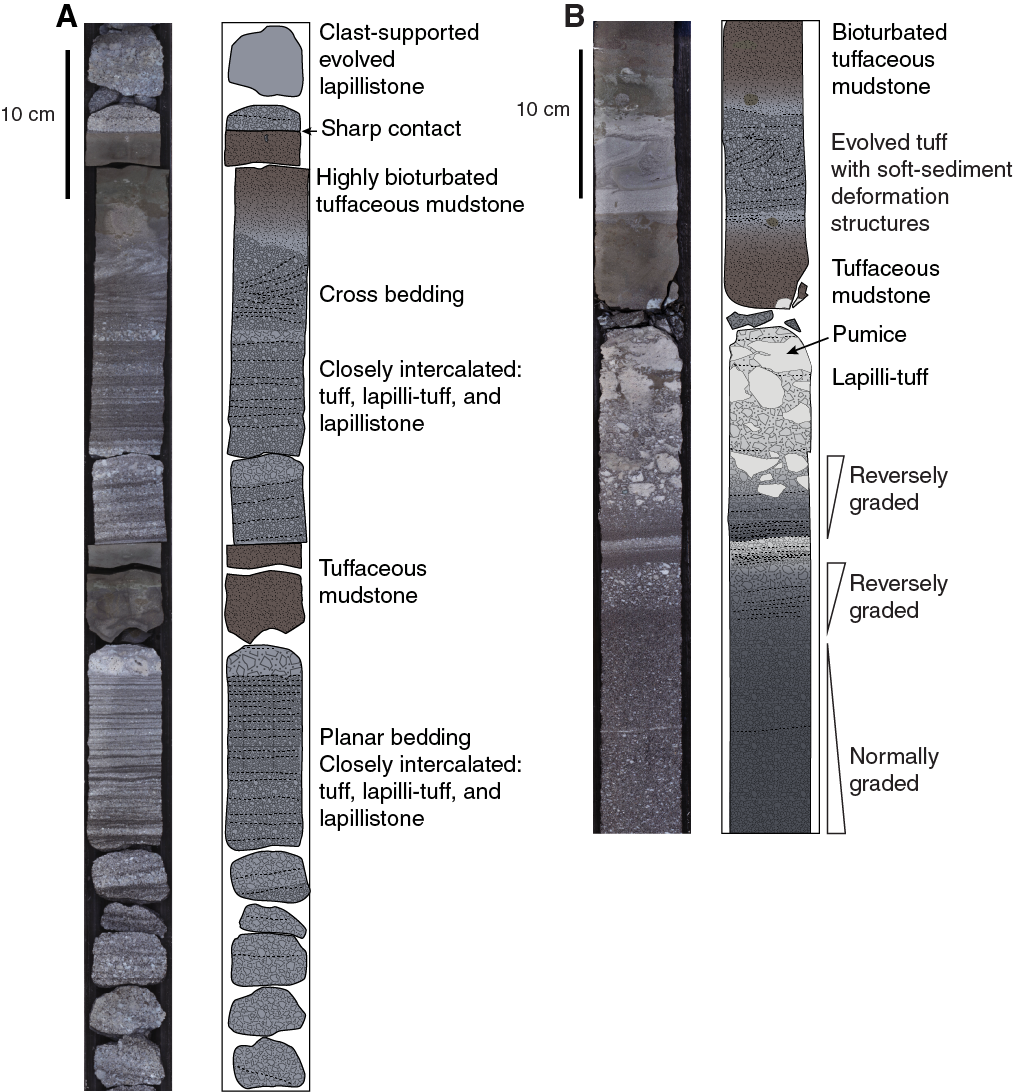
Figure F31. Unit II.
Unit II has three lithofacies types. The first lithofacies, evolved tuff, pumice lapilli-tuff, and pumice lapillistone is monomictic and contains plagioclase, clinopyroxene, orthopyroxene, and amphibole crystals in variable proportions. The second lithofacies, dark gray evolved tuff, is similar to the darker colored layers of evolved tuff in Unit I; it forms beds that are commonly graded, with a sharp base overlain by a crystal-rich layer that grades upward into a vitric tuff, commonly bioturbated where overlain by tuffaceous mudstone. The third lithofacies, tuffaceous mudstone, is similar to the tuffaceous mudstone of Unit I but is more strongly lithified and altered to green clay minerals (likely glauconite and smectite) plus pyrite. Pumice is commonly devitrified or replaced by palagonite, zeolites, or clay minerals.
PP Unit 4 (682–728 mbsf) corresponds to lithostratigraphic Unit II (Figure F27A) and is characterized by an increase in the scatter of density and porosity, a significant increase in P-wave velocity values and range, an abrupt increase in magnetic susceptibility (MS) (average of 476 IU versus 138 IU for PP Unit 3), and an abrupt decrease in mean NGR from ~20 to ~5 counts/s.
Lithostratigraphic Unit III
Unit III (interval 350-U1437D-32R-CC, 7 cm, to 63R-2, 26 cm [726.50–1017.88 mbsf]) is 291.38 m thick and is dominated by tuffaceous mudstone (~64%) and lesser tuff (~35%) (Figures F28, F29). Lapilli-tuff represents only ~1% of the unit (3.10 m in total). All intervals of tuff, and the rare lapilli-tuff, are compositionally evolved (Figure F29). Unit III also contains one distinctive interval (1.91 cm thick) that forms a separate lithofacies consisting of deformed tuffaceous mudstone intraclasts (up to ~20 cm in size) and clasts of scoria and pumice (up to 5 cm), supported in a deformed tuffaceous mudstone matrix; this is interpreted to represent a disaggregated slump or submarine debris flow deposit. Unit III shows an increase in fine-grained tuff (relative to tuffaceous mudstone) in its basal ~80 m (Figure F29); above that, Unit III is similar to Unit I, except that it lacks the mafic tuff that makes up ~20% of the tuff in Unit I.
The tuffaceous mudstone intervals in Unit III have abundant bioturbation (Figure F32) and, in the lower part of the core, dark laminae that may reflect higher clay content. The evolved tuff intervals generally have sharp basal contacts, some with a crystal-rich basal layer, and bioturbated tops that grade into tuffaceous mudstone. The evolved tuff is composed of glass and pumice or fiamme grains and crystals, including feldspar, clinopyroxene, orthopyroxene, and occasional hornblende.

Figure F32. Unit III.
Two main subfacies are recognized in the evolved tuff lithofacies of Unit III (Figure F32):
- Dark gray evolved tuff, which is medium-grained to coarse-grained, and owes its dark color to the presence of crystals and pumice (Figure F32A–F32D). It is identical to the dark gray tuff of Units I and II and not described further here.
- Intercalated white to gray-green evolved tuff, which is much finer grained and better sorted than other evolved tuff intervals at Site U1437, in places appearing chert-like (Figure F32E). The fine-grained tuff has laminations produced by alternation of glass shard–rich layers (white) and layers of mixed shards, pumice, and crystal fragments (gray-green), repeated over intervals up to several meters thick, with no bioturbation or tuffaceous mudstone interbeds. Thus, the intervals seem to record fairly continuous but pulsating sedimentation. The laminations commonly show soft-sediment deformation, supporting the interpretation that the intervals were deposited rapidly (see below). Intercalated white to gray-green evolved tuff intervals form much of the volcaniclastics in the lower part of Unit III, where the volcaniclastic content is highest for this unit (except for its uppermost part; Figure F29A). Similar intervals also occur in Unit IV (described below).
Unit III is divided into three physical properties units (PP Units 5, 6 and 7) (Figure F27A). The top of lithostratigraphic Unit III corresponds to the upper boundary of PP Unit 5 (728–794 mbsf), defined by an increase in NGR values to ~16 counts/s and a decrease in the scatter of P-wave velocity, followed downhole by the continuation of the P-wave trend observed in PP Unit 3. The top of PP Unit 6 (794–846 mbsf) is defined by an increase in the scatter of the P-wave velocity and color reflectance (a*/b*) values. The top of PP Unit 7 (846–1018 mbsf) is marked by an initial ~0.3 g/cm3 decrease in bulk density and a corresponding increase in porosity (846 to ~860 mbsf), followed by regular trends downhole and marked by significant scatter. The top of PP Unit 7 is also characterized by an abrupt decrease in the average MS value from 491 IU (PP Unit 6) to 167 IU. The base of PP Unit 7 coincides with boundaries between lithostratigraphic Units III and IV, described below.
Lithostratigraphic Unit IV
Lithostratigraphic Unit IV (interval 350-U1437D-64R-1, 8 cm, to 350-U1437E-6R-3, 122 cm; 1017.88–1120.11 mbsf) is 102.23 m thick (Figures F28, F29). Unit IV consists of coarse-grained tuff and polymictic lapilli-tuff and lapillistone (78%), with minor tuffaceous mudstone (22%) becoming more frequent toward the base. It contrasts with the tuffaceous mudstone–dominated Units III and V.
Unit IV consists of four lithofacies, summarized in order of abundance:
- Normally graded polymictic lapilli-tuff and lapillistone. Lapilli are small (average 3–5 mm, up to 1.5 cm). Lithic clasts dominate over vitric (mainly pumice) clasts, and lithic clasts are light to dark in color, but nearly all are plagioclase-pyroxene andesites; hornblende is rare.
- Intercalated white to gray-green evolved tuff. This is identical to the intercalated white to gray-green evolved tuff described under Unit III (above), characterized by laminae of very fine grained vitric tuff (white) alternating with fine- to medium-grained pumice and crystal tuff (gray-green). Similarly, it forms thick, unbioturbated intervals up to 5.54 m thick with planar lamination or soft-sediment deformation. The glass shards are too altered in thin section to allow determination of their original morphology.
- Dark gray evolved tuff. Also like those described under Units I, II, and III (above), this is a dominantly medium- to coarse-grained evolved tuff that owes its dark color to the presence of crystals (plagioclase with minor clinopyroxene) and pumice.
- Tuffaceous mudstone. This facies is similar to tuffaceous mudstone lithofacies described in Units I, II, and III.
The upper boundary of PP Unit 8 (1018–1140 mbsf) corresponds to the upper boundary of lithostratigraphic Unit IV. PP Unit 8 is characterized by an increase in the average MS value to 916 IU and a shift to very low (~1 W/[m·K]) thermal conductivity. Thermal conductivity increases again at the base of PP Unit 8 and lithostratigraphic Unit IV, coincident with the change from Hole U1437D to U1437E.
Lithostratigraphic Unit V
Lithostratigraphic Unit V (interval 350-U1437E-6R-3, 122 cm, to 28R-1, 0 cm [1120.11–1320.00 mbsf]) is 199.89 m thick and is distinguished largely on the basis of its intervals of monomictic reversely graded pumice lapilli-tuff with tuffaceous mudstone lithofacies (Figure F33A); these distinctive beds contrast with the polymictic, dominantly lithic lapilli-tuff of the overlying and underlying units (IV and VI). This lithofacies makes up 13% of Unit V and recurs throughout. Like Units I, III, and IV, Unit V also has lithofacies of tuffaceous mudstone (69%), evolved tuff (15%), and lapilli-tuff and lapillistone (3%), distinct from the monomictic reversely graded pumice lapilli-tuff with tuffaceous mudstone lithofacies.
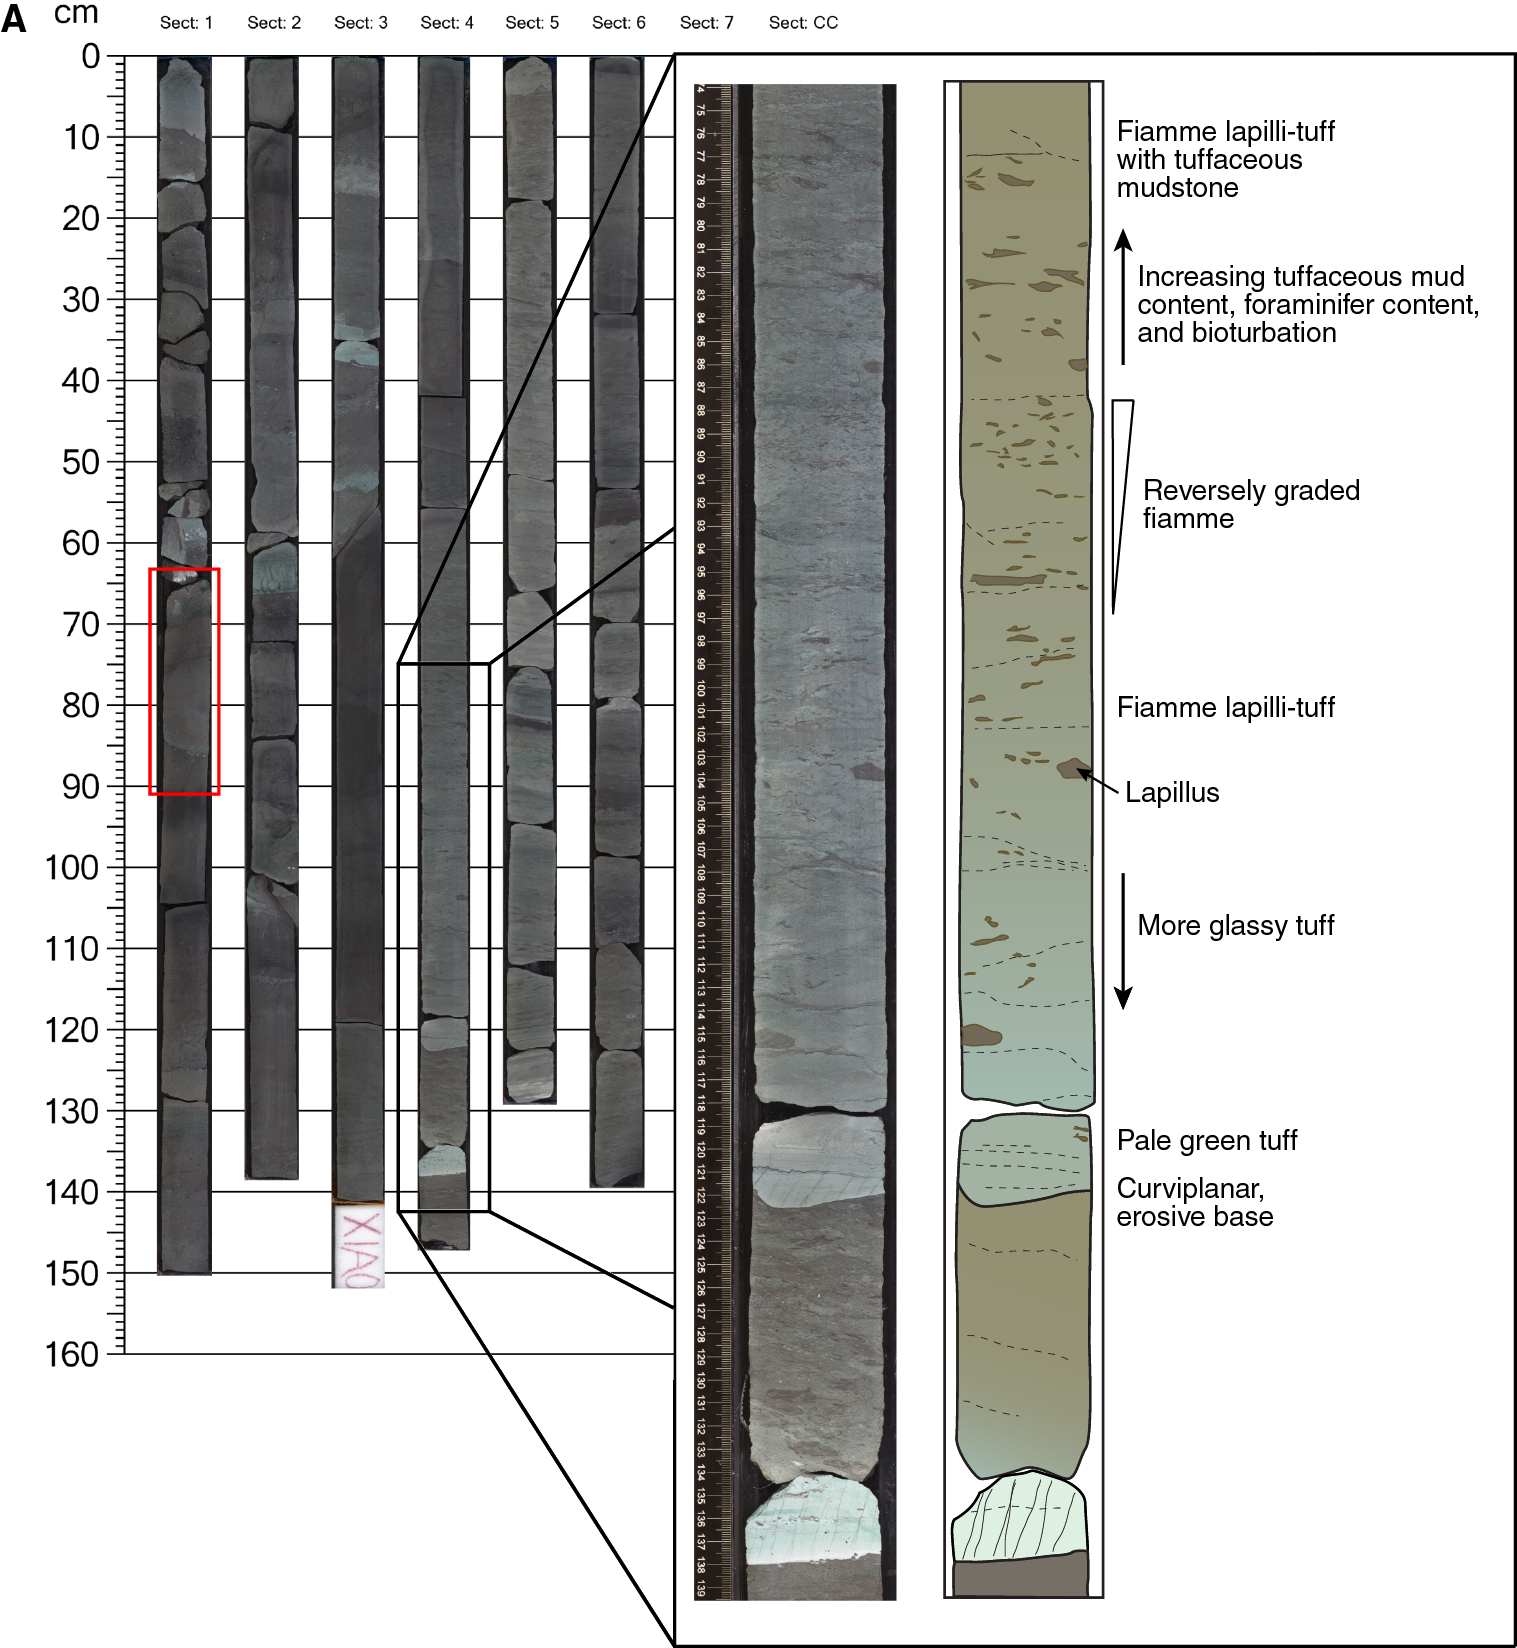
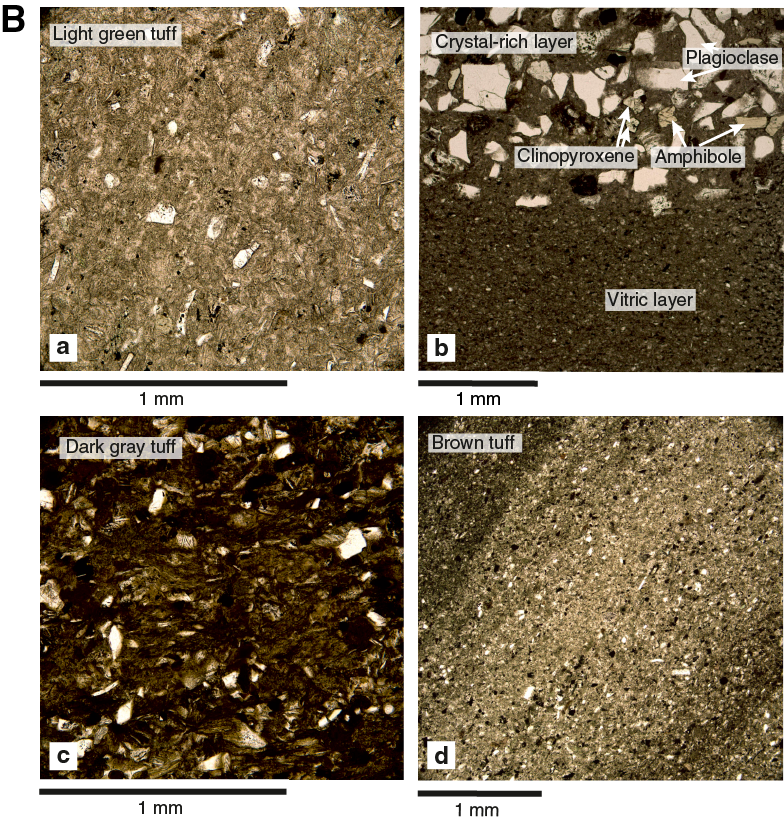
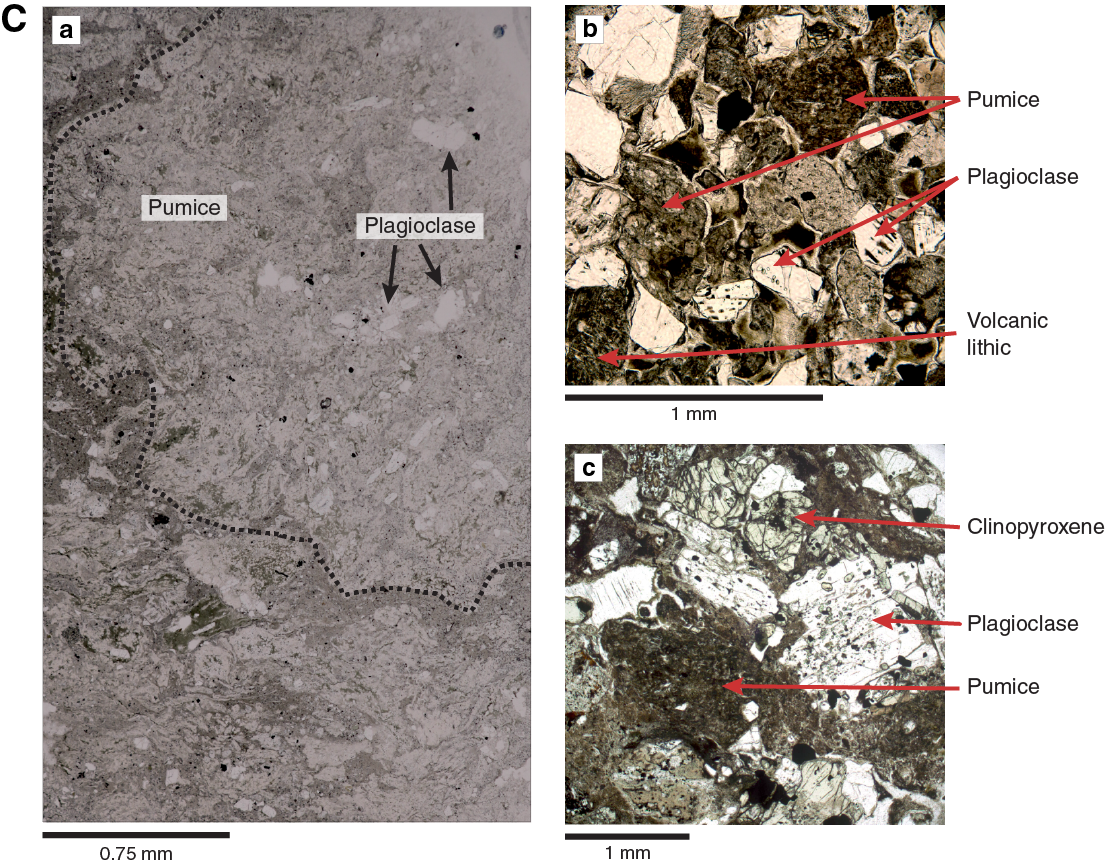

Figure F33. Unit V.
Each monomictic reversely graded pumice lapilli-tuff with tuffaceous mudstone interval in Unit V has (Figure F33A) (1) a sharp base, typically eroded into the underlying tuffaceous mudstone, overlain by (2) evolved tuff with abundant glass shards and grains of pumice, in turn grading upward into (3) pumice lapilli-tuff with flattened or unflattened pumice that become progressively coarser upward (i.e., reversely graded); this passes upward into (4) tuffaceous mudstone. This lithofacies is thus composed almost entirely of vitric material (glass shards and pumice).
The tuff in Unit V varies in color from light green to dark gray to brown and has variable vitric-crystal contents (Figure F33B). The lapilli-tuff in Unit V has volcanic lithic lapilli and pumice with crystals of plagioclase, pyroxene, and opaque minerals (Figure F33C). Soft-sediment faults are present in tuffaceous mudstone and tuff, with small offsets of 1–10 cm (Figure F33D).
The upper boundary of PP Unit 9 (1140–1315 mbsf) is 20 m below the upper boundary of lithostratigraphic Unit V (Figure F27B) and is defined by a decreased scatter in density, porosity, P-wave velocity, and NGR counts, as well as a downhole decrease in the thermal conductivity.
Lithostratigraphic Unit VI
Lithostratigraphic Unit VI (interval 350-U1437E-28R-1, 0 cm, to 42R-3, 60 cm; 1320.00–1459.80 mbsf) is 139.80 m thick and is characterized by an abundance of polymictic lapilli-tuff with pumice and lithic clasts, although it also contains monomictic pumice lapilli-tuff (Figure F34). The top of lithostratigraphic Unit VI is marked by the first appearance of multiple intervals of polymictic lapilli-tuff, and its base is marked by the top of the very distinctive black monomictic glassy lapillistone and lapilli-tuff in the upper part of Unit VII. Unit VI is dominated by the lapilli-tuff and lapillistone lithofacies (~57%) with lesser tuff (32%) and minor tuffaceous mudstone (11%) lithofacies. The polymictic lapilli-tuff and lapillistone form very thick beds (>1.5 m, the length of a core section, or up to 2.8 m thick assuming complete recovery between core sections). Tuff averages 0.24 m in thickness, with a maximum of 1.43 m. Tuff and tuffaceous mudstone intervals are interbedded.
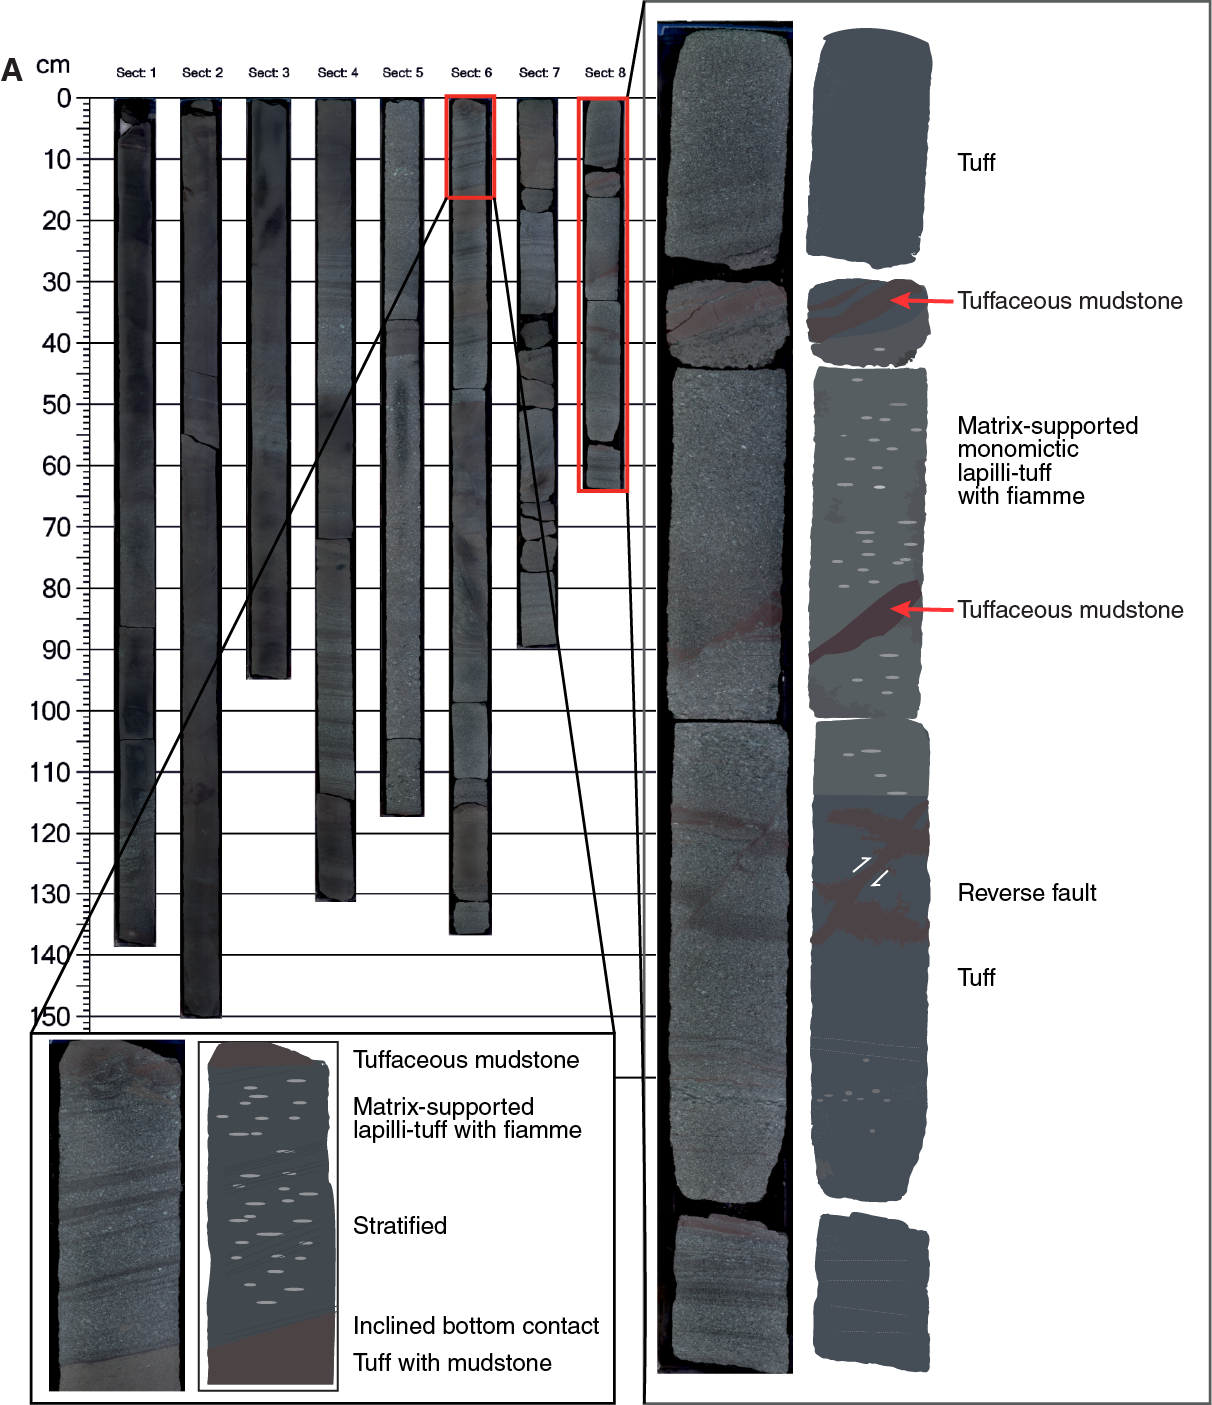
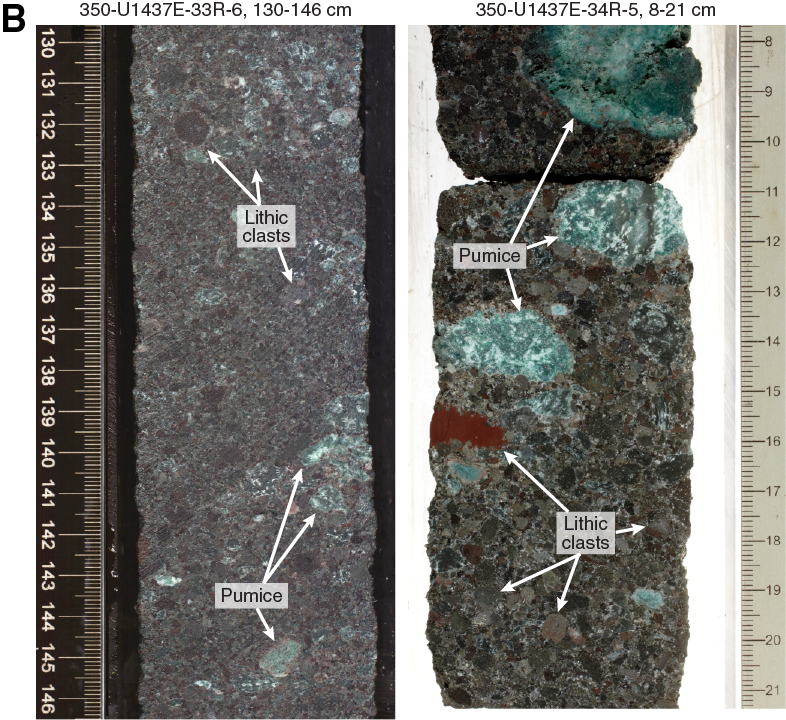
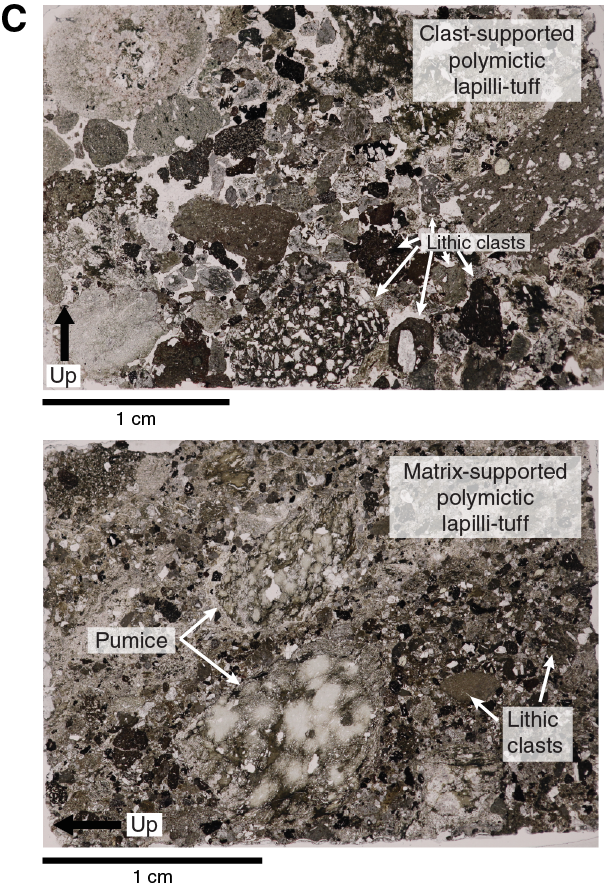
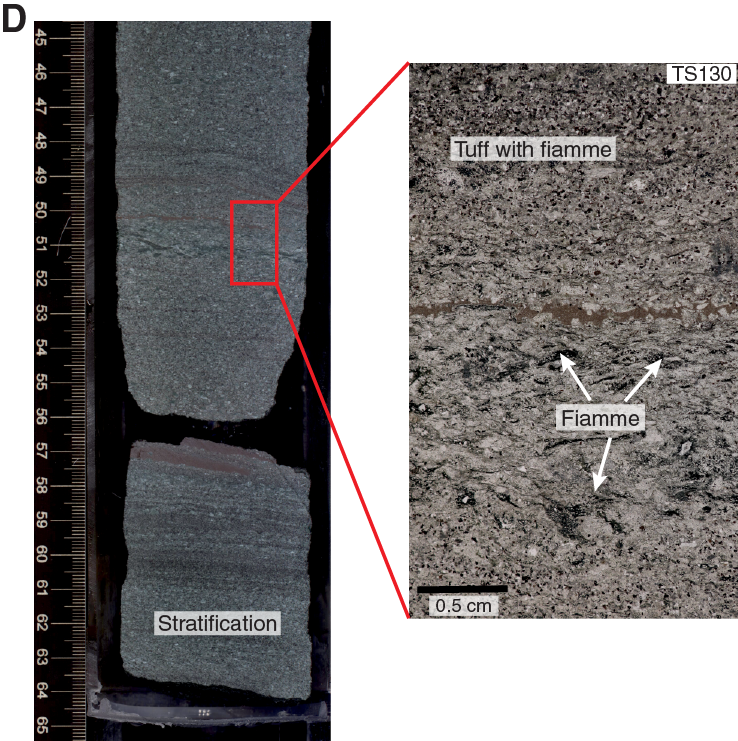
Figure F34. Unit VI.
Polymictic lapilli-tuff with pumice and lithic clasts is four times more abundant than monomictic pumice lapilli-tuff in Unit VI; monomictic varieties contain only pumice (Figure F34A), whereas polymictic varieties have evolved and lesser mafic volcanic lithic clast types as well as pumice clasts (Figure F34B). The polymictic lapilli-tuff with lithic clasts and pumice shows a complete gradation from clast-supported to matrix-supported (Figure F34C), whereas the monomictic pumice lapilli-tuff is entirely matrix-supported (Figure F34A).
Lithic lapilli in Unit VI are dominantly
- Porphyritic andesite with plagioclase and clinopyroxene. These range from nonvesicular to highly vesicular (up to ~50% vesicles), locally filled with zeolites, clay minerals, and/or chalcedony. Clasts of this type also occur as scattered small blocks (>6.4 cm in size) in the polymictic lapilli-tuff.
- Rhyolite-dacite, which becomes more common near the rhyolite intrusive sheet with peperitic boundaries, described as igneous Unit 1 below. These include crystal poor and porphyritic varieties, with amphibole, plagioclase, and quartz.
Pumice lapilli clasts in Unit VI are light to dark green and commonly flattened by compaction and lithification into fiamme (Figure F34B, F34D); less flattened pumice clasts have vesicles filled with chlorite. Red to brown tuffaceous mudstone clasts are also present in Unit VI.
Unit VI corresponds to PP Unit 10 (Figure F27B). Physical properties changes are gradational from the base of PP Unit 9 (lithostratigraphic Unit V) into PP Unit 10. NGR declines from ~10–12 counts/s at the base of Unit V to a sustained ~5–6 counts/s in Unit VI. MS increases into Unit VI and becomes less variable as compared with Unit V. Porosity and P-wave velocity show no appreciable change from Units V to VI.
Igneous Unit 1
The only igneous unit observed at Site U1437 (Figure F28C) consists of a single rhyolite intrusion (interval 350-U1437E-35R-1, 76 cm, to 35R-2, 55 cm, [1388.86–1390.07 mbsf]), which lies within lithostratigraphic Unit VI (Figure F35). Core recovery is much lower in igneous Unit 1 (~45%) than its host volcaniclastic rock (~94%), and the recovered igneous Unit 1 core material is fractured by core disturbance, probably due to greater competency of the rhyolite intrusion compared to the surrounding volcaniclastic host. Therefore, although only 1.21 m thickness was described for igneous Unit 1, its maximum thickness is estimated at 6.50 m assuming all the material not recovered from this interval was part of igneous Unit 1. Its true thickness probably lies somewhere between 1.21 and 6.50 m.

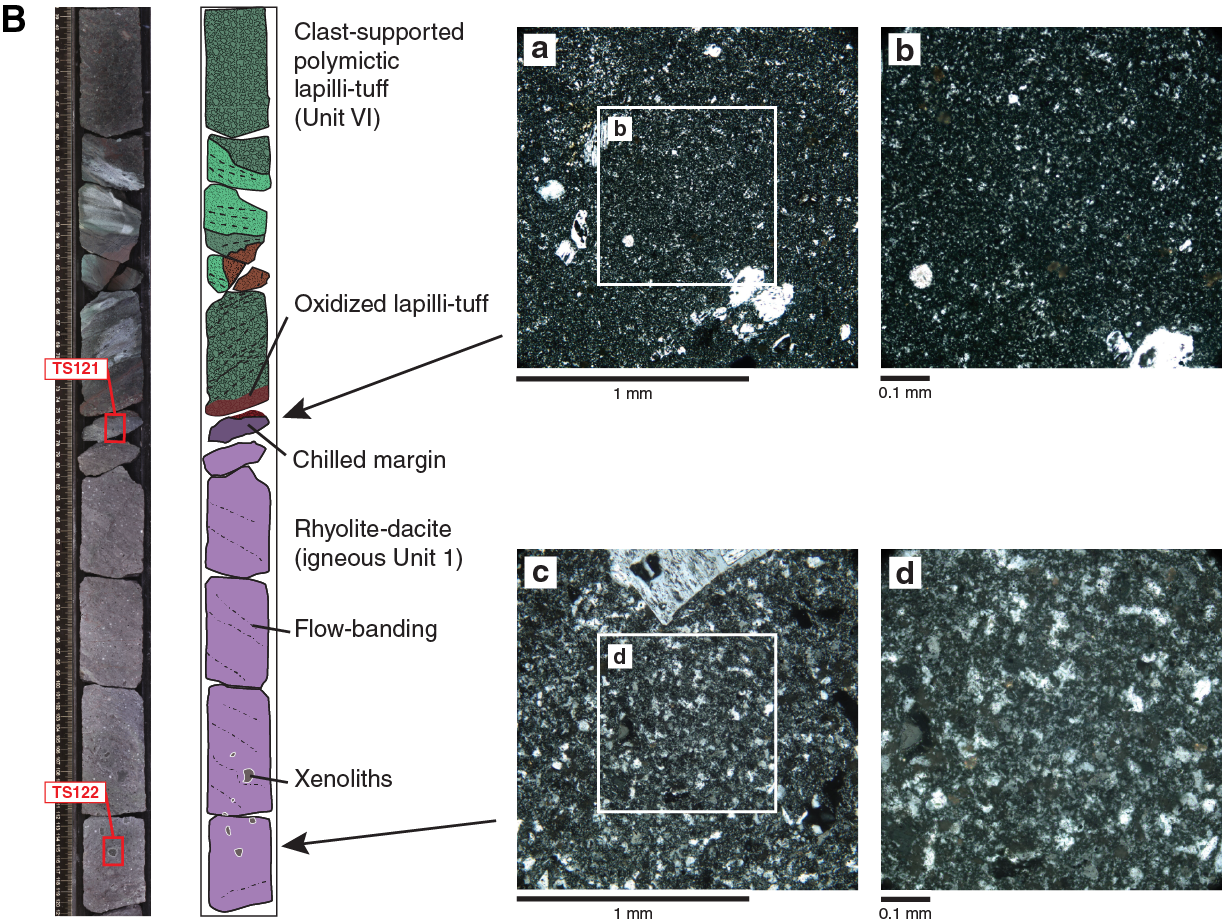
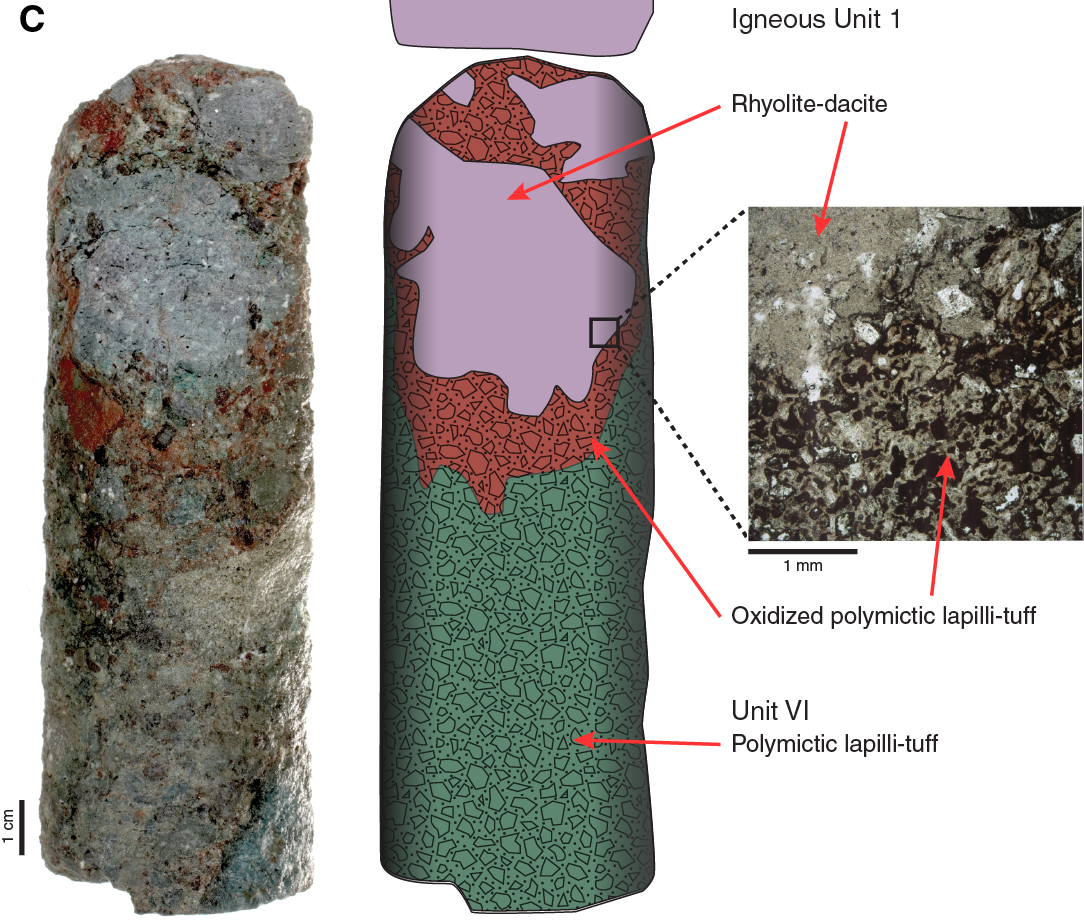
Figure F35. Igneous Unit 1.
Igneous Unit 1 was described by the general term rhyolite-dacite, but shipboard geochemical analysis (discussed below) shows that it is a rhyolite with 74.5% SiO2. It has sieve-textured subhedral plagioclase (up to 4 mm, ~7%), euhedral hornblende (up to 0.5 mm, ~3%), large anhedral to subhedral quartz (up to 8 mm, ~1%) with fresh glassy melt inclusions, some opaque minerals, and rare zircon (<30 µm in size). Flow banding is observed across the entire unit in various orientations (Figure F35B). The groundmass varies from cryptocrystalline near the upper and lower contacts to fine grained in the center of the unit. The upper margin is chilled, and the overlying lapilli-tuff is baked, indicating that igneous Unit 1 is an intrusion rather than a clast or lava. The lower contact of igneous Unit 1 is peperitic, defined as a magma-wet sediment mixture (Busby-Spera and White, 1987); the contact shows complex mingling between the intrusion and the host, including crenulated lobate margins on the intrusion and dispersal of the magma into the host on the microscopic scale (Figure F35C). Paleomagnetic data on igneous Unit 1 show a consistent, single component demagnetization and normal polarity with appropriate inclination of the characteristic remanent magnetization, supporting the interpretation that igneous Unit 1 is an intrusion, rather than simply a large clast.
Lithostratigraphic Unit VII
Unit VII occurs from 1459.80 to 1806.5 mbsf (interval 350-U1437E-42R-3, 60 cm, to 79R-3, 83 cm), the bottom of Hole U1437E (Figures F28C, F29C). The unit is 346.70 m thick, and ~90% is extremely thick bedded, nongraded, nonstratified, poorly sorted, coarse-grained angular andesitic lapilli-tuff, in places with blocks tens of centimeters in size. Some of these blocks have quenched margins, jigsaw-fit textures, intricate fluidal margins, or peperitic margins, as described in more detail below. These features indicate that the blocks were emplaced hot, and thus the blocks could have originated as hot clasts, lava, and/or intrusions. Thus Unit VII is interpreted to be a near-vent deposit. Unit VII is divided into upper and lower parts (shallower and deeper than 1643.73 mbsf).
The upper part (183.93 m thick) of Unit VII is dominated by a lithofacies of black glassy homogeneous nonstratified lapillistone and lapilli-tuff, with unaltered angular clasts and abundant large clinopyroxene glomerocrysts and plagioclase glomerocrysts. The glass is isotropic and nonvesicular, and bubble-wall shards or broken crystals are absent (Figure F36A, F36B). Only a few sparsely phyric volcanic lithic clasts are present, some with quenched margins, and a few red oxidized clasts also occur. The black glassy lapillistone and lapilli-tuff lithofacies lacks stratification completely, except for one thin (~25 cm thick) interval of crudely stratified ash. The black glassy lapillistone and lapilli-tuff lithofacies is interpreted to be hyaloclastite formed by autobrecciation and quenching of lava in a submarine environment (discussed further below).
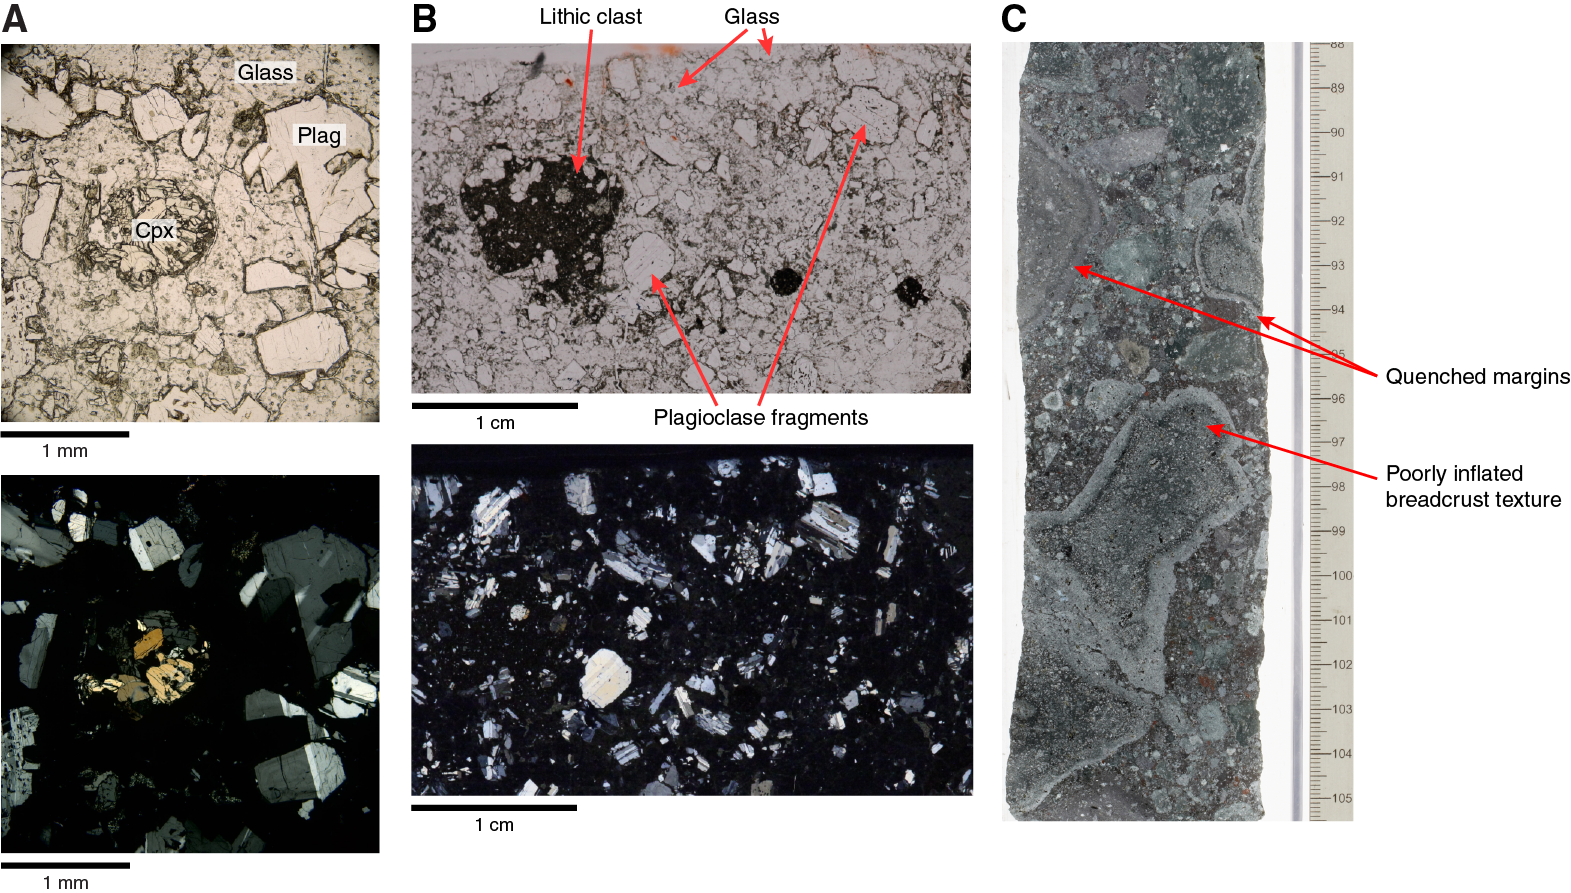
Figure F36. Glassy deposit, Unit VII.
The lower part (156.57 m thick) of Unit VII is dominated by a lithofacies of green (more altered) angular andesite lithic lapilli-tuff with blocks up to 53 cm in size. Like the black glassy lapillistone and lapilli-tuff unit that forms the upper part of lithostratigraphic Unit VII, these lithic lapilli-tuff and tuff-breccia intervals are massive, but they are intercalated with stratified lithic lapilli-tuff and tuff (also altered green). The andesite lithic clasts are also more heterogeneous, with variable plagioclase and pyroxene contents, and they range from nonvesicular to moderately vesicular, with vesicles mostly filled with secondary minerals. Some of the clasts show evidence for hot emplacement (Figure F36C), including intricate fluidal margins, quenched margins and breadcrust texture, jigsaw-fit brecciated margins, and in at least one case, a clast appears to be surrounded by sediment with a baked margin. Additionally, clasts with broken chilled margins are absent; these would be expected if the clasts were transported and deposited after they cooled. On the basis of the core, it is not possible to determine whether all of these features formed on hot clasts or if some of these features formed on the complexly embayed margins of small intrusive bodies or lava. Further support of hot emplacement is provided by paleomagnetic inclinations from two of the clasts, represented by Samples 350-U1437E-66R-5, 106–108 cm, and 66R-6, 16–18 cm. Despite multidomain overprinting, the demagnetization analyses of these two individual clasts could resolve the characteristic reversed polarity expected for hot emplacement.
The green lower part of Unit VII also contains minor intervals of tuff lithofacies, averaging ~20 cm thick and variable in color (brown, dark gray, red-brown, and green). These thin tuff intervals are stratified or massive, nongraded or normally graded (with rare reverse grading), and commonly contain minor lapilli.
Unit VII corresponds to PP Units 11, 12, and 13 (Figure F27B). PP Unit 11 (1460–1580 mbsf) is characterized by an abrupt decrease in MS values and a decreased scatter in density, porosity, and P-wave velocity values. NGR counts from the upper part of PP Unit 11 are higher than in PP Unit 10 and then decrease again in the lower part of PP Unit 11. The upper boundary of PP Unit 12 (1580–1742 mbsf) is defined by an abrupt increase in MS relative to PP Unit 11. Density and P-wave velocity increase downhole, whereas porosity decreases. The top of PP Unit 13 (1742–1800.3 mbsf) is marked by a decrease in P-wave velocity and thermal conductivity, which then increase downhole toward the bottom of the hole.
Rock magnetism
Rock magnetic measurements at Site U1437 comprised saturation isothermal remanent magnetization (SIRM) acquisition, backfield demagnetization of SIRM by a 300 mT field to yield the S−0.3T ratio, stepwise acquisition of partial anhysteretic remanent magnetization (pARM), thermal demagnetization analysis, and anisotropy of magnetic susceptibility (AMS).
Through Holes U1437B and U1437D, a number of significant features in the downhole distribution of rock magnetic properties correlated with features of the physical properties, pore fluid geochemistry, and hydrocarbon geochemistry records (discussed further below). Overall, the rock magnetic properties show a downhole trend suggesting that after initial biologically mediated reduction in the sulfate reduction zone to produce greigite, the proportion of greigite gradually decreased, presumably though slow completion of the iron sulfide reduction chain to convert this ferrimagnetic sulfide to paramagnetic pyrite. Superimposed on this trend is a break at ~400 mbsf, where SIRM/k, S−0.3T , and magnetic foliation all show discontinuities. This represents a sudden downhole increase in the proportion of magnetic sulfides, followed by gradual returns to trend over the 300 m below. The return to trend in SIRM and S−0.3T occurs in the lower part of lithostratigraphic Unit I and appears to be complete by the Unit I/II boundary at ~680 mbsf, corresponding also to the top of PP Unit 4 (Figure F37). After initial sulfate reduction, sulfate recovers over a diffusion zone extending to ~275 mbsf, where there appears to be a fluid source (see Pore fluid analysis) and plateaus from there to ~400 mbsf; over this interval S−0.3T values drop to below 0.97, suggesting renewed and enhanced production of greigite. Deeper than ~400 mbsf, sulfate increases again downhole to near-seawater concentrations at ~460 mbsf, corresponding to the highest value of SIRM/k in all samples measured at Site U1437, and remains high to the deepest IW sample taken at 700 mbsf. Greigite concentration inferred from the rock magnetic parameters decreases downhole deeper than 460 mbsf, returning to the background trend at ~680 mbsf, corresponding to the Unit I/II boundary and the top of PP Unit 4. A second source of fluid at ~460 mbsf appears to be driving both sulfate enrichment and greigite genesis.
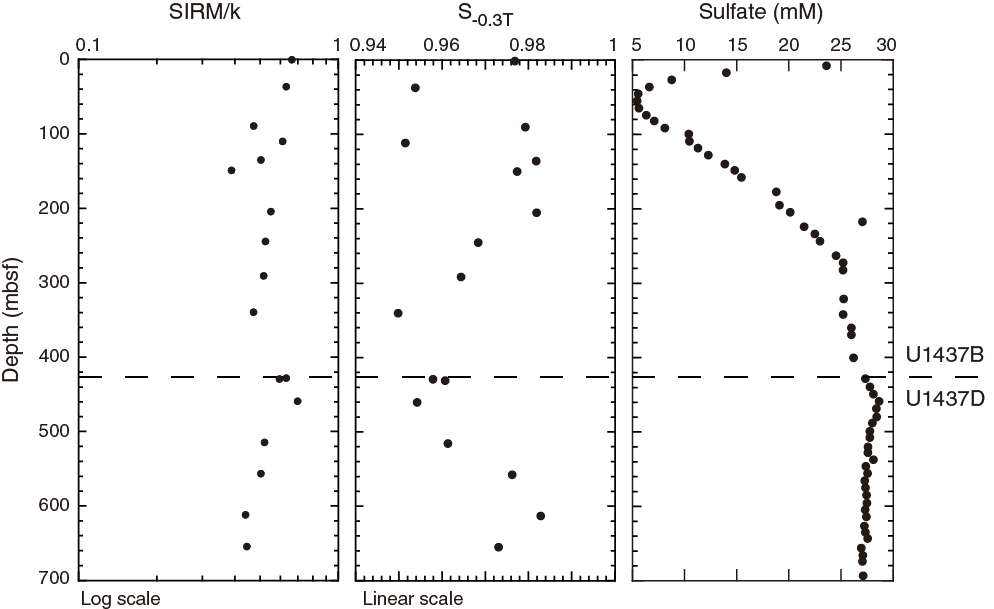
Figure F37. Rock-magnetic indexes SIRM/k and S−0.3T.
Surprisingly, given the apparent continuity of broadly similar lithologies through lithostratigraphic Units I–V across Holes U1437B, U1437D, and U1437E, rock magnetic properties in Hole U1437E do not follow the trends seen through Holes U1437B and U1437D. The background log-linear downhole decrease in SIRM/k that persists throughout Units I–IV is absent from Units V and VI. Instead, SIRM/k values appear to be randomly scattered over a wide range. Coercivity spectra from pARM analysis also show a wide range, from very magnetically soft (peak coercivity < 20 mT) to harder (broad coercivity peak from 20 to 30 mT) without any systematic downhole trends. Magnetite in samples from Hole U1437E appears to be dominated by large multidomain (MD) grains (presumably because of complete dissolution of finer magnetite grains), prompting the use of liquid nitrogen pretreatment to remove MD-carried overprints.
Geochemistry
Hydrocarbon gases
Samples for hydrocarbon gas analysis from headspace (n = 184) were collected and analyzed for every core at Site U1437 in compliance with the shipboard hydrocarbon safety program. Methane was the only hydrocarbon gas above detection limits in sediment headspace samples in Holes U1437B and U1437D. Methane abundances gradually increase with depth, with the highest abundances at ~750–1459 mbsf (Figure F38), and reach maximum values of 638 ppmv at 920 mbsf, which is still well below critical safety thresholds. The zone of methanogenesis is unusually deep because of a release of sulfate below the sulfate reduction zone (27–83 mbsf; see Pore fluid analysis and Rock magnetism), which may be buffering the methanogenesis by anaerobic methanogens. Deeper than 1459 mbsf, methane concentrations decrease again and are <10 ppmv in the lowermost sections of the cored sequence. Upon starting drilling in Hole U1437E, ethane was also detected with a maximum of 13 ppmv at 1275 mbsf. In the section where both methane (C1) and ethane (C2) were detected (1105–1450 mbsf), C1/C2 values are <100, possibly indicating the organic matter is mature and the hydrocarbon gases are thermogenic. However, C1/C2 never reached the critical threshold to cause drilling operations to be halted according to the shipboard safety program.
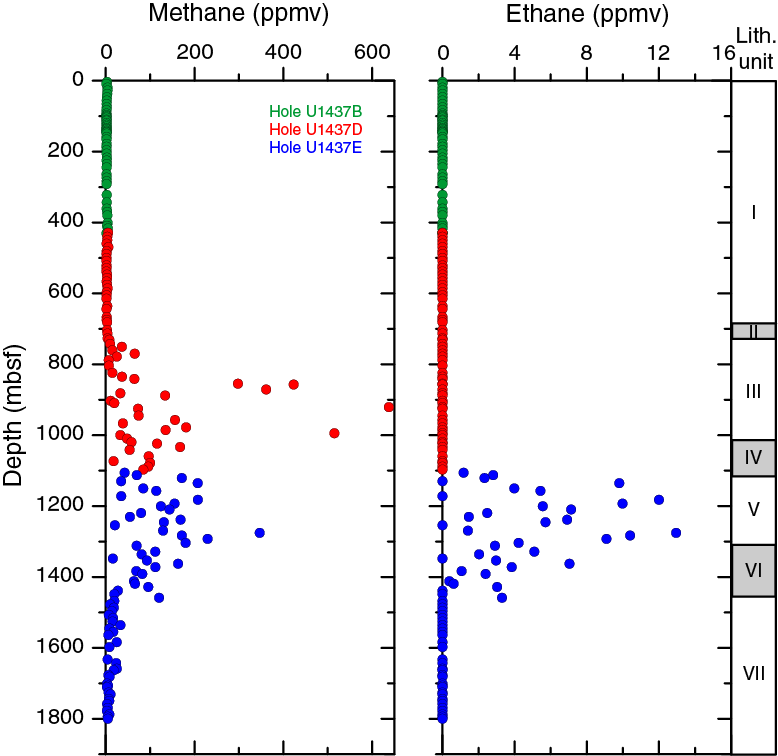
Figure F38. Headspace methane and ethane concentrations.
Pore fluid analysis
Interstitial water (IW) samples (n = 59) were squeezed from whole-round core sections between 5 and 10 cm long that targeted muddy intervals in cores between 8.3 and 693 mbsf. The interstitial water salinity and chloride profiles are characterized by moderate increases above seawater values with depth. The chloride profile is nearly constant in Hole U1437B between 18 and 401 mbsf. Bromide shows a gradual decrease with depth but in contrast to Hole U1436A is poorly correlated with chloride. Higher chloride with depth indicates hydration of volcanic ash and the formation of hydrous alteration products such as clay and zeolite. These reactions consume H2O and increase pore water salinity and chloride concentrations. Variations in Ca, Mg, and B abundances with depth are consistent with this interpretation.
Depth profiles for alkalinity, pH, ammonium, sulfate, and phosphate (Figure F39) are highly complementary and characterized by prominent deviations from seawater compositions over the uppermost 50 m of the profile, followed by a more gradual reversal to near seawater compositions at depth. The sharp decrease in sulfate between the surface (~24 mM) and ~50 m depth (~5 mM) is mirrored by an approximately equimolar increase in alkalinity, which is consistent with microbial sulfate reduction and the release of HCO3− into solution according to the simplified net reaction
2CH2O (organic matter) + SO42− = 2HCO3− + H2S.
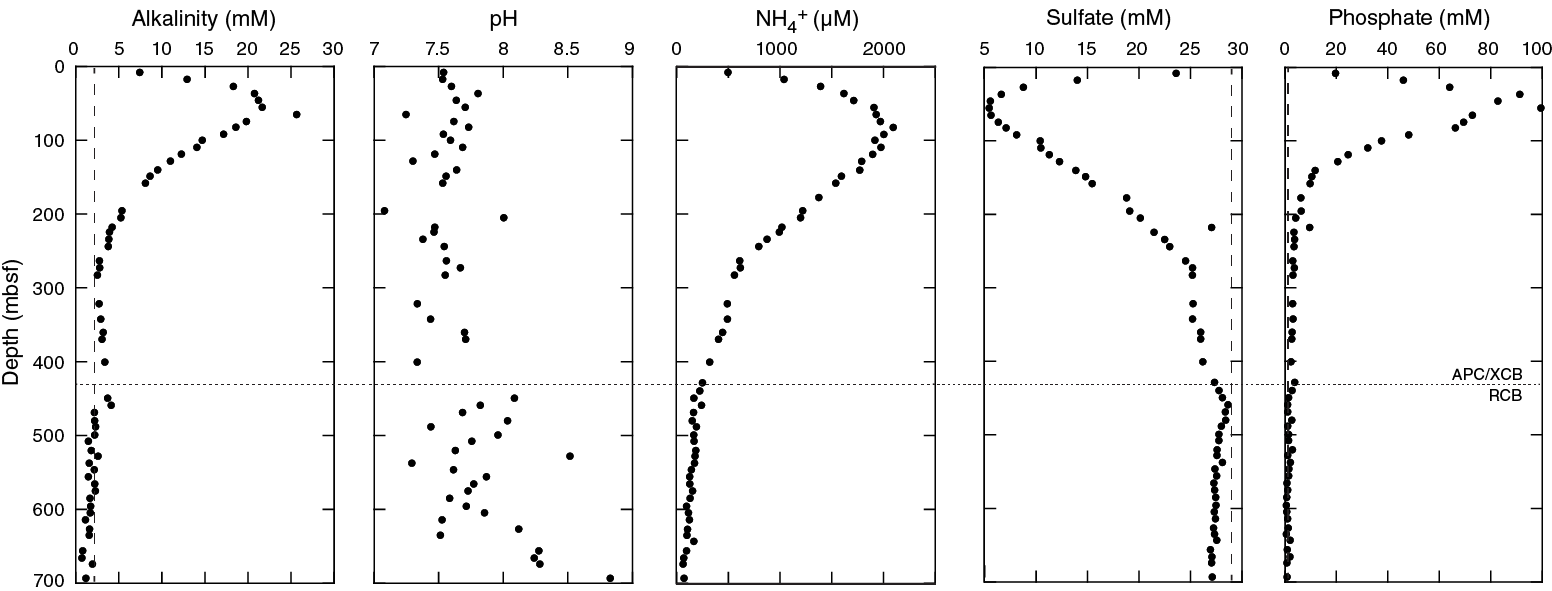
Figure F39. Pore water geochemical depth profiles.
Microbial activity could also be responsible for production of phosphate, which peaks at nearly 100 mM, or ~100× seawater abundance, at 55.5 mbsf, and ammonium, which peaks at 2094 µM at 82.5 mbsf.
The overall shape of the sulfate profile, strong depletion in a shallow region of microbially mediated sulfate reduction, and a gradual return to seawater compositions is peculiar but has been previously documented in several holes (ODP Leg 170 Site 1039 and Integrated Ocean Drilling Program Expeditions 334 and 344 Site U1381). In these cases it was attributed to the infiltration and upward diffusion of sulfate-rich fluids from below the zone of sulfate reduction (Expedition 334 Scientists, 2012; Harris et al., 2013). We hypothesize that this region of fluid influx coincides with a zone of poor core recovery, grain-size increase, and strong seismic attenuation at ~300 mbsf in Hole U1437B. This zone is also characterized by a broad peak in pore water Li that would be consistent with vertical diffusion from a zone of horizontal fluid infiltration (see below).
Variations in IW major elements (Na, Ca, and Mg) (Figure F40) are best evaluated by separating the trends observed over a shallow depth range (0–100 mbsf) attributed to biologic processes from those at greater depth (>100 mbsf), which are more strongly controlled by processes such as distal fluid migration and diagenesis. At ~450–500 mbsf, the trends for Na, Ca, and Mg show prominent breaks: Na and Ca increase more strongly with depth, with a Ca concentration versus depth gradient of 0.14 mM/m, and Mg strongly decreases at −0.11 mM/m to a minimum of 9.6 mM at 693 mbsf. Lithification increases at about the same depth producing dominantly tuffaceous mudstone from tuffaceous mud. Moreover, the abundance of mafic and evolved tuff increases deeper than ~450 mbsf, and therefore the increase in Ca with concomitant depletion in Mg is reasonably attributed to alteration of volcanic glass and the formation of smectite (e.g., Riedel et al., 2010).

Figure F40. Na, K, Ca, Mg, Li, and Si depth profiles.
Depth discontinuities of IW minor components (B, Ba, Fe, Li, Mn, Si, and Sr; Li and Si shown in Figure F40) often correlate with the changes described above. Boron depth variations mirror the hockey stick profile for pH by very gradually decreasing from near seawater compositions to ~600 mbsf followed by a sharp drop to the terminal depth of IW sampling at 693 mbsf. The correlation of this decrease with strong depletions of deep pore waters in Mg and concomitant increases in pH and Ca suggests absorption of B in clay formed from alteration of volcanic glass. Barium and Fe concentrations show little variability with depth and often scatter widely over small depth intervals.
Lithium displays a hump-shaped profile with a maximum (70 µM) between 283 and 343 mbsf (Figure F40) and declines deeper than 343 mbsf to a local minimum at 459 mbsf, coincident with the sulfate minimum (Figure F39). The main hump of the Li profile is consistent with the ingression of a high-Li fluid at this depth, which corresponds to a zone of poor core recovery that also matches a major seismic reflector at ~300 mbsf. This situation is similar to observations for Integrated Ocean Drilling Program Expedition 344 Site U1380, where a horizon of elevated Li concentrations correlated with a shear zone interpreted to act as a conduit for fluids with elevated source temperatures (Harris et al., 2013). The upward decrease in Li in the Site U1437 profile suggests progressive dilution, whereas the downward decrease indicates uptake of Li by clay minerals formed during alteration of volcanic glass.
The Mn depth profile mimics the hockey stick profile for chloride, except for an excursion to high Mn concentrations in the near-surface IW sample from Core 350-U1437D-2H (8.4 mbsf). Dissolved Si parallels the hump-shaped Li depth profile.
At shallow depth, the progressive dissolution of diatoms could be responsible for Si increases, whereas transformation of biogenic opal-A to opal-CT could act as a sink for Si (Figure F40) (Littke et al., 1991). The peak in IW Si (~1250 µM) qualitatively agrees with the decline in diatom preservation with depth (they are last observed in Core 350-U1437D-6R at 471 mbsf), and the decrease of Si below the putative opal-A to opal-CT transition zone correlates with accelerated B uptake (Brumsack and Zuleger, 1992). Furthermore, downhole logging data indicate a temperature of ~50°C at the transition; coupled with an age of ~3.5 Ma, these conditions appear optimal for forming opal-CT (Hein et al., 1979). Alternatively, the Si maximum at intermediate depth could also be attributed to fluid influx, analogous to Li. Strontium defines a complex downhole profile, displaying a minimum of 52 µM at 37 mbsf, consistent with the zone of sulfate reduction and CaCO3 precipitation, which shows a broad maximum at this depth. Although Sr concentrations are depleted at shallow depth, the Sr/Ca ratio peaks at ~45 µM/mM at ~100 mbsf. This is consistent with diagenetic carbonate recrystallization, which releases Sr into the pore waters (Baker et al., 1982). Coincidentally, the depth interval with near-seawater Sr/Ca at ~370 mbsf corresponds to the Li maximum and might indicate the influx of modified seawater along fast pathways.
Tuffaceous mud/mudstone bulk geochemistry
A total of 229 sediment samples were collected at Site U1437 and analyzed for concentrations of CaCO3, total carbon (TC), total organic carbon (TOC), and total nitrogen (TN) (Figure F41) using coulometry and elemental analyses, respectively. The atomic ratios of TOC and TN (TOC/TNat) were calculated to determine the source of the sedimentary organic matter. TC contents are highly variable over the whole cored sequence and range between 0.26 wt% at 17 mbsf and 6.89 wt% at 913 mbsf with an average value of 3.2 wt%. CaCO3 shows a highly variable profile with average concentrations of 21.9 wt%. Minimum (0.46 wt%) and maximum (57.1 wt%) CaCO3 concentrations occur at the same depths as minimum and maximum TC values, respectively. Plotting the 5-point average values of CaCO3 contents reveals two intervals with comparatively high CaCO3 contents in the uppermost ~170 m of the cored sequence. Another interval with elevated CaCO3 contents is observed at ~900 mbsf. Thereafter, CaCO3 contents gradually decrease with depth.
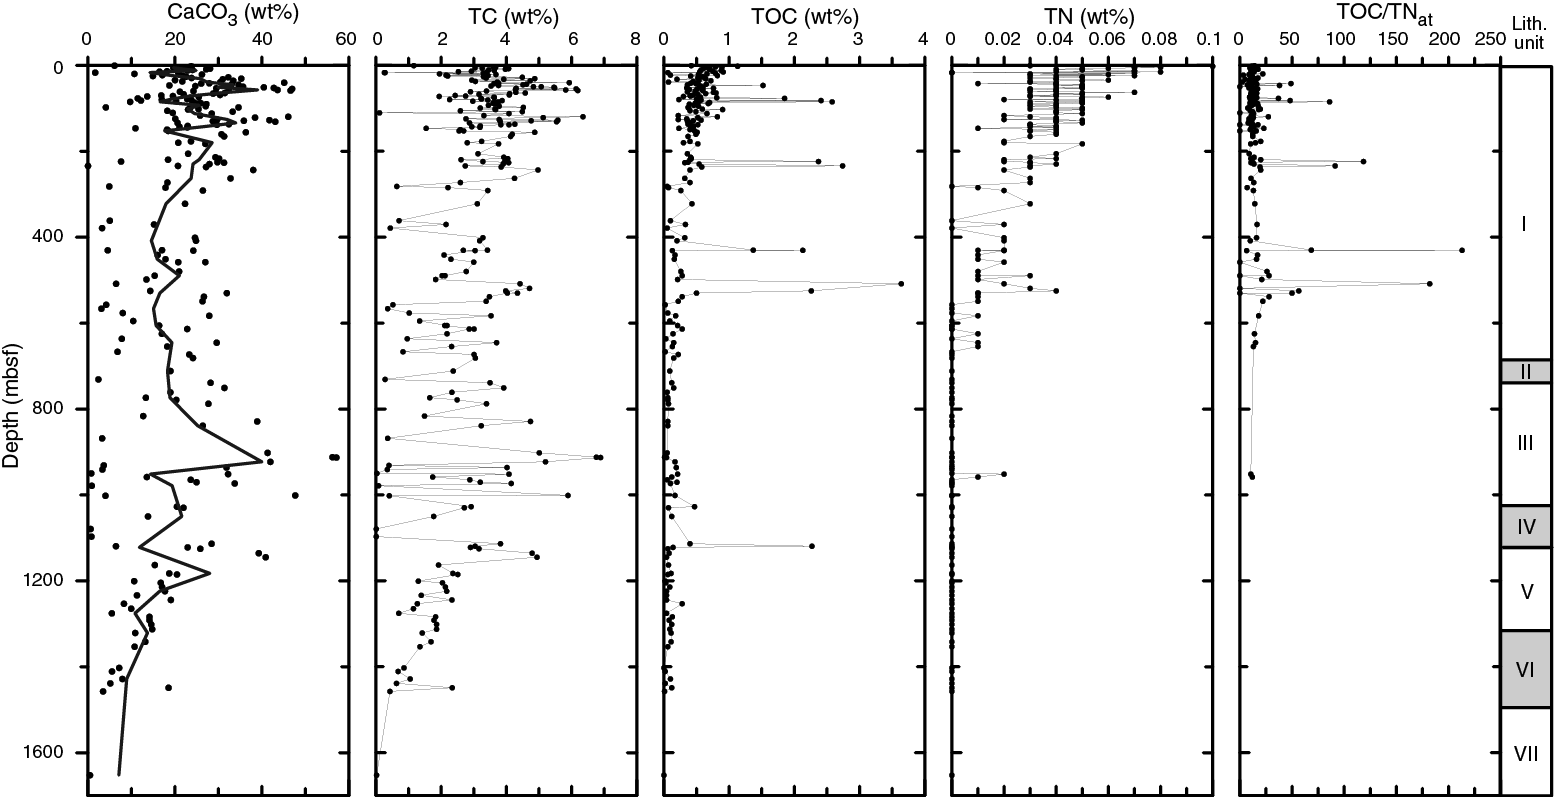
Figure F41. CaCO3 depth profiles.
The observed strong and short-termed variations in sedimentary CaCO3 weight percentages may not be a result of highly variable inputs of CaCO3 reaching the seafloor but a result of varying inputs of detrital material such as clay and ash, which may act as diluents.
TOC contents range from below detection to a maximum of 3.64 wt% at 508 mbsf (average = 0.45 wt%) throughout the cored sequence and are comparatively higher in the upper ~230 mbsf, where the TOC average is 0.61 wt%, although there are several peaks with elevated TOC contents thereafter. Despite these peaks, TOC contents remain at a low level of 0.26 wt% deeper than ~230 mbsf.
TN contents are generally low throughout Site U1437. Values range up to a maximum of 0.1 wt% with an average of 0.024 wt% and highest TN contents in the uppermost ~230 m of the cored sequence. Deeper than that depth, TN contents decrease continuously, probably as a result of nitrogen loss during diagenesis.
TOC/TNat ratios vary from 2.33 to 213 with an average of 18.6, suggesting a mixed input of both marine- and terrestrial-derived organic matter. Typical values for marine sources of organic matter range between 4 and 10, whereas terrestrial-derived organic matter has TOC/TNat ratios >20. However, the TOC and TN values at Site U1437 show only a very weak correlation (R2 = 0.18), possibly suggesting an important contribution of inorganic nitrogen sources. Ammonium adsorbed to clay particles can make up a significant TN fraction in organic-poor marine sediments (Müller, 1977). The admixtures of this inorganic nitrogen species and organic nitrogen may lead to overestimation of marine-derived organic matter, which is typically enriched in nitrogen (Meyers, 1994).
Major and trace elements
Major and trace element compositions of tuffaceous mud/mudstone indicate mixing between at least three major components (Figure F42). Based on variations in CaO and K2O, these are characterized as (1) high CaO and low K2O, (2) low CaO and low K2O, and (3) low CaO and high K2O. Sr and Rb display similar compositional patterns and can be interpreted as the trace element equivalents of CaO and K2O, respectively, with CaO and Sr being dominantly contributed by marine carbonate (with stoichiometric CaO = 56 wt% for pure CaCO3, and average Sr = 1100 ppm; Morse and Mackenzie, 1990), whereas K2O or Rb are essentially nil in marine carbonates but comparatively enriched in volcanic ash or terrigenous clay (e.g., Plank, 2014). A significant amount of carbonate in tuffaceous mud/mudstone is supported by large LOI values (average = 16 wt%), although this value may overestimate CaCO3 because of the presence of H2O and minor volatile components such as N or S. Direct determination of CaCO3 in a different set of samples (see above) yielded an average of 21.9 wt% and a maximum of 57.1 wt%. The identification of Components 2 and 3 is tentative because of the limitations of shipboard data in frequency and number of elements analyzed, but binary variation diagrams for K2O versus CaO and Rb versus Sr are consistent with Component 2, which has low K2O and low Rb, being Izu arc front and rear arc. Izu arc-front volcanism includes basalt-dominant island volcanoes with compositionally related rhyolite as well as compositionally distinct rhyolite from submarine calderas (e.g., Tamura et al., 2009). Rhyolite from submarine calderas (R2 type in Tamura et al., 2009) is higher in K2O and Rb compared to rhyolite from basalt-dominant island volcanoes (R1 type), but R2 rhyolite still falls short of the high K2O and Rb abundances at low CaO and K2O in some of the tuffaceous mud/mudstone samples. The same holds for the average composition of rear-arc volcaniclastics determined from Site U1437 data. We therefore invoke another component with K2O and Rb higher than the arc-front or rear-arc compositions. A suitable match for Component 3 is distal Ryukyu arc ash (Scudder et al., 2009), whereas terrigenous sediment such as Chinese loess (Chen et al., 2001) is insufficiently enriched in K2O and Rb to match Component 3 in mixing triangles. This explanation does not rule out the presence of terrigenous clay, but its presence would be geochemically cryptic because it would plot close to a binary join between arc-front and rear-arc ash (Component 2) and distal Ryukyu ash (Component 3) in Figure F42. Dilution of ash and clay components by siliceous ooze is also possible but hard to quantify with the existing geochemical data.
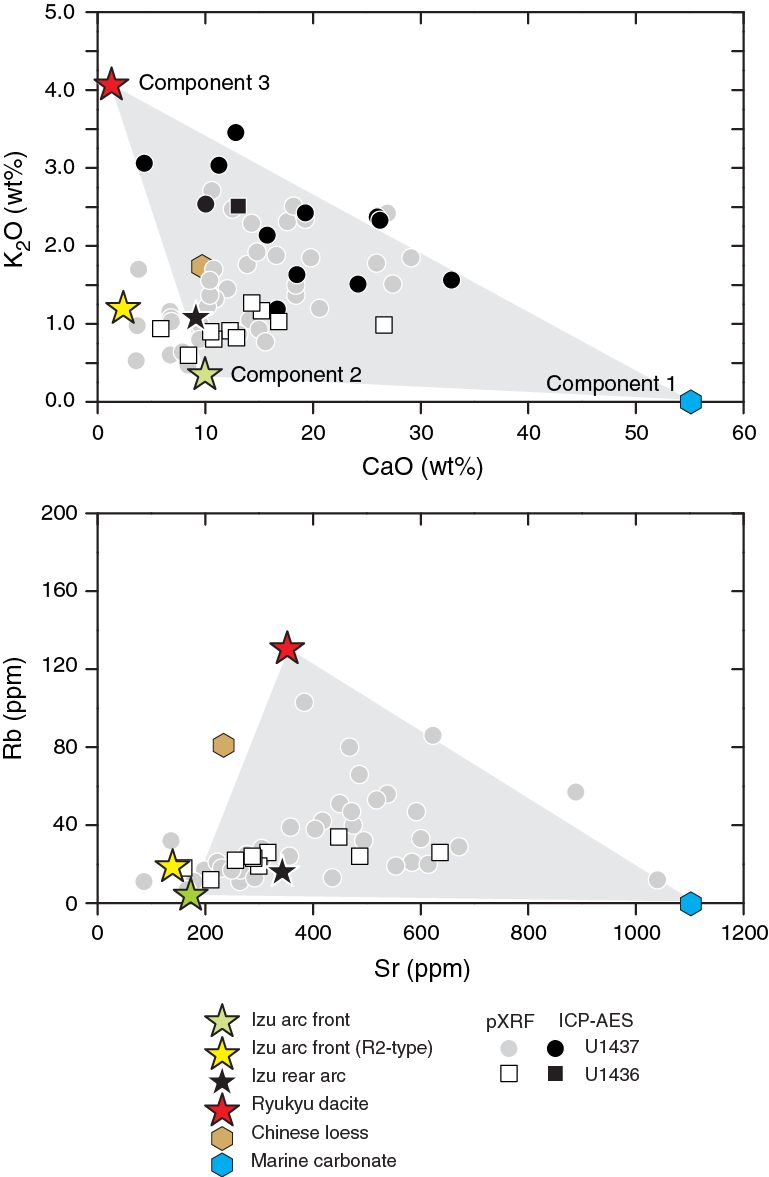
Figure F42. Tuffaceous mud/mudstone compositions.
Downhole variations in tuffaceous mud/mudstone geochemistry are monitored by minor and trace elements (Rb, Zr, and TiO2; Figure F43). These elements are only contributed in significant amounts by ash or terrigenous sediment, and Zr/Y is invariant with dilution from carbonates and siliceous ooze and alteration. Zr/Y from ICP-AES (n = 10) and pXRF (n = 38) closely agree and show systematic decreases with depth that correlate with decreasing Rb and Zr. TiO2, by contrast, increases especially below the transition from lithostratigraphic Unit III to IV at 1018 mbsf. This indicates a larger contribution from ash and clay relative to carbonate, which mirrors the increase in TiO2. The overall average for Site U1437 tuffaceous mud/mudstone is Zr/Y = 3.1, which is slightly higher than in tuffaceous mud samples from fore-arc Site U1436 (Zr/Y = 2.7) but not as elevated as the average subducting sediment composition for the Izu-Bonin trench at 31°20′N (ODP Leg 185 Site 1149; Zr/Y = 3.3; Plank and Langmuir, 1998). Significant variations in Zr/Y with depth are detected by both pXRF and ICP-AES analyses of tuffaceous mud/mudstone: maximum Zr/Y in tuffaceous mud from Unit I is 4.4, whereas values as low as 1.6 are detected in Units III–VI (no tuffaceous mudstone was recovered from Unit VII). Importantly, the decrease in Zr/Y is correlated with downhole decreases in Rb. It thus appears unlikely that the downhole trends in Zr/Y reflect variations in ash provenance from local sources (i.e., arc front versus rear arc), which are both extremely depleted in Rb, but rather a declining influence of terrigenous clay or distal ash, especially from sources with high Zr/Y and Rb such as the Ryukyu arc. This agrees with findings from Site 1149 (Scudder et al., 2009) and suggests a remarkable far-field influence of <3.5 Ma volcanic activity in the Ryukyu arc on the chemistry in fine-grained sediment in the northwest Pacific Ocean.

Figure F43. Depth variations for mud and mudstone.
Igneous geochemistry
Sampling, data acquisition, and data treatment
Analyses were carried out by pXRF and ICP-AES, and samples included ash and tuff (pXRF n = 88; ICP-AES n = 26), lapilli-tuff and lapillistone (pXRF n = 7; ICP-AES n = 14), igneous clasts (pXRF n = 39; ICP-AES n = 9), and a rhyolite sheet (pXRF n = 1; ICP-AES n = 1). Reconnaissance pXRF and ICP-AES analyses generally agree within <20% (relative) for elements that can be analyzed by both techniques. ICP-AES data reported here include only samples with analytical totals of 100% ± 5% (after ignition).
Identifying sources for volcaniclastic intervals at Site U1437 requires accounting for the detrimental effects of pervasive alteration, which causes element mobility. These effects are most severe for alkali elements and Ba (Gill et al., 1994) and less so for elements that are insoluble in seawater (Ti, Al, and Fe; e.g., Stroncik and Schmincke, 2002). High-field-strength element ratios such as Zr/Y remain largely unaffected by alteration (Gill et al., 1994). Another concern is contamination with pelagic sediment, especially in fine-grained ash or tuff samples, which can impact major and trace elements such as CaO and Sr that are enriched in calcareous materials. High-field-strength element ratios are reliable indicators here because they are invariant with regard to carbonate abundances (estimated from CaO). All major elements are plotted normalized to 100 wt% volatile-free.
Volcaniclastics compositions and provenance
Rear-arc seamount and arc-front volcanoes are geochemically distinct in several major and trace elemental as well as isotopic parameters. Here, we compare shipboard analyses with a compilation of literature data, which we grouped into two major categories, and these fields are shown in Figures F44 and F45:
- Izu arc front includes basalt-dominant island volcanoes and rhyolite-dominant submarine calderas (Tamura et al., 2009), as well as turbidite/volcaniclastic samples collected in the fore-arc region (Jordan et al., 2012; Gill et al., 1994; Bryant et al., 2003; Straub, 2003; Straub et al., 2010). The basalt-dominant island volcanoes also produced minor amounts of rhyolite (termed R1 type by Tamura et al., 2009), which have lower Zr/Y (1.1–3.2) than rhyolite erupted from submarine calderas (R2 type; Zr/Y = 2.7–5.5; Tamura et al., 2009).
- Rear-arc volcanic rocks include all the rear-arc seamount volcanoes from 3 to 17 Ma (Hochstaedter et al., 2001; Ishizuka et al., 2002, 2003a, 2003b, 2006a, 2006b; Machida et al., 2003, 2008; Tollstrup et al., 2010), which are generally higher in Zr/Y (1.4–6.7) compared to arc-front rocks at comparable SiO2, but there is some overlap between R2 arc-front rhyolites and rear-arc seamount rocks.
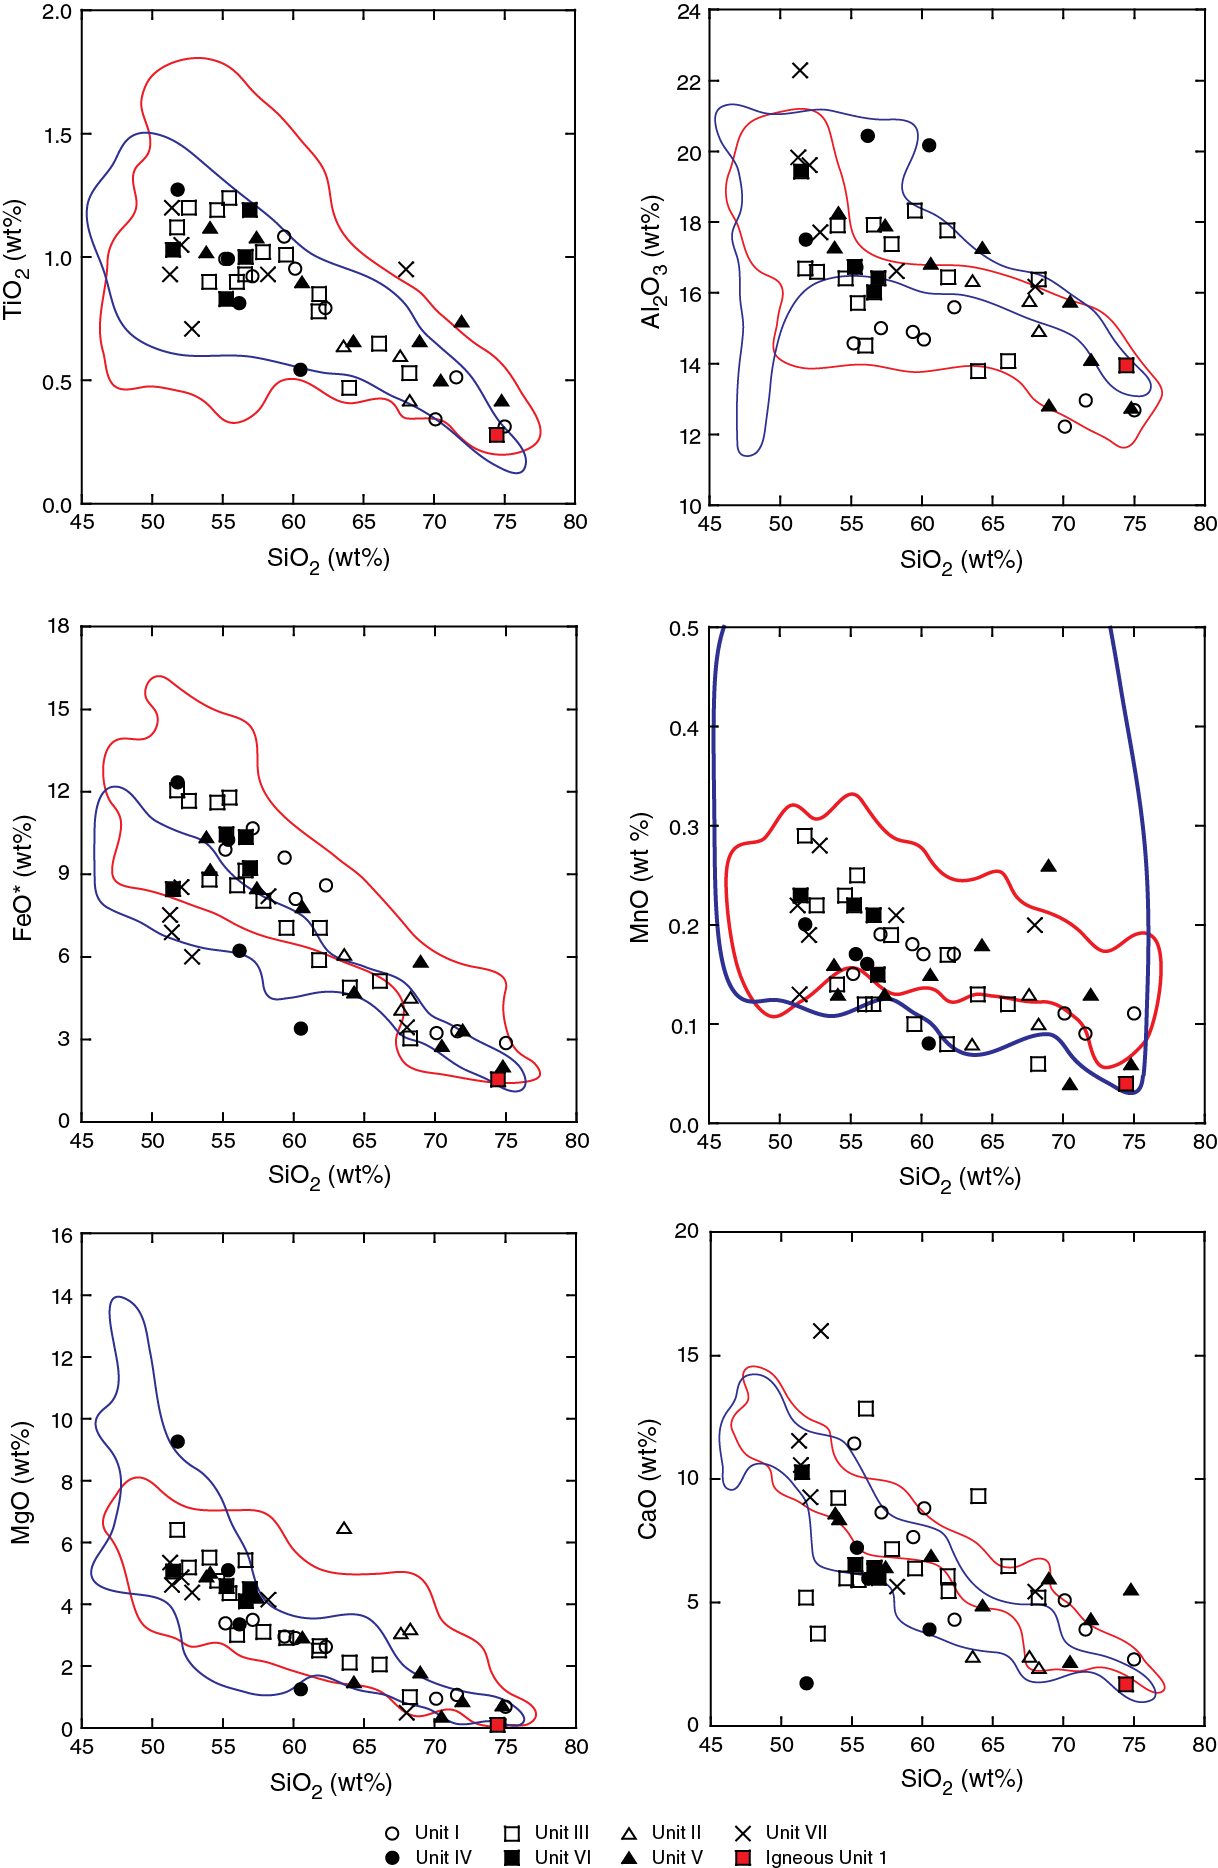
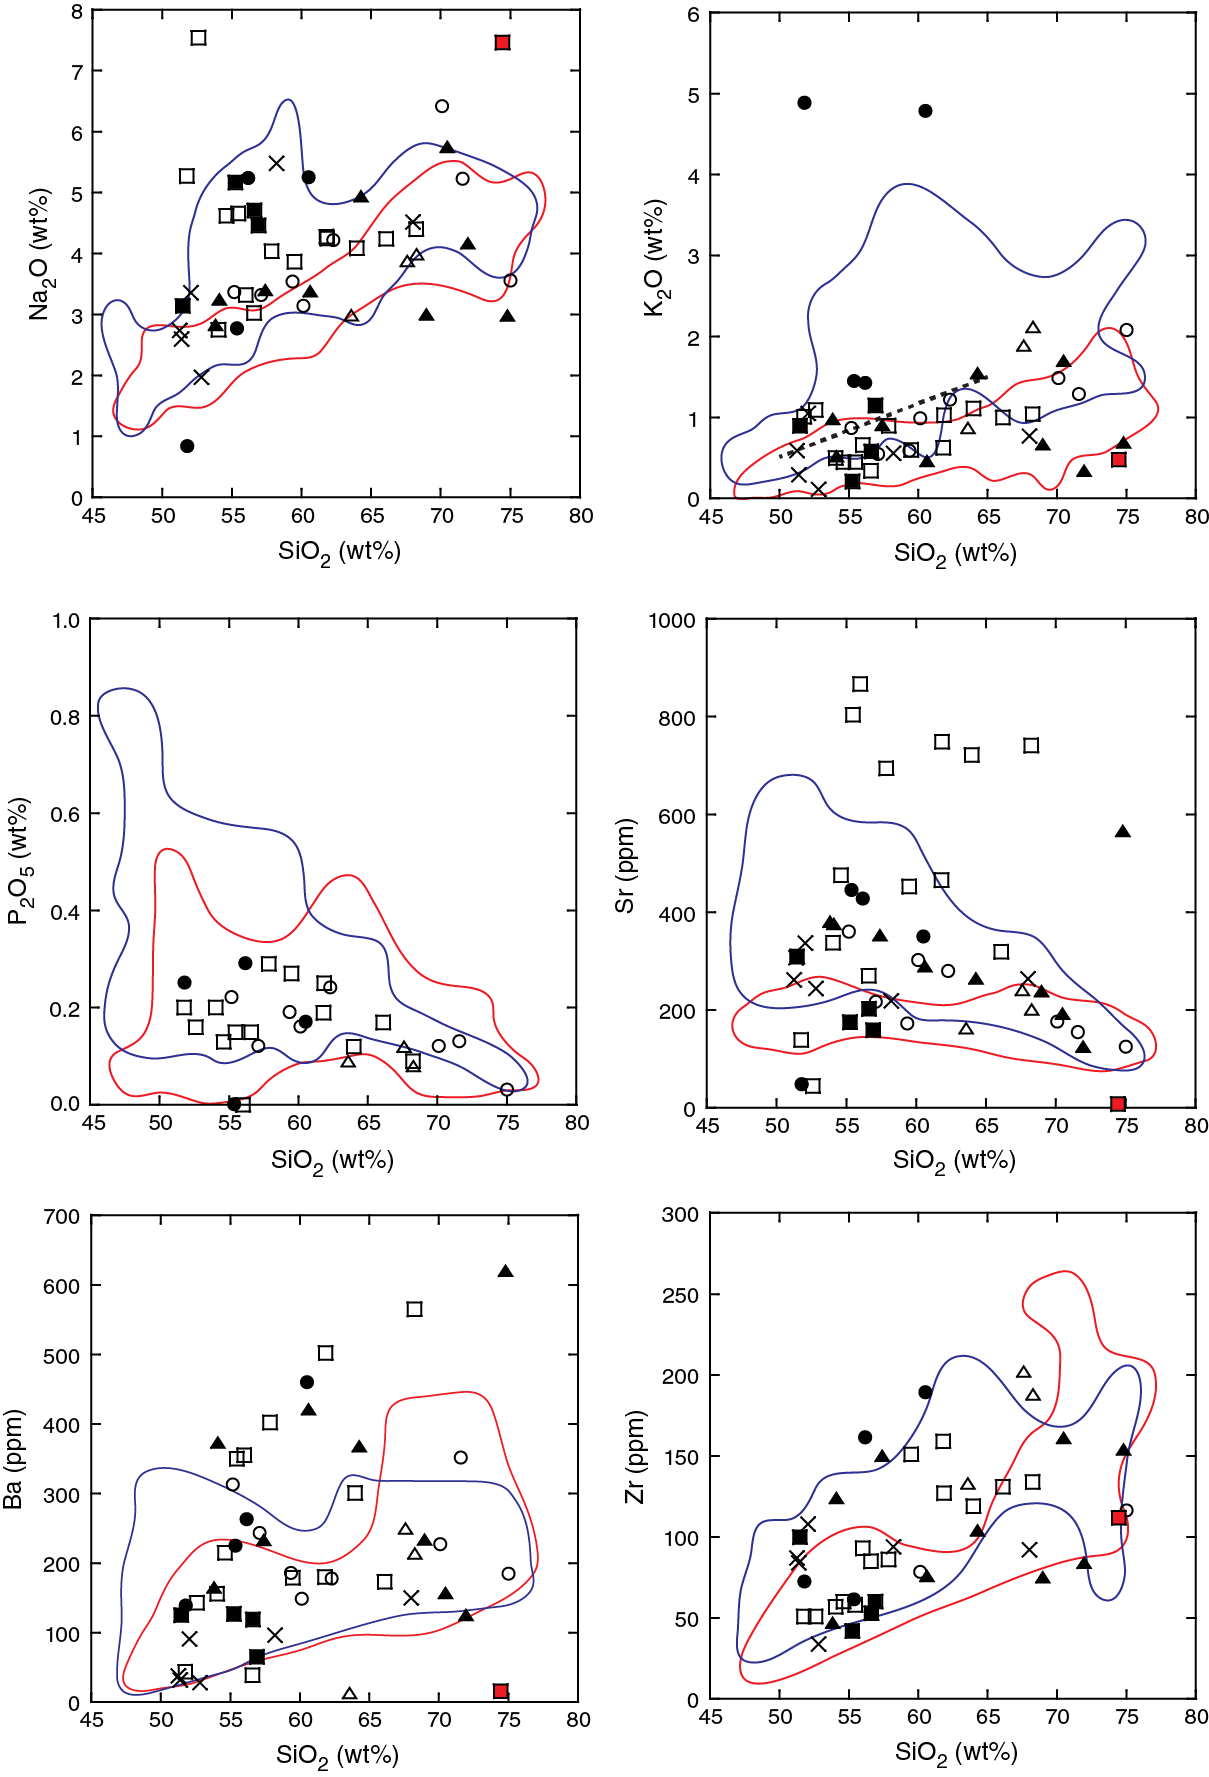
Figure F44. Major and trace element compositions vs. SiO2.
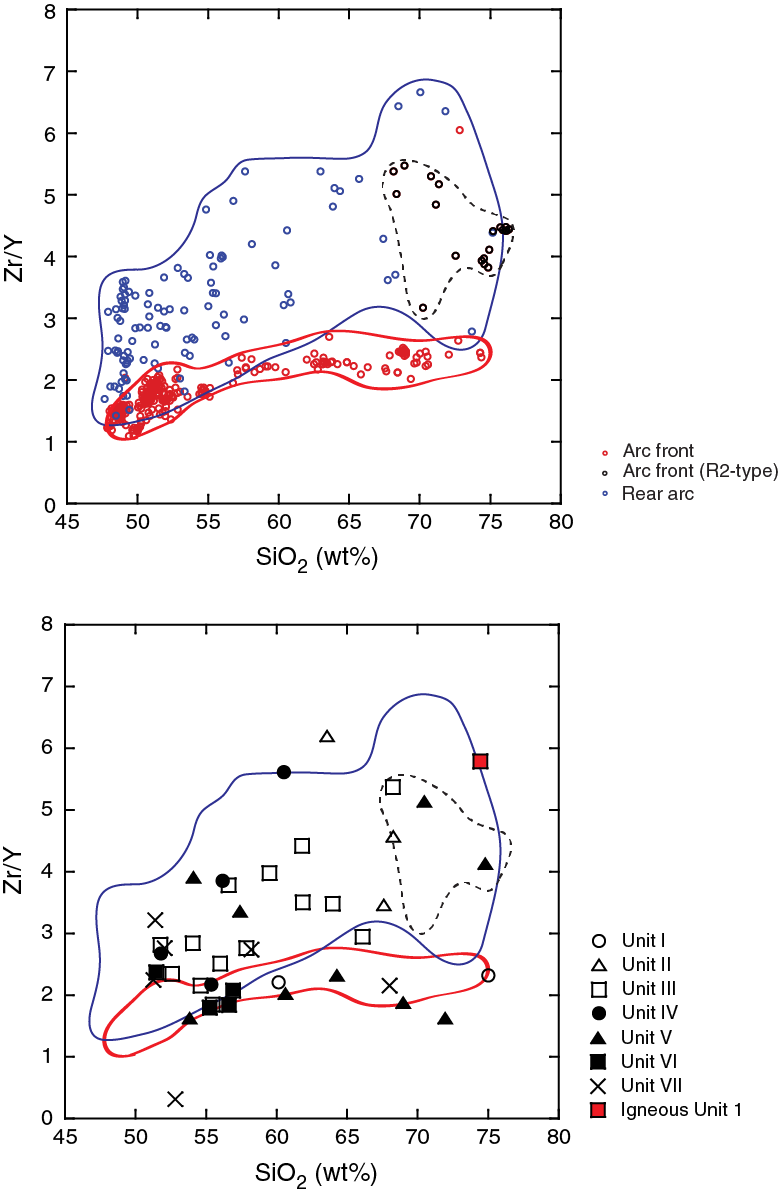
Figure F45. Zr/Y vs. SiO2.
Volcanism younger than ~3 Ma immediately to the west of the arc front also comprises bimodal eruptions in active rift basins, ridges, and seamounts, collectively termed back-arc knolls (Tollstrup et al., 2010). For simplicity, we excluded these compositions from plotting but we note that they are often transitional between Category 1 and 2 rocks. This limits unambiguous source assignments for samples younger than 3 Ma from Site U1437.
Lava from rear-arc volcanoes has higher K2O, Sr, and Zr/Y ratios at the same SiO2 content than that of arc-front volcanoes (Figures F44, F45, F46). This discrimination is only applicable to the Neogene volcaniclastics.
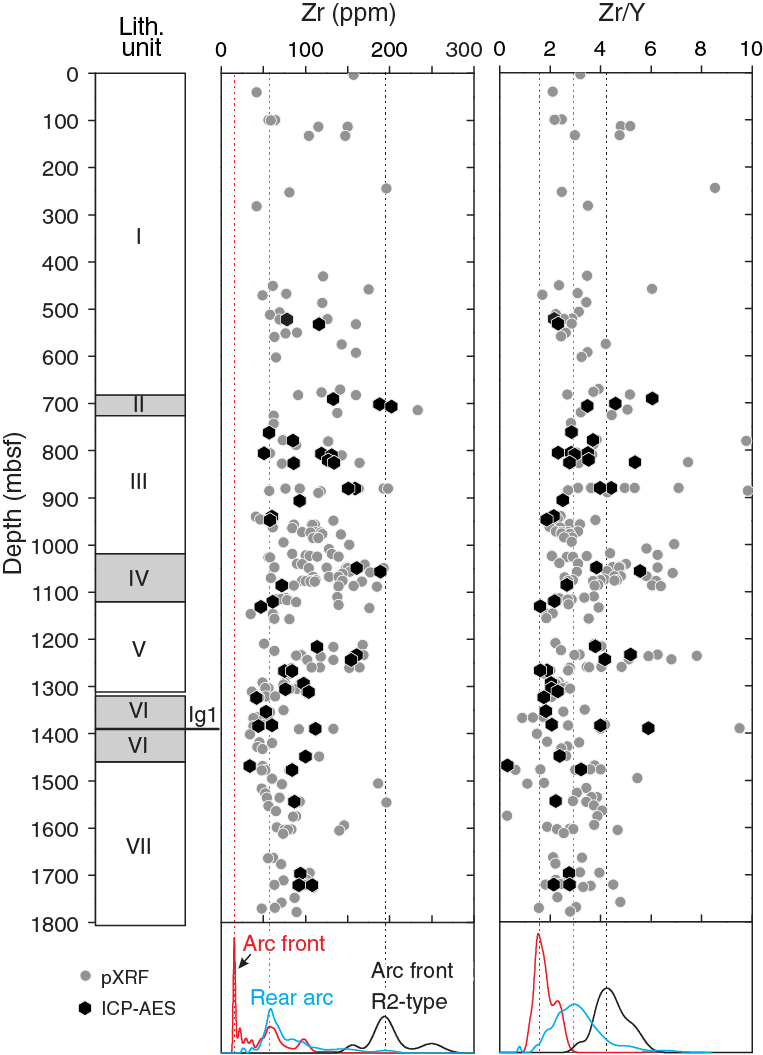
Figure F46. Zr and Zr/Y.
Unit I
Unit I samples from 0 to 440 mbsf (<3 Ma) include 6 ICP-AES and 13 pXRF analyses of mostly ash and rare lapilli. They range from basaltic andesite to rhyolite and have relatively low K2O abundances (0.35–1.48 wt%), generally overlapping with compositions of arc-front and active rift volcanic rocks (Figure F44). Unit I samples from 440 to 682 mbsf (3–4.3 Ma) include 2 ICP-AES and 19 pXRF analyses of tuff that range in composition from andesite to rhyolite. These have slightly higher K2O contents (0.50–2.43 wt%) compared to the <3 Ma ash and have low Zr/Y (2.2–2.3) similar to arc-front igneous compositions (Figure F45). With the possible exception of 3 high-SiO2 (70–75 wt%) samples at 3, 56, and 541 mbsf, most ash is a mixture between mafic and evolved end-members, which may be representative of average magma compositions. Reconnaissance pXRF analyses for shallow Unit I (<3 Ma) yielded Zr/Y from 2.1 to 8.4 with a median value of 3.2 (n = 13). The high Zr/Y sample at 244 mbsf is a lapilli-tuff and is thus likely proximal, although its Zr/Y exceeds that of known rear-arc eruptions. Low Zr/Y samples (e.g., at 40 mbsf) are fine-grained mafic ash, consistent with a distal origin from the arc front. Deeper Unit I (>3 Ma) samples show a similar range in pXRF Zr/Y (1.7–6.0) and a median Zr/Y (2.9) that is indistinguishable from those of shallower Unit I volcaniclastics, consistent with ICP-AES analyses (Figure F45). Low Zr/Y (2.3) of the high-silica tuff sample at 531.7 mbsf suggests a possible origin as a R1 rhyolite associated with a basalt-dominant island volcano in the arc front (Tamura et al. 2009).
Unit II
Unit II (682.12–726.50 mbsf; age model ~4.3–4.4 Ma) is marked by a shift in grain size and style of deposition containing the first lapilli-tuff and lapillistone deposits. Unit II samples include three ICP-AES and four pXRF analyses of tuff and lapilli-tuff ranging from andesite to dacite with K2O contents from 0.39 to 2.22 wt% (Figure F44). The sample at 691 mbsf represents an individual lithified pumice clast that is dacitic in composition (SiO2 = 63.6 wt%) with high LOI (6.9 wt%) suggesting some alteration. This is supported by elevated MgO concentrations (6.48 wt%) relative to SiO2. However, Zr/Y (6.2) is elevated to a level that is only found in rear-arc lava (Figure F45). The bulk lapilli-tuff sample at 701.2 mbsf comprises intricate layers with variable proportions of glass and crystals (feldspar, amphibole, clinopyroxene, biotite, and minor quartz), whereas the sample at 706.2 mbsf consists primarily of fresh and devitrified glass with plagioclase and amphibole of uniform grain size. Both are dacites (68.3 and 67.6 wt% SiO2) with moderate K2O concentrations of 2.12 and 1.89 wt%, respectively, consistent with a rear-arc origin (Figure F44).
Unit III
Unit III (726.50–1017.88 mbsf; age model ~4.4–6.2 Ma) consists primarily of altered green tuffaceous mudstone with occasional interbedded tuff. Fourteen volcaniclastic samples analyzed by ICP-AES have intermediate compositions ranging from basaltic andesite to dacite and are mostly similar to the arc-front field in K2O versus SiO2 (Figure F44), with the exception of 4 samples between 805 and 827 mbsf, which have elevated K2O. Sr concentrations vary greatly (up to 804 ppm) and are elevated compared to Unit I and II volcaniclastics as well as lava from the arc front and typically higher than rear-arc lava. Two basaltic andesite samples (805.2 and 805.8 mbsf), contain exceptionally low Sr concentrations (45 and 139 ppm), for which the closest equivalent are Manji Seamount volcanic rocks with potassic alteration (Sr = 107 ppm; Ishizuka et al., 2002).
All but 3 volcaniclastic samples display elevated Zr/Y compared to rocks from basalt-dominant volcanic islands in the Izu arc front, which generally have Zr/Y peaks at 2.5. This includes several volcaniclastic samples that are coarse-grained tuff to minor lapilli-tuff. Low Zr/Y (<2.5) volcaniclastics in Unit III includes andesitic tuff samples at 805.2, 940.0, and 947.6 mbsf (Zr/Y = 1.8), in which glass shards are often altered (Figure F45). Despite the presence of some low Zr/Y volcaniclastics likely derived from basalt dominant volcanoes in the arc front, high Zr/Y volcaniclastics are predominant in Unit III, as indicated by the overall median Zr/Y of 3.1 (pXRF n = 43; ICP-AES n = 14), which is elevated above the average for arc-front basalts, intermediates, and R1 rhyolites.
Unit IV
Unit IV (age model ~6.2–7.5 Ma) samples analyzed by ICP-AES include a single andesite clast from 1049.2 mbsf and three bulk lapilli-tuff samples at 1056.5, 1085.7 and 1120.0 mbsf. All samples show evidence for alteration. Samples at 1056.5 and 1085.7 mbsf also have low CaO relative to SiO2 and anomalously high K2O (4.78 and 4.88 wt%, respectively) and are characterized by high abundances of submicroscopic alteration phases (~40 and ~50%, respectively). The sample at 1120.0 mbsf has high FeO* (Figure F44), consistent with pervasive chlorite alteration visible in thin section. With this caveat, we interpret the elevated Zr/Y (median Zr/Y from pXRF = 4.1; n = 41) and ICP-AES (average Zr/Y = 3.6; n = 4) as supporting evidence for the comparatively large grain size indicating proximal sources in the rear arc, most likely Manji Seamount (Figure F45).
Unit V
Nine volcaniclastic samples (4 lapilli-tuff, 3 tuff, 1 lapillistone, and 1 tuff-breccia) analyzed by ICP-AES from Unit V (1120.11–1312.21 mbsf; 7.5–9 Ma) show large compositional variations from basaltic andesite to rhyolite and are chemically more depleted than Unit IV volcaniclastics. Samples at 1130.9, 1211.6, 1233.7, and 1311.3 mbsf have slightly higher K2O (0.91–1.70 wt%) than arc-front rocks (Figure F46). The other 5 ICP-AES samples in Unit V have low K2O (0.34–0.69 wt%). This includes a rhyolite tuff with fiamme at 1244.0 mbsf that displays low K2O (0.69 wt%) and high Ba (620 ppm) and Sr (566 ppm) concentrations, suggesting the influence of alteration on the chemical composition (Figure F44). Four volcaniclastic samples (tuff-breccia, lapillistone, lapilli-tuff, and tuff) display elevated Zr/Y (>3) that are higher than compositions for basalt-dominant island volcanoes in the arc front (1211.6, 1215.9, 1233.7, and 1244.0 mbsf). The lack of systematic variations between K2O and Zr/Y (both potential discriminants between rear-arc and arc-front sources) is interpreted to result from intense alteration. The sample at 1130.9 mbsf, for example, is an andesitic tuff that has rear arc–like K2O (0.98 wt%) but low Zr/Y (1.6) indicative of an arc-front magma composition. On the contrary, the sample at 1216.0 mbsf, a lapillistone with andesite clasts, has low K2O (0.53 wt%) but high Zr/Y (3.9).
Unit VI
Six samples from Unit VI (1320.00–1459.80 mbsf) analyzed by ICP-AES are 4 lapilli-tuff samples, 1 andesite clast, and 1 rhyolite intrusion (igneous Unit 1). Unit VI is older than 9 Ma and includes a biostratigraphic age constraint between 10.97 and 11.85 Ma; igneous Unit 1 yielded postcruise U-Pb zircon ages averaging 13.6 Ma. Three lapilli-tuff samples and a clast are basaltic andesite in composition. A single andesite clast sample at 1448.0 mbsf has slightly higher K2O (0.90 wt%) relative to SiO2 than expected if it evolved along the arc-front trend (Figure F44), yet its Zr/Y (2.4) is well within the range of basalt-dominant arc-front lava and volcaniclastics (Figure F45). Three lapilli-tuff samples (1324.5, 1353.8, and 1382.1 mbsf) also have low Zr/Y (1.8–2.1), consistent with low K2O (0.21–0.58 wt%) except for the sample at 1382.1 mbsf, which is moderately enriched in K2O (1.15 wt%). Nineteen pXRF analyses on Unit VI samples yielded a median Zr/Y of 2.5, consistent with low Zr/Y in ICP-AES analyses (2.2; n = 8) and confirm the generally depleted nature of the volcaniclastics in Unit VI. One unusual composition is that of the sample from 1383.5 mbsf, which has high SiO2 = 85.6 wt% indicating silicification, which is consistent with the presence of chalcedony observed petrographically.
The rhyolite intrusion (igneous Unit 1; 1388.86–1390.07 mbsf; sampled at 1390.0 mbsf) is a highly evolved rhyolite with extremely low Sr (8 ppm) and Ba (16 ppm), unusually low K2O (0.48 wt%), but high Zr/Y (5.8) (Figures F44, F45). Its origin remains elusive with limited shipboard analyses, but high-silica rhyolites with extremely low abundances of feldspar-compatible trace elements such as Sr and Ba are interpreted to be products of protracted fractional crystallization rather than direct products of crustal melting (Mahood and Halliday, 1988).
Unit VII
Six volcanic lithic clasts from volcanic breccia in Unit VII (1459.8–1806.5 mbsf) were analyzed by ICP-AES, including 5 andesites and 1 dacite. No direct age constraints exist, but it is older than the tentative biostratigraphic age of 10.97–11.85 Ma indicated in Unit VI, and/or the preliminary U-Pb zircon concordia intercept age of 13.6 Ma in igneous Unit 1. All but 1 sample are highly depleted in K2O (0.11–0.77 wt%) similar to arc-front rocks (Figure F44). The sample at 1721.4 mbsf displays slightly higher K2O (1.05 wt%) compared to other Unit VII samples. This sample also has significantly higher Ba and lower Cr and Cu compared to the other three andesite samples at equivalent SiO2 (1468.2, 1477.1, and 1544.1 mbsf), suggesting different volcanic sources. All Unit VII ICP-AES samples have comparatively low Zr/Y (average = 2.6; n = 3), overlapping with the range of pXRF analyses of clasts from this unit (average = 3.0; n = 45). These values generally fall between the peak in Zr/Y for basalt-dominant island volcanoes in the arc front and Zr/Y in rear-arc lava (Figure F45).
Zr/Y ratios as an indicator for magmatic provenance of the volcaniclastics
The presence of low-temperature alteration (indicated by the presence of biotite) and high-temperature alteration (indicated by the presence of epidote) has been observed from dredged and submersible samples on the Manji Seamount (Ishizuka et al., 2002). These alterations can greatly affect major and trace element compositions evident in steep depletions in CaO relative to increasing SiO2 (Figure F44). We focus on Zr and Y because they are relatively fluid immobile and remain robust during alteration (Gill et al., 1994). This is supported by published Manji Seamount data that have near-constant Zr/Y even when highly altered (Ishizuka et al., 2002). Consequently, we use primarily shipboard Zr/Y analyses as an indicator for magmatic provenance and to distinguish between rear-arc and arc-front sources.
Provenance of the volcaniclastics and in situ magma evolution
Downhole geochemical variations in Units I–V generally reflect the relative proportions of distal arc-front and proximal rear-arc volcanic sources (Figure F46). As a general trend, coarse-grained volcaniclastics from Units II and IV show stronger rear-arc affinity compared to fine-grained tuff from Units I, III, and V. Complications for provenance arise from mixing evident by mafic and evolved glass shards in fine-grained volcaniclastic samples and pervasive green alteration in Units III and V.
The predominance of ash layers from Unit I containing low K2O relative to SiO2 indicates a likely arc front or active rift (ash <2 Ma) provenance. Some <3 Ma volcaniclastics in Unit I with high Zr/Y could thus be mixtures of mafic and evolved (high Zr/Y rhyolites of the R2 type of Tamura et al., 2009) ash derived from arc-front volcanoes, but this cannot be confirmed without onshore in situ analyses of glass. The coarse-grained deposits from Units II and IV indicate proximal sources. Active Manji seamount chain volcanoes around the time of deposition of Unit II (4.2–4.3 Ma) were the Meireki Seamount (3.76 Ma; Ishizuka et al., 1998) ~20 km to the north and the Daigo-Nishi-Aogashima Knoll (5.05 Ma; Ishizuka et al., 2003b) ~40 km to the northeast of Site U1437. Both are rhyolite volcanoes with similar SiO2 contents (72–76 wt%), whereas Meireki Seamount volcanic rocks have higher K2O (~3 wt%) but lower Zr/Y (~2.8) compared to the Daigo-Nishi-Aogashima Knoll (K2O = ~1.5 wt%; Zr/Y = ~4.4) (Hochstaedter et al., 2001). Although the limited data (5 analyses in total) available for both seamounts preclude reliable geochemical matching with Unit II volcaniclastics, they are potential sources for lapilli in Unit II considering their geographic locations, ages, and chemical composition. Similarly, single clast compositions of Unit IV can be tentatively matched to available data for Manji Seamount volcanic rocks (~6.5–6.9 Ma; Ishizuka et al., 2002). Two high-K2O volcaniclastics resemble the high-K Manji Seamount rocks with potassic alteration, whereas most volcaniclastics from Unit IV follow the trend for altered Manji Seamount rocks leading to depletions in CaO with increasing SiO2 (Figure F44) (Ishizuka et al., 2002).
Unit V is primarily tuffaceous mudstone, and given the pervasive alteration throughout this unit, it is difficult to provide an accurate provenance for its volcaniclastic intervals. Based on ICP-AES Zr/Y data and the only moderately elevated median Zr/Y from pXRF (2.7; n = 39) (Figure F45), we tentatively interpret Unit V to be geochemically transitional, with volcaniclastic and clast compositions that include both rear-arc and arc-front sources. The presence of volcanic breccia (with clast sizes up to 40 cm) in Units VI and VII supports proximal volcanic deposition. However, the Zr/Y values of blocks within breccia vary widely between 0.4 and 4.0. Similar compositional heterogeneity exists in the late Miocene Shirahama Group in the Izu Peninsula of southern Japan, which represents accreted rocks of rear-arc origin (Tamura, 1994, 1995; Tamura and Nakamura, 1996; Tani et al., 2011). The Shirahama lava is divided into tholeiitic and calc-alkaline series, which have low Zr/Y and high Zr/Y, respectively. However, the late Miocene Shirahama lava does not display the same degree of depletion seen in the K2O contents of Unit VI and VII blocks.
Summary of downhole measurement results at Site U1437
In Hole U1437B, a heat flow of ~88.3 mW/m2 was determined based on in situ temperature measurements of the bottom water and of intervals corresponding to Cores 350-U1437B-4H and 7H (0, 33.7 and 62.2 mbsf, respectively; temperatures = 2.3, 5.32, and 7.45°C, respectively.) This heat flow is within the wide range of previous measurement in the area (see global heat flow database of the international heat flow commission [www.heatflow.und.edu/index2.html]).
The decision to log Hole U1437D was made when the bit reached 980 mbsf and was approaching its expected life expectancy. Most of the seismic reflectors and seismic layer boundaries within the target interval were estimated to be in the interval already cored at that point. Establishing the depth of these reflectors and tracking our progress down the seismic surveys was of high priority.
A free-fall funnel was deployed to allow reentry after dropping the bit on the seafloor. The triple combo tool string was run first and collected data from 962 to 92 mbsf, followed by the Formation MicroScanner (FMS)-sonic string logging from 945 to 133 mbsf. The Versatile Seismic Imager (VSI) was deployed as a third and last logging run, and data were successfully acquired at 14 stations spaced by 50 m from 873 to 223 mbsf.
Caliper data from the triple combo and FMS-sonic tool strings indicate that Hole U1437D was in very good condition. Hole diameter remained between 10 and 12 inches deeper than 250 mbsf, increased uphole to ~14 inches at 150 mbsf, and became wide immediately below the pipe. This narrow range in diameter and the overall smooth profile of the borehole mean that most measurements are reliable.
Five logging units were defined based on the triple combo and FMS-sonic data.
Logging Unit 1 (92–310 mbsf) is characterized by a decreasing trend with depth in gamma ray and resistivity (Figure F47). The bottom of this unit is defined at ~310 mbsf by the bottom of a very distinct 20 m thick interval (290–310 mbsf) with low gamma ray counts and high resistivity and magnetic susceptibility. This interval was not recovered in cores, which explains why no lithostratigraphic or physical properties unit boundaries were defined at this depth. The logging data indicate a sharp and drastic change in lithology at the lower boundary of the interval. Furthermore, Stoneley velocity and waveform data suggest that the 20 m thick interval has a relatively lower permeability. An 8 m thick interval at the bottom of logging Unit 2 (610 mbsf; see below) has a similar log signature and is dominated by tuffaceous mudstone with dispersed coarse volcaniclastic components. These intervals could represent redeposited and/or remolded material, perhaps debris flow deposits.
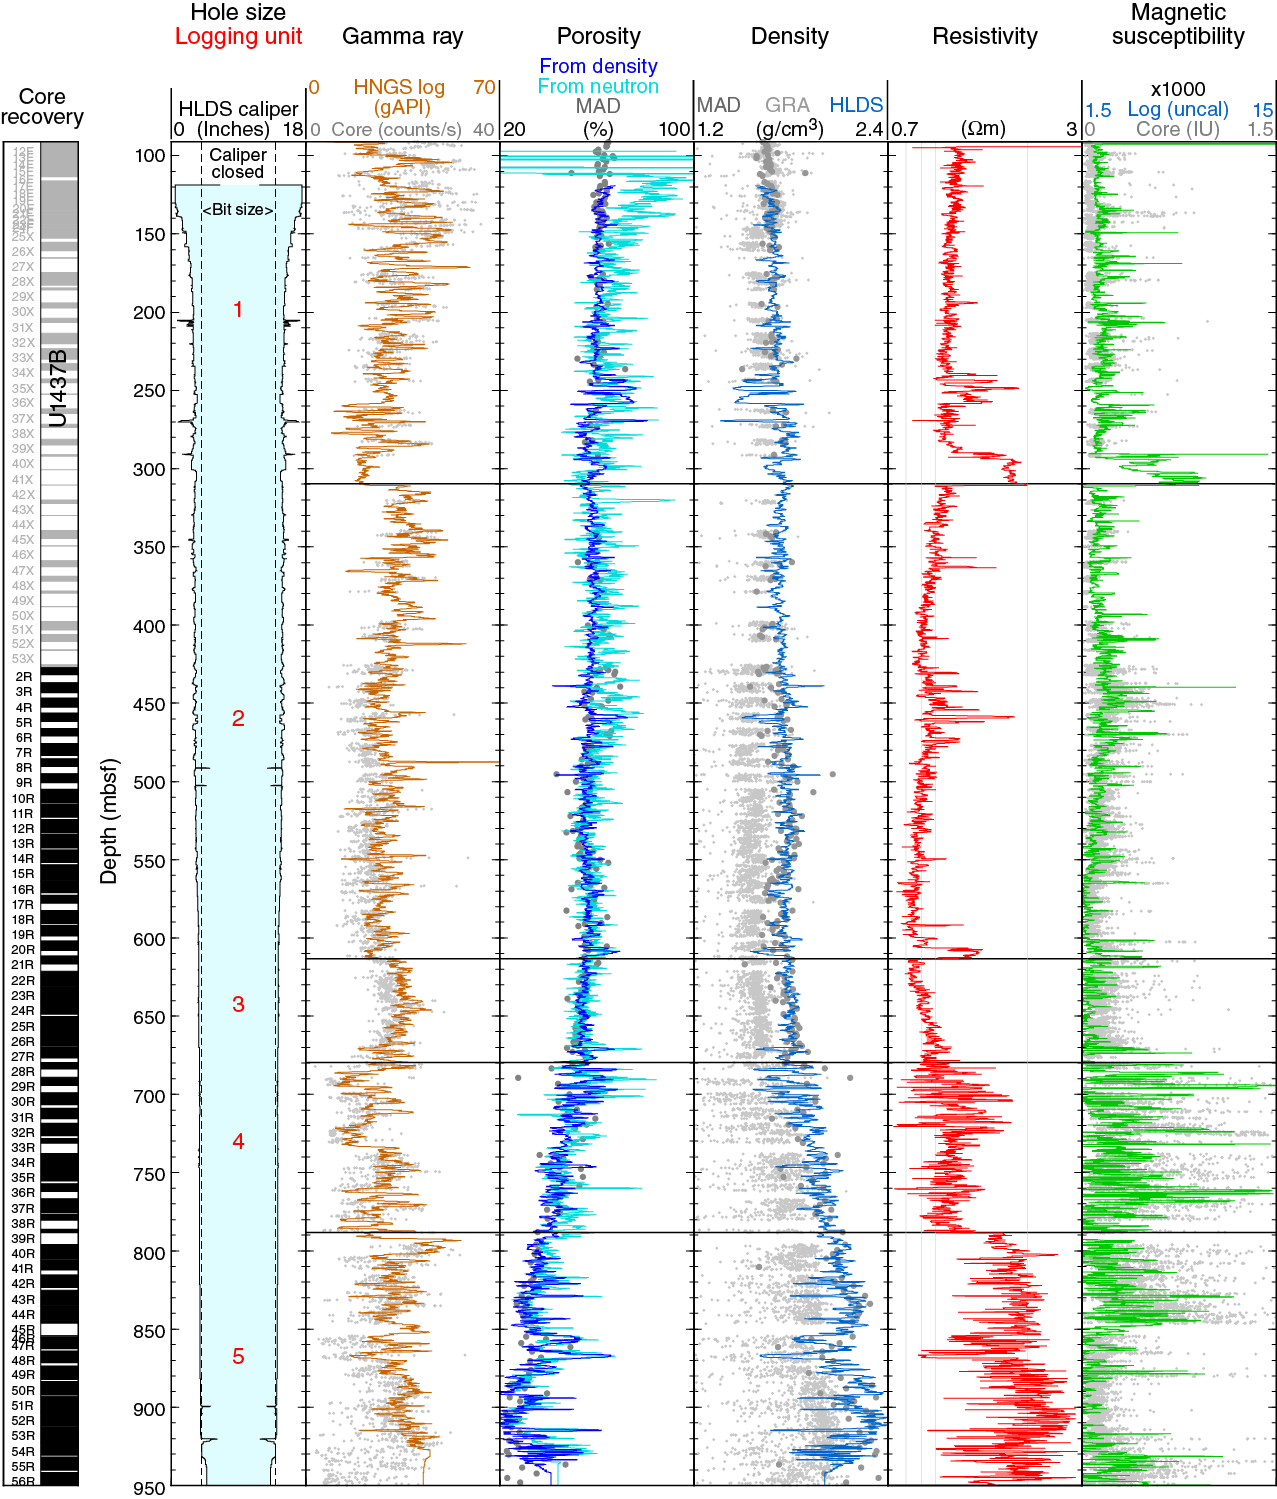
Figure F47. Logs recorded by triple combo tool string, Hole U1437D.
Logging Unit 2 (310–614 mbsf) is also characterized by a slightly decreasing downhole trend in gamma ray and resistivity, and its top is marked by the sharp gamma ray increase immediately below logging Unit 1. The only significant variability in the logs in this unit is an interval between 430 and 490 mbsf with fine (~1 m scale) peaks in resistivity, some of which are associated with lower density values (Figure F47). This interval is also where the lowest value in the Th/K ratio occurs, marking an inflection in the thorium content from slightly higher values shallower than this depth to lower values deeper that could be linked to an increase in volcaniclastic deposits. The bottom of the unit is an 8 m thick interval (606–614 mbsf) with high resistivity and low gamma ray and density, similar in character to the bottom of logging Unit 1, and mostly composed of tuffaceous mudstone with unrecovered intervals.
Logging Unit 3 (614–680 mbsf) shows an increase in resistivity with depth, contrasting with the decreasing trends in the shallower units. The density and velocity data also display a slightly enhanced increase with depth, combining with the resistivity trend to indicate a steady lithification. The bottom of logging Unit 3 coincides with both the lithostratigraphic Unit I/II and PP Unit 3–4 transitions.
Logging Unit 4 (680–790 mbsf), which corresponds to PP Units 4 and 5, is mostly defined by high levels of variability, particularly in resistivity, magnetic susceptibility, and velocity. Magnetic susceptibility values are also significantly higher than in the shallower units. The high variability in all data and the high susceptibility can be related to the change to predominantly coarse volcaniclastic material that defines lithostratigraphic Unit II.
Logging Unit 5 (790–950 mbsf), which corresponds to PP Units 6 and 7, has a sharp increase in gamma ray, resistivity, and velocity at the top. The gamma ray increase is produced by an increase in potassium. Resistivity is extremely variable over the unit, which is manifest in the multiple centimeter-scale resistive layers that alternate in the FMS electrical images recorded in this unit.
The VSI check shots resulted in a shipboard time-depth model showing that the prominent seismic reflectors at Site U1437 are shallower than originally estimated by ~10%. These VSI results are supported by the construction of synthetic seismograms from density (triple combo) and velocity (FMS-sonic) logs. The reflectors defining the bottom of seismic Layers L2 and L3 are at ~310 (previously estimated at ~310) and ~710 (previously estimated at ~780) mbsf, respectively. The improved time-depth relationship was used to convert the seismic section at Site U1437 into a depth section (Figure F48).
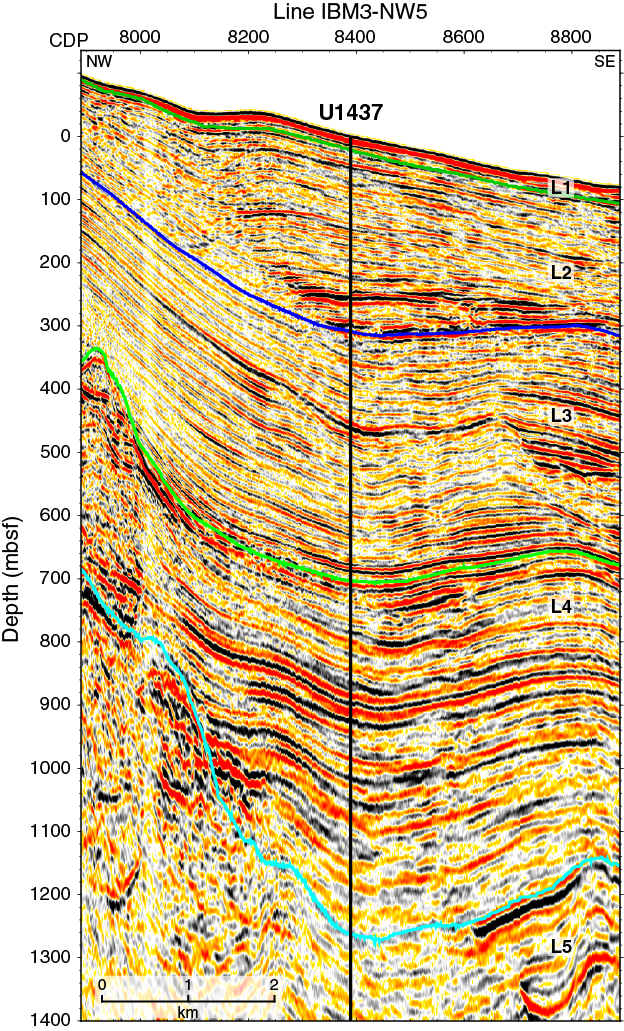
Figure F48. Seismic Line IBM3-NW5 crossing Site U1437.
Summary and interpretation of volcaniclastic deposits
The 1800 m thick section drilled at Site U1437 is dominantly fine grained, with tuffaceous mudstone making up 58% of the section. The discrete thin ash/tuff layers that make up 21% of the described core are the products of some combination of subaqueous suspension fallout and dilute density currents, as discussed further below. Only 20% of the described core contains particles coarser than 2 mm (lapilli), and many of these are fine-grained lapilli (<2 cm); the basal two lithostratigraphic units (VI and VII) have coarser lapilli and scattered blocks, and these two units make up only ~25% of the 1800 m thick section.
The tuffaceous mud/mudstone that dominates Site U1437 is featureless except where ash or tuff layers grade up into tuffaceous mud/mudstone, and bioturbation is marked by mixing of the ash into the tuffaceous mud/mudstone. Therefore, it seems likely that virtually all primary sedimentary structures in the tuffaceous mud/mudstone were obliterated by bioturbation. That makes it impossible to determine whether the tuffaceous mud/mudstone was deposited from hemipelagic rain, dilute turbid flows, bottom currents (e.g., related to the Kuroshio Current), or some combination thereof. Future geochemical work is expected to contribute to an understanding of the provenance of the tuffaceous mud/mudstone. Any hypothesis for the origin of this dominant lithofacies at Site U1437 must take into the consideration the fact that it accumulated at unusually high rates for such fine-grained material (Figure F25).
Interpretation of eruption and depositional processes
Despite the dominance of featureless tuffaceous mud/mudstone in the section drilled at Site U1437, macroscopic and microscopic shipboard analysis of the discrete ash/tuff and lapilli-ash/lapilli-tuff beds at Site U1437 allows us to make preliminary interpretations about the eruption, transport, and depositional processes that produced them. This analysis deals with deposits from all of the lithostratigraphic units described above (Units I–VII).
Evolved ash/tuff and mafic ash/tuff
The sharp basal contacts, good sorting, and normal grading in this lithofacies could indicate deposition by suspension settling through water, seafloor hugging density currents, or some combination (e.g., vertical density currents that transition into lateral density currents when they reach the seafloor in a manner envisioned by Carey [1997] and Manville and Wilson [2004]). These are the only volcaniclastic deposits in Units I and III besides the tuffaceous mudstone.
Intercalated white to gray-green evolved tuff and fine-grained light green tuff
These two similar lithofacies are fine grained, with laminations produced by alternation of glass shard–rich layers (white) and layers of mixed shards, pumice, and crystal fragments (gray-green), repeated over intervals up to several meters thick, with no bioturbation or tuffaceous mudstone interbeds. Thus, the intervals seem to record fairly continuous but pulsating sedimentation, probably from unsteady density currents, over a relatively short period of time for each interval (possibly days or weeks). The very large quantity of very fine glass shards in this facies suggests either phreatomagmatic eruption with extremely efficient glass fragmentation or extreme sorting of products from dry pyroclastic eruptions. These lithofacies occur in Units III, IV, and V.
Monomictic pumice lapilli-tuff and lapillistone
This lithofacies is relatively well sorted with abundant interstratified well-sorted crystal and vitric tuff, and is stratified, with planar and cross lamination, sharp bases, and grading bioturbated tops. This lithofacies is interpreted to represent density current deposits, and the monomictic composition may indicate that at least some were eruption fed. This lithofacies dominates Unit II.
Monomictic tuff with pumice and fiamme
This lithofacies consists of poorly sorted beds with basal scour, composed largely of ash-sized material, with lesser pumice lapilli or fiamme that become more abundant upward in each bed, indicating density grading. This lithofacies is interpreted to represent density current deposits. The monomict composition and the presence of abundant evolved glass shards, pumice, and broken crystals suggest that these were fed from pyroclastic eruptions. This lithofacies occurs in Unit V.
Polymictic, evolved lapilli-tuff and lapillistone
This lithofacies occurs as very thick (multimeter) relatively well sorted intervals with no internal stratification, composed of volcanic clasts of a variety of evolved types. These characteristics suggest deposition from high-concentration density currents, probably by mass wasting or resedimentation from one or more silicic volcanoes; alternatively, this facies could be products from pyroclastic eruptions that remobilized large volumes of lithic clasts. This lithofacies is most abundant in Units IV and VI.
Black glassy lapillistone and lapilli-tuff
This lithofacies occurs as one massive ~184 m thick deposit of nonvesicular glassy lapilli clasts, which together with the lack of bubble-wall shard or broken crystals indicates fragmentation by autobrecciation and quenching of lava in a submarine environment (i.e., hyaloclastite). The few nonglassy clasts in the deposit suggest minor accidental incorporation of clasts during transport, but most of the unit is monomictic and nonstratified, indicating minimal resedimentation. A lack of tuffaceous mudstone interbeds indicates rapid accumulation. This lithofacies forms the upper half of Unit VII.
Coarse-grained massive lapilli-tuff with in situ quench-fragmented blocks
This lithofacies consists of extremely thick intervals of nonstratified, very poorly sorted monomictic andesite lapilli-tuff with blocks, with intercalated stratified lithic lapilli-tuff and tuff. Clasts in the extremely thick nonstratified intervals are angular or have very irregular shapes, indicating very minimal transport. Many intervals contain blocks and coarse lapilli that are glassy and some have glassy rims and poorly inflated breadcrust textures/cauliflower texture, indicating that clasts came to rest at high temperatures. Other intervals have a small percentage of other clast types, suggesting at least some resedimentation. In some intervals, very angular, jigsaw-fit hyaloclasts (formed of quenched glass) indicate in situ mixing of hot clasts and/or intrusions with the host hyaloclastic tuff-breccia, all of the same andesitic composition. The lack of clasts with broken glassy rims indicates minimal resedimentation. Like the black glassy lapilli-tuff, a lack of tuffaceous mudstone interbeds indicates rapid accumulation, although these show more evidence of episodic deposition because they are intercalated with stratified lithic lapilli-tuff and tuff. This lithofacies forms the lower half of Unit VII.
Interpretation of depositional environment at Site U1437: deepwater basinal succession
As noted above, the section drilled at Site U1437 accumulated in a deepwater volcano-bounded basin between the Manji and Enpo seamount chains. In this section we argue that the section is best described as a deepwater basinal succession and that the term “volcaniclastic apron” is inappropriate.
Although some workers may incorrectly use the term volcaniclastic apron to loosely refer to any accumulation of sediment around a volcano or chain of volcanoes, the term has been used in a much more rigorous sense by sedimentologists over the past 40 y (Karig and Moore, 1975b; Sample and Karig, 1982; Carey and Sigurdsson, 1984; Farquharson et al., 1984; Fisher, 1984; Busby-Spera, 1985, 1988; Cas and Wright, 1987; Smith, 1987; White and Busby-Spera, 1987; Houghton and Landis, 1989; Palmer and Walton, 1990; Fisher and Smith, 1991; Fisher and Schmincke, 1994; Smith and Landis, 1995; Orton, 1996; Wright, 1996; Mitchell, 2000; Carey, 2000; Gamberi, 2001; Karátson and Németh, 2001; Allen et al., 2006; Casalbore et al., 2010; Carey and Schneider, 2011). In these papers, a volcaniclastic apron is defined as a thick accumulation of coarse volcanic debris that fringes a volcano or a chain of volcanoes and builds outward from them; volcaniclastic aprons are fan shaped or are composed of coalescing fans that form a wedge. They are steep in their proximal reaches, with abundant large lithic blocks and slumps, passing smoothly into medial to distal reaches that have gentler slopes, formed of debris flow and coarse-grained pyroclastic density current deposits. For example, the “volcanic apron” of Gran Canaria (Shipboard Scientific Party, 1995) is a volcaniclastic apron (Funck et al., 1996), consisting of volcano-flank seismically chaotic pillow breccia and hylaoclastite and poorly stratified debris flow deposits, which pass basinward into crudely stratified slump, debris flow, and turbidity current deposits. Volcaniclastic aprons form in both nonmarine and marine environments, and they commonly prograde into basins with time, producing an overall upward-coarsening sequence.
The upper 75% of the section drilled at Site U1437 (above Units VI and VII, 0–1320 mbsf) differs from volcaniclastic aprons in the following ways:
- It is mostly tuffaceous mudstone (~60% of the section as a whole) deposited from hemipelagic rain, dilute turbid flows, bottom currents, or some combination thereof; the section is not mainly composed of volcanic debris.
- The grain size of volcanic clasts in discrete volcaniclastic layers is much smaller than that reported from volcaniclastic aprons (20% ash and ~20% fine-grained lapilli, for the section as a whole).
- There is no geomorphic or seismic stratigraphic evidence for fan- or wedge-shaped sediment bodies or of chaotic facies; instead, the upper 75% of the section (above Units VI and VII) is extremely well stratified, consistent with its fine grained character.
- Little firm evidence for density current deposits exists in the upper 75% of the section, except for Unit II, which is thin; most of the volcaniclastics could represent suspension fallout.
- Volcanic blocks do not occur in the upper 75% of the section.
The lower 25% of the section drilled at Site U1437 (Units VI and VII, 1320–1806.5 mbsf) differs from volcaniclastic aprons in the following way: although this part of the section contains volcanic blocks, they (together with igneous Unit I) form near-vent deposits, with little to no evidence for resedimentation. Dominantly in situ volcaniclastic deposits cannot be referred to as a volcaniclastic apron.
The submarine fans and aprons of siliciclastic deepwater systems are relatively coarse grained constructional features, whereas the basin plain beyond is flat and fine grained with laterally continuous deposits (Reading and Richards, 1994; Stow et al., 1996; Richards, 2009). The upper 75% of the section drilled at Site U1437 is more analogous to the basin plain; it is a fine-grained, well-stratified sequence that is best referred to as a deepwater basinal succession, not a volcaniclastic apron. The lower 25% of the section, in contrast, contains near-vent, dominantly in situ deposits with geochemistry that differs from the upper 75% of the section; therefore, the lower 25% of the section represents localized vent-related deposits within the deepwater basinal succession (not a volcaniclastic apron).
Interpretation of event periodicity using volcaniclastics
Volcaniclastic beds within marine sediments have long attracted attention for their potential to provide a time-precise, high-resolution record of volcanic activity (e.g., Kennett and Thunell, 1975; Cambray and Cadet, 1994). In this section we present a preliminary assessment of volcanic event periodicity for the part of the section at Site U1437 that has good age control (Units I–III), which extends to 1097 mbsf and to 6.9 Ma (Figure F49). This is possible because combined Holes U1437B and U1437D cored a 1097 m thick section of tuffaceous mudstone with abundant centimeter- to decimeter-thick volcaniclastic beds with high recovery (average = 80% ± 23%). The excellent biostratigraphic and magnetostratigraphic data in these holes demonstrate that the volcaniclastic intervals represent a time series of instantaneous volcanic events that were preserved within rapidly accumulating tuffaceous mud that show no evidence for hiatuses (see Figure F25).
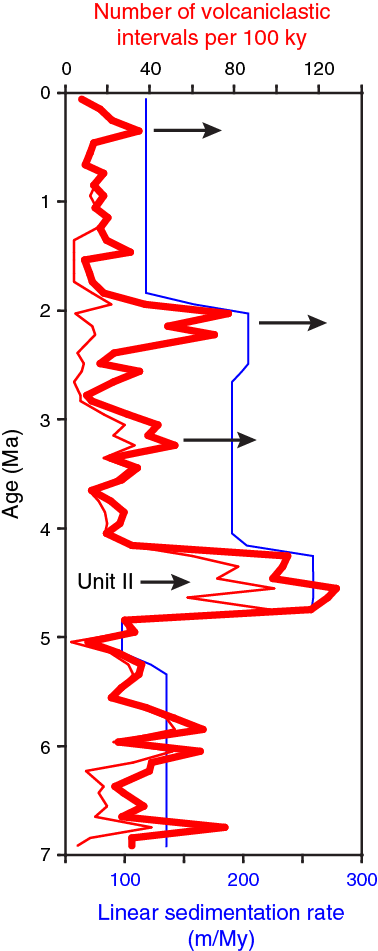
Figure F49. Event periodicity from tephras deposited in the past 6.9 My.
Each volcaniclastic bed >1 cm thick entered in DESClogik was considered to be a single volcanic event, and for each bed the thickness and depositional age were obtained using sedimentation rates calculated in the age model. Volcaniclastic bed abundances were calculated in time slices of 100 ky, and a linear correction for core recovery was applied to the number of beds per time interval; for example, if three volcaniclastic beds were recorded at 50% recovery, the corrected number of volcaniclastic beds would be six.
The corrected curve (Figure F49) shows a maximum for volcaniclastic beds at 4.3–4.7 Ma (lithostratigraphic Unit II) and two additional maxima at ~2.0–2.2 Ma and ~3.1–3.2 Ma; a minor peak lies at ~0.35 Ma. The 2.0–2.2 Ma abundance maximum coincides with the maximum in sedimentation rate at ~1.9–2.5 Ma (230–360 mbsf), which is consistent with the interpretation that high sedimentation rates are linked to high influx of volcaniclastic material. The age of the most pronounced maximum (4.3–4.7 Ma) is permissive of a source in the ~16–3 Ma rear-arc seamount chain, which is consistent with the relatively coarse grain size of Unit II (lapilli-tuff) relative to volcaniclastic intervals in Units I and III (mainly ash/tuff). The abundance maximum at ~2.0–2.2 Ma is clearly too young to represent rear-arc seamount chain volcanism.
Preliminary scientific assessment
Operations went perfectly smoothly for most of the expedition. On the way to the main objective Site U1437 in the Izu rear arc, we drilled for 1 day at Site U1436 (IBM-4GT) in the Izu fore arc. The goal of this effort was to drill a 150 m deep geotechnical test hole for potential future deep drilling (5500 mbsf) at proposed Site IBM-4 using the Chikyu. This goal was achieved. Furthermore, the core from this site was used to test and refine a new descriptive scheme for volcaniclastic rocks. Core from Site U1436 yielded a rich record of Late Pleistocene explosive volcanism, including a distinctive black glassy mafic ash layer that may record a large-volume eruption on the Izu arc front. The expedition then proceeded to the main objective site on the rear arc, Site U1437, where drilling went very well. Site U1437 had excellent core recovery in Holes U1437B (55%) and U1437D (74%), and we succeeded in hanging the longest casing in the history of JOIDES Resolution scientific drilling (1085.6 m) in Hole U1437E. Recovery declined and drilling slowed in the lower part of Hole U1437E, so it began to look unlikely that we would reach our very optimistic target depth of 2100 mbsf, although if drilling rate did not slow appreciably, we hoped to reach ~2000 mbsf. Unfortunately, after drilling to 1806.5 mbsf and pulling out of the hole for a routine bit change, the fiber optic cable on the reentry camera failed, so we were unable to reoccupy the hole for continued drilling; furthermore, Hole U1437E could not be logged. We decided to make use of the ~4 days left to us by returning to Site U1436 to drill three additional holes (Holes U1436B, U1436C, and U1436D), in an attempt to get better recovery of the black glassy mafic ash layer and enclosing sediments. This was highly successful.
The primary scientific objective for Site U1437 was to characterize “the missing half of the subduction factory.” Numerous ODP and Integrated Ocean Drilling Program sites had previously been drilled in the arc front to fore-arc region, but this was the first site to be drilled in the rear part of the Izu arc. Rocks collected by dredges from the surface of rear-arc volcanoes were shown to be different from arc-front rocks, and drilling in the “missing half” was proposed in order to fully characterize this asymmetry and determine if it developed early or late in the ~52 My history of the arc system. This is important for determining whether the asymmetry is an inherent feature of arcs, for making mass balance and flux calculations for crustal evolution, and for testing models of intracrustal evolution. Volcaniclastic rocks in the fore arc had previously been shown to provide a faithful record of arc evolution (e.g., Gill et al., 1994; Straub, 2003; Bryant et al., 2003), and recent improvements in microanalytical techniques (e.g., single crystal grains or glass fragments) make this approach more promising than ever. To this end, the expedition was highly successful. However, the temporal record might be shorter than expected, as discussed below.
The deposits drilled at Site U1437 were in general much finer grained than expected, making shipboard geochemical analysis more difficult; clasts were typically not large enough to be analyzed individually by ICP, except in lithostratigraphic Units VI and VII, so bulk analysis was required for most units. However, shore-based microanalytical techniques will overcome this problem. Alteration resulted in destruction of fresh glass from the top of Unit III downward (except for the black glassy lapilli-tuff in Unit VII), so shipboard geochemical interpretations below Unit II relied on immobile elements to infer types of magmas represented (e.g., rhyolite versus andesite versus basalt) and source types (e.g., arc front versus rear arc). Shore-based geochemical analysis will therefore need to rely more on minerals, which are less altered than the glass for most samples taken deeper than ~750 mbsf.
Site U1437 is unexpectedly dominated by intervals of tuffaceous mud; ~60% for the section as a whole and 89% in the thickest lithostratigraphic unit (Unit I, 433 m; Table T5); this obviously lessens the opportunities for studying the chemistry of volcanic clasts and grains. Furthermore, the volcaniclastic fraction of the section (40%) is relatively fine grained, composed half of ash/tuff and half of lapilli-tuff of generally fine grain size (clasts < 3 cm); volcanic blocks were only sparsely scattered through Units VI and VII, which in turn make up only ~20% of the recovered material. The fine grain size of the volcaniclastics makes it more likely that many of them provide a record of arc-front (rather than rear arc) volcanism and limits the scope for studying submarine volcanic eruption processes because most of the record is relatively distal. However, shore-based geochemical techniques are expected to allow better distinction of volcanic source areas than was possible shipboard. Additionally, future shore-based geochemical work will be aimed at understanding the provenance of the tuffaceous mud/mudstone, which accumulated at unusually high rates for such fine-grained material.
Due to compaction and alteration, the lowest biostratigraphic datum was ~850 mbsf and the lowest paleomagnetic datum was at ~1300 mbsf (~9 Ma). Both a nannofossil assemblage constraint and a preliminary U-Pb zircon date generated shortly after the expedition indicate an age range of ~11–15 Ma for the depth interval 1389–1403 mbsf. The section is much younger than predicted from seismic interpretation of relations between the basin fill and the bounding volcanoes. Lithostratigraphic Unit II forms a reflector that was interpreted to correlate with the Manji Volcano (dated at ~6.5 Ma), but that unit is only ~4.3 Ma (Figure F25). The Miocene/Oligocene boundary (~23 Ma) was inferred to lie at ~1250 mbsf, but strata at that depth are much younger (~8.5 Ma). Thus, the section dated so far provides a shorter temporal record than expected. The age of the lowest ~25% of the section (Units VI and VII) will not be conclusively known until shore-based radiometric dating of the volcaniclastic rocks is complete.
References
Allen, S.R., Hayward, B.W., and Mathews, E., 2006. A facies model for a submarine volcaniclastic apron: the Miocene Manukau Subgroup, New Zealand. Geological Society of America Bulletin, 119(5–6):725–742. http://dx.doi.org/10.1130/B26066.1
Arculus, R., Ishizuka, O., and Bogus, K.A., 2013. Izu-Bonin-Mariana arc origins: continental crust formation at intraoceanic arc: foundations, inceptions, and early evolution. International Ocean Discovery Program Scientific Prospectus, 351. http://dx.doi.org/10.2204/iodp.sp.351.2013
Baker, P.A., Gieskes, J.M., and Elderfield, H., 1982. Diagenesis of carbonates in deep-sea sediments: evidence from Sr/Ca ratios and interstitial dissolved Sr 2+ data. Journal of Sedimentary Research, 52(1):71–82. http://dx.doi.org/10.1306/212F7EE1-2B24-11D7-8648000102C1865D
Bandy, W.L., and Hilde, T.W.C., 1983. Structural features of the Bonin arc: implications for its tectonic history. Tectonophysics, 99(2–4):331–353. http://dx.doi.org/10.1016/0040-1951(83)90111-7
Bloomer, S.H., Taylor, B., MacLeod, C.J., Stern, R.J., Fryer, P., Hawkins, J.W., and Johnson, L., 1995. Early arc volcanism and the ophiolite problem: a perspective from drilling in the western Pacific. In Taylor, B., and Natland, J. (Eds.), Active Margins and Marginal Basins of the Western Pacific. Geophysical Monograph, 88:1–30. http://dx.doi.org/10.1029/GM088p0001
Brumsack, H.-J., and Zuleger, E., 1992. Boron and boron isotopes in pore waters from ODP Leg 127, Sea of Japan. Earth and Planetary Science Letters, 113(3):427–433. http://dx.doi.org/10.1016/0012-821X(92)90143-J
Bryant, C.J., Arculus, R.J., and Eggins, S.M., 2003. The geochemical evolution of the Izu-Bonin arc system: a perspective from tephras recovered by deep-sea drilling. Geochemistry, Geophysics, Geosystems, 4(11):1094. http://dx.doi.org/10.1029/2002GC000427
Busby-Spera, C.J., 1985. A sand-rich submarine fan in the lower Mesozoic Mineral King caldera complex, Sierra Nevada, California. Journal of Sedimentary Research, 55(3):376–391. http://dx.doi.org/10.1306/212F86D9-2B24-11D7-8648000102C1865D
Busby-Spera, C.J., 1988. Evolution of a middle Jurassic back-arc basin, Cedros Island, Baja California: evidence from a marine volcaniclastic apron. Geological Society of America Bulletin, 100(2):218–233. http://dx.doi.org/10.1130/0016-7606(1988)100<0218:EOAMJB>2.3.CO;2
Busby-Spera, C.J., and White, J.D.L., 1987. Variation in peperite textures associated with differing host-sediment properties. Bulletin of Volcanology, 49(6):765–776. http://dx.doi.org/10.1007/BF01079827
Cambray, H., and Cadet, J.P., 1994. Testing global synchronism in peri-Pacific arc volcanism. Journal of Volcanology and Geothermal Research, 63(3–4):145–164. http://dx.doi.org/10.1016/0377-0273(94)90071-X
Carey, S., 1997. Influence of convective sedimentation on the formation of widespread tephra fall layers in the deep sea. Geology, 25(9):839–842. http://dx.doi.org/10.1130/0091-7613(1997)025<0839:IOCSOT>2.3.CO;2
Carey, S., 2000. Volcaniclastic sedimentation around island arcs. In Sigurdsson, H., Houghton, B.F., McNutt, S.R., Rymer, H., and Stix, J. (Eds.), Encyclopedia of Volcanoes: San Diego (Academic Press), 627–642
Carey, S., and Sigurdsson, H., 1984. A model of volcanogenic sedimentation in marginal basins. In Kokelaar, B.P., and Howells, M.F. (Eds.), Marginal Basin Geology: Volcanic and Associated Sedimentary and Tectonic Processes in Modern and Ancient Marginal Basins. Geological Society Special Publication, 16(1):37–58. http://dx.doi.org/10.1144/GSL.SP.1984.016.01.04
Carey, S.N., and Schneider, J.-L., 2011. Volcaniclastic processes and deposits in the deep sea. In Hüneke, H., and Mulder, T. (Eds.), Developments in Sedimentology (Vol. 63): Deep-Sea Sediments: Oxford (Elsevier), 457–515. http://dx.doi.org/10.1016/B978-0-444-53000-4.00007-X
Cas, R.A.F., and Wright, J.V., 1987. Volcanic Successions, Modern and Ancient: a Geological Approach to Processes, Products and Successions: London (Allen and Unwin).
Casalbore, D., Romagnoli, C., Chiocci, F., and Frezza, V., 2010. Morpho-sedimentary characteristics of the volcaniclastic apron around Stromboli volcano (Italy). Marine Geology, 269(3–4):132–148. http://dx.doi.org/10.1016/j.margeo.2010.01.004
Chen, J., An, Z., Liu, L., Ji, J., Yang, J., and Chen, Y., 2001. Variations in chemical compositions of the eolian dust in Chinese Loess Plateau over the past 2.5 Ma and chemical weathering in the Asian inland. Science in China Series D: Earth Sciences, 44(5):403–413. http://dx.doi.org/10.1007/BF02909779
Cosca, M.A., Arculus, R.J., Pearce, J.A., and Mitchell, J.G., 1998. 40Ar/ 39Ar and K-Ar geochronological age constraints for the inception and early evolution of the Izu-Bonin-Mariana arc system. Island Arc, 7(3):579–595. http://dx.doi.org/10.1111/j.1440-1738.1998.00211.x
Dickinson, W.R., and Hatherton, T., 1967. Andesitic volcanism and seismicity around the Pacific. Science, 157(3790):801–803. http://dx.doi.org/10.1126/science.157.3790.801
Expedition 334 Scientists, 2012. Expedition 334 summary. In Vannucchi, P., Ujiie, K., Stroncik, N., Malinverno, A., and the Expedition 334 Scientists, Proceedings of the Integrated Ocean Drilling Program, 334: Tokyo (Integrated Ocean Drilling Program Management International, Inc.). http://dx.doi.org/10.2204/iodp.proc.334.101.2012
Farquharson, G.W., Hamer, R.D., and Ineson, J.R., 1984. Proximal volcaniclastic sedimentation in a Cretaceous back-arc apron, northern Antarctic Peninsula. In Kokelaar, B.P., and Howells, M.F. (Eds.), Marginal Basin Geology: Volcanic and Associated Sedimentary and Tectonic Processes in Modern and Ancient Marginal Basins. Geological Society Special Publication, 16:219–229. http://dx.doi.org/10.1144/GSL.SP.1984.016.01.17
Fisher, R.V., 1961. Proposed classification of volcaniclastic sediments and rocks. Geological Society of America Bulletin, 72(9):1409–1414. http://dx.doi.org/10.1130/0016-7606(1961)72[1409:PCOVSA]2.0.CO;2
Fisher, R.V., 1984. Submarine volcaniclastic rocks. In Kokelaar, B.P., and Howells, M.F. (Eds.), Marginal Basin Geology: Volcanic and Associated Sedimentary Processes in Modern and Ancient Basins. Geological Society Special Publication, 16:5–27. http://dx.doi.org/10.1144/GSL.SP.1984.016.01.02
Fisher, R.V., and Schmincke, H.-U., 1984. Pyroclastic Rocks: Berlin (Springer-Verlag). http://dx.doi.org/10.1007/978-3-642-74864-6
Fisher, R.V., and Schmincke, H.-U., 1994. Volcaniclastic sediment transport and deposition. In Pye, K. (Ed.), Sediment Transport and Depositional Processes: Oxford, UK (Blackwell Scientific Publishing), 351–388.
Fisher, R.V., and Smith, G.A., 1991. Volcanism, tectonics and sedimentation. In Fisher, R.V., and Smith, G.A. (Eds.), Sedimentation in Volcanic Settings. Special Publication—SEPM (Society for Sedimentary Geology), 45:1–5. http://dx.doi.org/10.2110/pec.91.45.0001
Funck, T., Dickmann, T., Rihm, R., Krastel, S., Lykke-Andersen, H., and Schmincke, H.-U., 1996. Reflection seismic investigations in the volcaniclastic apron of Gran Canaria and implications for its volcanic evolution. Geophysical Journal International, 125(2):519–536. http://dx.doi.org/10.1111/j.1365-246X.1996.tb00015.x
Gamberi, F., 2001. Volcanic facies associations in a modern volcaniclastic apron (Lipari and Vulcano offshore, Aeolian Island arc). Bulletin of Volcanology, 63(4):264–273. http://dx.doi.org/10.1007/s004450100143
Gill, J.B., 1981. Minerals and Rocks (Vol. 16): Orogenic Andesites and Plate Tectonics: Berlin (Springer-Verlag).
http://dx.doi.org/10.1007/978-3-642-68012-0
Gill, J.B., Hiscott, R.N., and Vidal, P., 1994. Turbidite geochemistry and evolution of the Izu-Bonin arc and continents. Lithos, 33(1–3):135–168. http://dx.doi.org/10.1016/0024-4937(94)90058-2
Harris, R.N., Sakaguchi, A., Petronotis, K., Baxter, A.T., Berg, R., Burkett, A., Charpentier, D., Choi, J., Diz Ferreiro, P., Hamahashi, M., Hashimoto, Y., Heydolph, K., Jovane, L., Kastner, M., Kurz, W., Kutterolf, S.O., Li, Y., Malinverno, A., Martin, K.M., Millan, C., Nascimento, D.B., Saito, S., Sandoval Gutierrez, M.I., Screaton, E.J., Smith-Duque, C.E., Solomon, E.A., Straub, S.M., Tanikawa, W., Torres, M.E., Uchimura, H., Vannucchi, P., Yamamoto, Y., Yan, Q., and Zhao, X., 2013. Expedition 344 summary. In Harris, R.N., Sakaguchi, A., Petronotis, K., and the Expedition 344 Scientists, Proceedings of the Integrated Ocean Drilling Program, 344: College Station, TX (Integrated Ocean Drilling Program). http://dx.doi.org/10.2204/iodp.proc.344.101.2013
Hein, J.R., O’Neil, J.R., and Jones, M.G., 1979. Origin of authigenic carbonates in sediment from the deep Bering Sea. Sedimentology, 26(5):681–705. http://dx.doi.org/10.1111/j.1365-3091.1979.tb00937.x
Hochstaedter, A., Gill, J., Peters, R., Broughton, P., Holden, P., and Taylor, B., 2001. Across-arc geochemical trends in the Izu-Bonin arc: contributions from the subducting slab. Geochemistry, Geophysics, Geosystems, 2(7):1019. http://dx.doi.org/10.1029/2000GC000105
Hochstaedter, A.G., Gill, J.B., Kusakabe, M., Newman, S., Pringle, M., Taylor, B., and Fryer, P., 1990a. Volcanism in the Sumisu Rift, I. Major element, volatile, and stable isotope geochemistry. Earth and Planetary Science Letters, 100(1–3):179–194. http://dx.doi.org/10.1016/0012-821X(90)90184-Y
Hochstaedter, A.G., Gill, J.B., and Morris, J.D., 1990b. Volcanism in the Sumisu Rift, II. Subduction and non-subduction related components. Earth and Planetary Science Letters, 100(1–3):195–209. http://dx.doi.org/10.1016/0012-821X(90)90185-Z
Hochstaedter, A.G., Gill, J.B., Taylor, B., Ishizuka, O., Yuasa, M., and Morita, S., 2000. Across-arc geochemical trends in the Izu-Bonin arc: constraints on source composition and mantle melting. Journal of Geophysical Research: Solid Earth, 105(B1):495–512. http://dx.doi.org/10.1029/1999JB900125
Houghton, B.F., and Landis, C.A., 1989. Sedimentation and volcanism in a Permian arc-related basin, southern New Zealand. Bulletin of Volcanology, 51(6):433–450. http://dx.doi.org/10.1007/BF01078810
Ingram, R.L., 1954. Terminology for the thickness of stratification and parting units in sedimentary rocks. Geological Society of America Bulletin, 65(9):937–938. http://dx.doi.org/10.1130/0016-7606(1954)65[937:TFTTOS]2.0.CO;2
Ishizuka, O., Kimura, J.-I., Li, Y.B., Stern, R.J., Reagan, M.K., Taylor, R.N., Ohara, Y., Bloomer, S.H., Ishii, T., Hargrove, U.S., III, and Haraguchi, S., 2006a. Early stages in the evolution of Izu-Bonin arc volcanism: new age, chemical, and isotopic constraints. Earth and Planetary Science Letters, 250(1–2):385–401. http://dx.doi.org/10.1016/j.epsl.2006.08.007
Ishizuka, O., Taylor, R.N., Milton, J.A., and Nesbitt, R.W., 2003a. Fluid-mantle interaction in an intraoceanic arc: constraints from high-precision Pb isotopes. Earth and Planetary Science Letters, 211(3–4):221–236. http://dx.doi.org/10.1016/S0012-821X(03)00201-2
Ishizuka, O., Taylor, R.N., Milton, J.A., Nesbitt, R.W., Yuasa, M., and Sakamoto, I., 2006b. Variation in the mantle sources of the northern Izu arc with time and space—constraints from high-precision Pb isotopes. Journal of Volcanology and Geothermal Research, 156(3–4):266–290. http://dx.doi.org/10.1016/j.jvolgeores.2006.03.005
Ishizuka, O., Taylor, R.N., Yuasa, M., and Ohara, Y., 2011. Making and breaking an island arc: a new perspective from the Oligocene Kyushu-Palau arc, Philippine Sea. Geochemistry, Geophysics, Geosystems, 12(5):Q05005. http://dx.doi.org/10.1029/2010GC003440
Ishizuka, O., Uto, K., and Yuasa, M., 2003b. Volcanic history of the back-arc region of the Izu-Bonin (Ogasawara) arc. In Larter, R.D., and Leat, P.T. (Eds.), Tectonic and Magmatic Processes. Geological Society Special Publication, 219(1):187–205. http://dx.doi.org/10.1144/GSL.SP.2003.219.01.09
Ishizuka, O., Uto, K., Yuasa, M., and Hochstaedter, A.G., 1998. K-Ar ages from seamount chains in the back-arc region of the Izu-Ogasawara arc. Island Arc, 7(3):408–421. http://dx.doi.org/10.1111/j.1440-1738.1998.00199.x
Ishizuka, O., Yuasa, M., and Uto, K., 2002. Evidence of porphyry copper-type hydrothermal activity from a submerged remnant back-arc volcano of the Izu-Bonin arc: implications for the volcanotectonic history of back-arc seamounts. Earth and Planetary Science Letters, 198(3–4):381–399. http://dx.doi.org/10.1016/S0012-821X(02)00515-0
Jordan, E.K., Lieu, W., Stern, R.J., Carr, M.J., Feigenson, M.D., and Gill, J.B., 2012. Data from: CentAm & IBM Geochem Database version 1.02. Integrated Earth Data Applications. http://dx.doi.org/10.1594/IEDA/100053
Karátson, D., and Németh, K., 2001. Lithofacies associations of an emerging volcaniclastic apron in a Miocene volcanic complex: an example from the Börzsöny Mountains, Hungary. International Journal of Earth Sciences, 90(4):776–794. http://dx.doi.org/10.1007/s005310100193
Karig, D.E., and Moore, G.F., 1975a. Tectonic complexities in the Bonin arc system. Tectonophysics, 27(2):97–118. http://dx.doi.org/10.1016/0040-1951(75)90101-8
Karig, D.E., and Moore, G.F., 1975b. Tectonically controlled sedimentation in marginal basins. Earth and Planetary Science Letters, 26(2):233–238. http://dx.doi.org/10.1016/0012-821X(75)90090-4
Kennett, J.P., and Thunell, R.C., 1975. Global increase in Quaternary explosive volcanism. Science, 187(4176):497–502. http://dx.doi.org/10.1126/science.187.4176.497
Kodaira, S., Sato, T., Takahashi, N., Ito, A., Tamura, Y., Tatsumi, Y., and Kaneda, Y., 2007a. Seismological evidence for variable growth of crust along the Izu intraoceanic arc. Journal of Geophysical Research: Solid Earth, 112(B5):B05104. http://dx.doi.org/10.1029/2006JB004593
Kodaira, S., Sato, T., Takahashi, N., Miura, S., Tamura, Y., Tatsumi, Y., and Kaneda, Y., 2007b. New seismological constraints on growth of continental crust in the Izu-Bonin intra-oceanic arc. Geology, 35(11):1031–1034. http://dx.doi.org/10.1130/G23901A.1
Kodaira, S., Sato, T., Takahashi, N., Yamashita, M., No, T., and Kaneda, Y., 2008. Seismic imaging of a possible paleoarc in the Izu-Bonin intraoceanic arc and its implications for arc evolution processes. Geochemistry, Geophysics, Geosystems, 9(10):Q10X01. http://dx.doi.org/10.1029/2008GC002073
Kuno, H., 1959. Origin of Cenozoic petrographic provinces of Japan and surrounding areas. Bulletin of Volcanology, 20(1):37–76. http://dx.doi.org/10.1007/BF02596571
Littke, R., Fourtanier, E., Thurow, J., and Taylor, E., 1991. Silica diagenesis and its effects on lithification of Broken Ridge deposits, central Indian Ocean. In Weissel, J., Peirce, J., Taylor, E., Alt, J., et al., Proceedings of the Ocean Drilling Program, Scientific Results, 121: College Station, TX (Ocean Drilling Program), 261–272. http://dx.doi.org/10.2973/odp.proc.sr.121.179.1991
Machida, S., and Ishii, T., 2003. Backarc volcanism along the en echelon seamounts: the Enpo Seamount chain in the northern Izu-Ogasawara arc. Geochemistry, Geophysics, Geosystems, 4(8):9006. http://dx.doi.org/10.1029/2003GC000554
Machida, S., Ishii, T., Kimura, J.-I., Awaji, S., and Kato, Y., 2008. Petrology and geochemistry of cross-chains in the Izu-Bonin back arc: three mantle components with contributions of hydrous liquids from a deeply subducted slab. Geochemistry, Geophysics, Geosystems, 9(5):Q05002. http://dx.doi.org/10.1029/2007GC001641
Mahood, G.A., and Halliday, A.N., 1988. Generation of high-silica rhyolite: a Nd, Sr, and O isotopic study of Sierra La Primavera, Mexican Neovolcanic Belt. Contributions to Mineralogy and Petrology, 100(2):183–191. http://dx.doi.org/10.1007/BF00373584
Manville, V., and Wilson, C.J.N., 2004. Vertical density currents: a review of their potential role in the deposition and interpretation of deep-sea ash layers. Journal of the Geological Society, 161(6):947–958. http://dx.doi.org/10.1144/0016-764903-067
McPhie, J., Doyle, M., and Allen, R., 1993. Volcanic Textures: A Guide to the Interpretation of Textures in Volcanic Rocks: Hobart (Tasmanian Government Printing Office).
Meyers, P.A., 1994. Preservation of elemental and isotopic source identification of sedimentary organic matter. Chemical Geology, 114(3–4):289–302. http://dx.doi.org/10.1016/0009-2541(94)90059-0
Mitchell, S.F., 2000. Facies analysis of a Cretaceous–Paleocene volcaniclastic braid-delta. [presented at the Geological Society of Trinidad and Tobago 2000 SPE Conference and Exhibition, Port of Spain, Trinidad, 10–13 July 2000]. (Paper SS03) http://archives.datapages.com/data/gstt/SS03F.PDF
Morse, J.W., and Mackenzie, F.T., 1990. Geochemistry of Sedimentary Carbonates: Amsterdam (Elsevier).
http://dx.doi.org/10.1016/S0070-4571(08)70329-7
Müller, P.J., 1977. C/N ratios in Pacific deep-sea sediments: effect of inorganic ammonium and organic nitrogen compounds sorbed by clays. Geochimica et Cosmochimica Acta, 41(6):765–776. http://dx.doi.org/10.1016/0016-7037(77)90047-3
Orton, G.J., 1996. Volcanic environments. In Reading, H.G. (Ed.), Sedimentary Environments: Processes, Facies and Stratigraphy: Oxford, UK (Blackwell Science Publishing), 485–573.
Palmer, B.A., and Walton, A.W., 1990. Accumulation of volcaniclastic aprons in the Mount Dutton Formation (Oligocene–Miocene), Marysvale volcanic field, Utah. Geological Society of America Bulletin, 102(6):734–748. http://dx.doi.org/10.1130/0016-7606(1990)102<0734:AOVAIT>2.3.CO;2
Pearce, J.A., Reagan, M.K., Stern, R.J., and Petronotis, K., 2013. Izu-Bonin-Mariana fore arc: testing subduction initiation and ophiolite models by drilling the outer Izu-Bonin-Mariana fore arc. International Ocean Drilling Program Scientific Prospectus, 352. http://dx.doi.org/10.14379/iodp.sp.352.2013
Plank, T., 2014. The chemical composition of subducting sediments. In Rudnick, R.L. (Ed.), Treatise on Geochemistry (2nd ed.) (Vol. 4): The Crust. Holland, H.D., and Turekian, K.K. (Series Eds.): Oxford (Elsevier), 607–629. http://dx.doi.org/10.1016/B978-0-08-095975-7.00319-3
Plank, T., and Langmuir, C.H., 1998. The chemical composition of subducting sediment and its consequences for the crust and mantle. Chemical Geology, 145(3–4):325–394. http://dx.doi.org/10.1016/S0009-2541(97)00150-2
Reading, H.G., and Richards, M., 1994. Turbidite systems in deep-water basin margins classified by grain size and feeder system. AAPG Bulletin, 78(5):792–822. http://aapgbull.geoscienceworld.org/cgi/content/abstract/78/5/792
Reagan, M.K., Ishizuka, O., Stern, R.J., Kelley, K.A., Ohara, Y., Blichert-Toft, J., Bloomer, S.H., Cash, J., Fryer, P., Hanan, B.B., Hickey-Vargas, R., Ishii, T., Kimura, J.-I., Peate, D.W., Rowe, M.C., and Woods, M., 2010. Fore-arc basalts and subduction initiation in the Izu-Bonin-Mariana system. Geochemistry, Geophysics, Geosystems, 11(3):Q03X12. http://dx.doi.org/10.1029/2009GC002871
Richards, M.T., 2009. Deep-marine clastic systems. In Emery, D., and Myers, K. (Eds.), Sequence Stratigraphy: London (Blackwell Science Publishing), 178–210. http://dx.doi.org/10.1002/9781444313710.ch9
Riedel, M., Collett, T.S., and Malone, M., 2010. Expedition 311 synthesis: scientific findings. In Riedel, M., Collett, T.S., Malone, M.J., and the Expedition 311 Scientists, Proceedings of the Integrated Ocean Drilling Program, Expedition, 311: Washington, DC (Integrated Ocean Drilling Program Management International, Inc.). http://dx.doi.org/10.2204/iodp.proc.311.213.2010
Rudnick, R.L., and Gao, S., 2004. Composition of the continental crust. Treatise on Geochemistry, 3:1–64.
http://dx.doi.org/10.1016/B0-08-043751-6/03016-4
Sample, J.C., and Karig, D.E., 1982. A volcanic production rate for the Mariana island arc. Journal of Volcanology and Geothermal Research, 13(1–2):73–82. http://dx.doi.org/10.1016/0377-0273(82)90020-8
Scudder, R.P., Murray, R.W., and Plank, T., 2009. Dispersed ash in deeply buried sediment from the northwest Pacific Ocean: an example from the Izu-Bonin arc (ODP Site 1149). Earth and Planetary Science Letters, 284(3–4):639–648. http://dx.doi.org/10.1016/j.epsl.2009.05.037
Shipboard Scientific Party, 1995. Background, objectives, and principal results of Madeira Abyssal Plain drilling. In Schmincke, H.-U., Weaver, P.P.E., Firth, J.V., et al., Proceedings of the Ocean Drilling Program, Initial Reports, 157: College Station, TX (Ocean Drilling Program), 5–10. http://dx.doi.org/10.2973/odp.proc.ir.157.101.1995
Smith, G.A., 1987. Sedimentology of volcanism-induced aggradation in fluvial basins: examples from the Pacific Northwest, U.S.A. In Ethridge, F.G., Flores, R.M., and Harvey, M.D. (Eds.), Recent Developments in Fluvial Sedimentology. Special Publication—SEPM (Society for Sedimentary Geology), 39:217–228. http://dx.doi.org/10.2110/pec.87.39.0217
Smith, G.A., and Landis, C., 1995. Intra-arc basins. In Busby, C.J., and Ingersoll, R.V. (Eds.), Tectonics of Sedimentary Basins: Oxford (Blackwell Science Publishing), 263–298.
Stern, R.J., Fouch, M.J., and Klemperer, S., 2003. An overview of the Izu-Bonin-Mariana subduction factory. In Eiler, J. (Ed.), Inside the Subduction Factory. Geophysical Monograph, 138:175–222. http://dx.doi.org/10.1029/138GM10
Stow, D.A.V., Reading, H.G., and Collinson, J.D., 1996. Deep seas. In Reading, H.G. (Ed.), Sedimentary Environments: Processes, Facies and Stratigraphy: Oxford, UK (Blackwell Science Publishing), 395–453.
Straub, S.M., 2003. The evolution of the Izu Bonin-Mariana volcanic arcs (NW Pacific) in terms of major elements. Geochemistry, Geophysics, Geosystems, 4(2):1018. http://dx.doi.org/10.1029/2002GC000357
Straub, S.M., Goldstein, S.L., Class, C., Schmidt, A., and Gomez-Tuena, A., 2010. Slab and mantle controls on the Sr–Nd–Pb–Hf isotope evolution of the post 42 Ma Izu–Bonin volcanic arc. Journal of Petrology, 51(5):993–1026. http://dx.doi.org/10.1093/petrology/egq009
Stroncik, N.A., and Schmincke, H.-U., 2002. Palagonite; a review. International Journal of Earth Sciences, 91(4):680–697. http://dx.doi.org/10.1007/s00531-001-0238-7
Suyehiro, K., Takahashi, N., Ariie, Y., Yokoi, Y., Hino, R., Shinohara, M., Kanazawa, T., Hirata, N., Tokuyama, H., and Taira, A., 1996. Continental crust, crustal underplating, and low-Q upper mantle beneath an oceanic island arc. Science, 272(5260):390–392. http://dx.doi.org/10.1126/science.272.5260.390
Tamura, Y., 1994. Genesis of island arc magmas by mantle-derived bimodal magmatism: evidence from the Shirahama Group, Japan. Journal of Petrology, 35(3):619–645.
http://dx.doi.org/10.1093/petrology/35.3.619
Tamura, Y., 1995. Liquid lines of descent of island arc magmas and genesis of rhyolites: evidence from the Shirahama Group, Japan. Journal of Petrology, 36(2):417–434. http://dx.doi.org/10.1093/petrology/36.2.417
Tamura, Y., Busby, C., and Blum, P., 2013. Izu-Bonin-Mariana Rear Arc: the missing half of the subduction factory. International Ocean Discovery Program Scientific Prospectus, 350. http://dx.doi.org/10.2204/iodp.sp.350.2013
Tamura, Y., Gill, J.B., Tollstrup, D., Kawabata, H., Shukuno, H., Chang, Q., Miyazaki, T., Takahashi, T., Hirahara, Y., Kodaira, S., Ishizuka, O., Suzuki, T., Kido, Y., Fiske, R.S., and Tatsumi, Y., 2009. Silicic magmas in the Izu-Bonin oceanic arc and implications for crustal evolution. Journal of Petrology, 50(4):685–723. http://dx.doi.org/10.1093/petrology/egp017
Tamura, Y., Ishizuka, O., Aoike, K., Kawate, S., Kawabata, H., Chang, Q., Saito, S., Tatsumi, Y., Arima, M., Takahashi, M., Kanamaru, T., Kodaira, S., and Fiske, R.S., 2010. Missing Oligocene crust of the Izu-Bonin arc: consumed or rejuvenated during collision? Journal of Petrology, 51(4):823–846. http://dx.doi.org/10.1093/petrology/egq002
Tamura, Y., and Nakamura, E., 1996. The arc lavas of the Shirahama Group, Japan: Sr and Nd isotopic data indicate mantle-derived bimodal magmatism. Journal of Petrology, 37(6):1307–1319. http://dx.doi.org/10.1093/petrology/37.6.1307
Tamura, Y., Tani, K., Chang, Q., Shukuno, H., Kawabata, H., Ishizuka, O., and Fiske, R.S., 2007. Wet and dry basalt magma evolution at Torishima Volcano, Izu-Bonin arc, Japan: the possible role of phengite in the downgoing slab. Journal of Petrology, 48(10):1999–2031. http://dx.doi.org/10.1093/petrology/egm048
Tamura, Y., Tani, K., Ishizuka, O., Chang, Q., Shukuno, H., and Fiske, R.S., 2005. Are arc basalts dry, wet, or both? Evidence from the Sumisu Caldera Volcano, Izu-Bonin arc, Japan. Journal of Petrology, 46(9):1769–1803. http://dx.doi.org/10.1093/petrology/egi033
Tamura, Y., and Tatsumi, Y., 2002. Remelting of an andesitic crust as a possible origin for rhyolitic magma in oceanic arcs: an example from the Izu-Bonin arc. Journal of Petrology, 43(6):1029–1047. http://dx.doi.org/10.1093/petrology/43.6.1029
Tamura, Y., Tatsumi, Y., Zhao, D., Kido, Y., and Shukuno, H., 2002. Hot fingers in the mantle wedge: new insights into magma genesis in subduction zones. Earth and Planetary Science Letters, 197(1–2):105–116. http://dx.doi.org/10.1016/S0012-821X(02)00465-X
Tani, K., Fiske, R.S., Dunkley, D.J., Ishizuka, O., Oikawa, T., Isobe, I., and Tatsumi, Y., 2011. The Izu Peninsula, Japan: zircon geochronology reveals a record of intra-oceanic rear-arc magmatism in an accreted block of Izu-Bonin upper crust. Earth and Planetary Science Letters, 303(3–4):225–239. http://dx.doi.org/10.1016/j.epsl.2010.12.052
Tatsumi, Y., and Stern, R.J., 2006. Manufacturing continental crust in the subduction factory. Oceanography, 19(4):104–112. http://dx.doi.org/10.5670/oceanog.2006.09
Taylor, B., 1992. Rifting and the volcanic-tectonic evolution of the Izu-Bonin-Mariana arc. In Taylor, B., Fujioka, K., et al., Proceedings of the Ocean Drilling Program, Scientific Results, 126: College Station, TX (Ocean Drilling Program), 627–651. http://dx.doi.org/10.2973/odp.proc.sr.126.163.1992
Taylor, B., Fujioka, K., et al., 1990. Proceedings of the Ocean Drilling Program, Initial Reports, 126: College Station, TX (Ocean Drilling Program). http://dx.doi.org/10.2973/odp.proc.ir.126.1990
Taylor, R.N., and Nesbitt, R.W., 1998. Isotopic characteristics of subduction fluids in an intra-oceanic setting, Izu-Bonin arc, Japan. Earth and Planetary Science Letters, 164(1–2):79–98. http://dx.doi.org/10.1016/S0012-821X(98)00182-4
Tollstrup, D., Gill, J., Kent, A., Prinkey, D., Williams, R., Tamura, Y., and Ishizuka, O., 2010. Across-arc geochemical trends in the Izu-Bonin arc: contributions from the subducting slab, revisited. Geochemistry, Geophysics, Geosystems, 11(1):Q01X10. http://dx.doi.org/10.1029/2009GC002847
Wentworth, C.K., 1922. A scale of grade and class terms for clastic sediments. Journal of Geology, 30(5):377–392. http://dx.doi.org/10.1086/622910
White, J.D.L., and Busby-Spera, C.J., 1987. Deep marine arc apron deposits and syndepositional magmatism in the Alisitos group at Punta Cono, Baja California, Mexico. Sedimentology, 34(5):911–927. http://dx.doi.org/10.1111/j.1365-3091.1987.tb00812.x
White, J.D.L., and Houghton, B.F., 2006. Primary volcaniclastic rocks. Geology 34(8):677–680. http://dx.doi.org/10.1130/G22346.1
Wright, I.C., 1996. Volcaniclastic processes on modern submarine arc stratovolcanoes: sidescan and photographic evidence from Rumble IV and V volcanoes, southern Kermadec arc (SW Pacific). Marine Geology, 136(1–2):21–39. http://dx.doi.org/10.1016/S0025-3227(96)00054-0
Yamazaki, T., and Stern, R.J., 1997. Topography and magnetic vector anomalies in the Mariana Trough. JAMSTEC Deep Sea Research, 13:31–45.
Yamazaki, T., and Yuasa, M., 1998. Possible Miocene rifting of the Izu–Ogasawara (Bonin) arc deduced from magnetic anomalies. Island Arc, 7(3):374–382. http://dx.doi.org/10.1111/j.1440-1738.1998.00196.x
Yuasa, M., and Kano, K., 2003. Submarine silicic calderas on the northern Shichito-Iwojima Ridge, Izu-Ogasawara (Bonin) arc, western Pacific. In White, J.D.L., Smellie, J.L., and Clague, D.A. (Eds.), Explosive Subaqueous Volcanism. Geophysical Monograph, 140:231–243. http://dx.doi.org/10.1029/140GM15
1Tamura, Y., Busby, C.J., Blum, P., Guèrin, G., Andrews, G.D.M., Barker, A.K., Berger, J.L.R., Bongiolo, E.M., Bordiga, M., DeBari, S.M., Gill, J.B., Hamelin, C., Jia, J., John, E.H., Jonas, A.-S., Jutzeler, M., Kars, M.A.C., Kita, Z.A., Konrad, K., Mahony, S.H., Martini, M., Miyazaki, T., Musgrave, R.J., Nascimento, D.B., Nichols, A.R.L., Ribeiro, J.M., Sato, T., Schindlbeck, J.C., Schmitt, A.K., Straub, S.M., Vautravers, M.J., and Yang, Y., 2015. Expedition 350 summary. In Tamura, Y., Busby, C.J., Blum, P., and the Expedition 350 Scientists, Proceedings of the International Ocean Discovery Program, Expedition 350: Izu-Bonin-Mariana Rear Arc: College Station, TX (International Ocean Discovery Program). http://dx.doi.org/10.14379/iodp.proc.350.101.2015
2Expedition 350 Scientists’ addresses.
Figure F1. A. Tectonic setting of IBM arc (from Taylor, 1992; Tamura and Tatsumi, 2002). The IBM arc-trench system forms the convergent margin between the Pacific and Philippine Sea plates. Double lines indicate spreading centers active in the Mariana Trough and relict in the Shikoku and Parece Vela Basins. Izu-Bonin, West Mariana, and Mariana arcs are outlined by the 3 km bathymetric contour, and other basins and ridges are outlined by the 4 km contour. Box shows area of B. B. Map of the 16 Quaternary volcanoes on the arc front (from Tamura et al., 2009), showing Expedition 350 site positions (Site U1436 in fore arc and Site U1437 in rear arc) and previous ODP site locations. Dotted line along arc front indicates locations of 103 ocean-bottom seismometers, deployed at ~5 km intervals (Kodaira et al., 2007a, 2007b); for profile see Figure F5.
Figure F2. Evolution of IBM arc and adjacent Philippine Sea (from Ishizuka et al., 2011). A. ~40–35 Ma arc rocks are shown as the Eocene arc and the Kyushu-Palau arc. Also shown: Cretaceous crust in the north and seafloor spreading (West Philippine Basin) and mantle plume magmatism (Oki-Daito) in the south. B. 35–25 Ma: arc magmatism continues along the front and rear of the Kyushu-Palau arc, whereas seafloor spreading in the West Philippine Basin wanes, and Oki-Daito plume influence extends to the southern part of the Kyushu-Palau arc. C. Kyushu-Palau arc is rifted penecontemporaneously along its length, and seafloor spreading begins in the Shikoku and Parece Vela Basins by ~25 Ma, separating the rear arc from the arc front and producing the Kyushu-Palau Ridge remnant arc. D. ~22–17 Ma: spreading of Shikoku and Parece Vela Basins. E. 17–6 Ma: Neogene IBM arc front roughly coincides with the Paleogene arc front with the active rear arc behind it.
Figure F3. Bathymetric features of the eastern Philippine Sea, IBM arc system, and Expedition 350 (Site U1436 in fore arc and Site U1437 in rear arc) and 351 and 352 site locations. Dashed lines = wide-angle seismic profiles; the north–south seismic profiles (along the present-day arc front and rear arc ~150 km west of the arc front) are shown in Figure F5. Lines of circles = conspicuous north–south rows of long-wavelength magnetic anomalies, attributed to loci of Oligocene magmatic centers by Yamazaki and Yuasa (1998). Site U1436 is on the fore-arc anomaly (fore-arc high/Shin-Kurose Ridge); Site U1437 is on the rear-arc anomaly (Nishi-shichito Ridge).
Figure F4. Locations of wide-angle seismic profiles along the Izu rear arc (red line) 150 km west of the present-day arc front (profile shown in Figure F5) and the Izu arc front (black line) (Kodaira et al., 2007b; also shown in Figure F5). A–E = rear-arc segments with thick middle crust matched to arc-front segments. Kodaira et al. (2008) interpret the Nishi-shichito Ridge in the rear arc as a paleoarc that was obliquely rifted off of the arc front, with an extension direction parallel to the Sofugan Tectonic Line (SFG-TL), which forms the tectonic boundary between the Izu and Bonin arcs (Figure F3). Images from Kodaira et al. (2008). Hcj = Hachijojima, Ags = Aogashima, Sms = South Sumisu, Tsm = Torishima, Tnp = Tempo Seamount, Omc = Omachi Seamount.
Figure F5. Wide-angle seismic profiles (Kodaira et al., 2008) showing middle-crust thickness variations beneath the arc front and along the rear-arc Nishi-shichito Ridge. Based on these profiles, it is inferred that rear-arc crust was obliquely rifted off the arc front (Figure F4), probably during the opening of the Shikoku and Parece Vela Basins (~25 Ma; Figure F2C). The 6.0–6.8, 7.1–7.3, and 7.8 km/s layers correspond to middle crust, lower crust, and upper mantle, respectively. Quaternary basalt-dominant island volcanoes on the arc front: Mi = Miyakejima, Ha = Hachijojima, Ao = Aogashima, Su = Sumisu Caldera, To = Torishima; andesite Oligocene volcano east of arc front: Om = Omachi Seamount. ODP Sites 787, 792, and 793 also shown.
Figure F6. Volcano-tectonic domains within Izu arc. The well-defined arc front is formed by a chain of island volcanoes, the largest of which are named here. Arc crust underlies the rear arc, whereas the Shikoku Basin, which forms the western boundary of the rear arc, is floored by oceanic crust. The rear arc is divided three into tectonic zones, from west to east (also oldest to youngest): (1) rear-arc seamount chains (~100 km long; ~17–3 Ma), which span the compositional range from basalt to rhyolite (Figure F12A); (2) extensional zone (~100 km wide; <3 Ma) overlapping the eastern half of the rear-arc seamount chains and characterized by ~north–south normal faults with small bimodal volcanoes (back-arc knolls); and (3) active rift, a comparatively narrow extensional zone that consists of a series of north–south rift basins immediately behind the arc front, which also with bimodal volcanism. Magmatism in the active rifts and extensional zone is referred to as rift-type magmas and in the rear-arc seamount chains as rear-arc seamount chain–type magmas. White stars = Site U1436 (fore arc) and Site U1437 (rear arc). Box = area of Figure F23.
Figure F7. A. Time-migrated MCS Section IBM4-EW5 E–W profile through proposed Site IBM-4 (M. Yamashita, pers. comm., 2014). In order to better image the intracrustal structure and to precisely define the upper/middle crust boundary beneath Site IBM-4, seismic experiments were conducted in 2008 using the JAMSTEC’s R/V Kairei (KR08-09) to deploy a wide-angle OBS array with 1 km intervals. iso-VP contours of 5 and 6 km/s are inferred to represent upper crust and middle crust, respectively. B. Lithostratigraphic Units I–VI from ODP Site 792 (Taylor, Fujioka, et al., 1990) and inferred intracrustal structure deeper than 886 mbsf. Section drilled at Site U1436 shown.
Figure F8. Periodic variation in average crustal thickness (wavelength ~ 80–100 km) (modified from Tamura et al., 2009). A. Dotted line = along-arc crustal structure (thickness of middle crust with VP = 6.0–6.8 km/s at 5–20 km depths) and solid squares = average SiO2 content of volcanic rocks sampled and dredged from the 16 Izu arc Quaternary volcanoes (Figure F1B). The basalt-dominant island volcanoes also produced small volumes of rhyolites referred to as R1 by Tamura et al. (2009). Rhyolite-dominant submarine volcanoes erupted mostly rhyolite that is compositionally distinct from R1, referred to as R2 by Tamura et al. (2009). B. Schematic crustal structure of the Izu arc front showing basalt-dominant island volcanoes and rhyolite-dominant submarine calderas of South Hachijo, Myojin Knoll, and Myojinsho, which are underlain by thick and thin middle crust and erupted R1 and R2 rhyolite, respectively.
Figure F9. Sr, Nd, and Pb isotopic compositions for basalt- and rhyolite-dominated volcanoes along the Izu arc front (modified from Tamura et al., 2007, 2009, and data sources cited therein: Taylor and Nesbitt, 1998; Ishizuka et al., 2003a, 2003b; Tamura et al., 2005, 2007). Volcano location from Figure F1B.
Figure F10. Wide-angle seismic profile across Izu arc with P-wave velocities for upper, middle, and lower crust (greens) and for mantle (blues) (Suyehiro et al., 1996). ODP (black) and IODP (red) sites are projected onto this line of section. Site U1437 is the first site drilled in the broad region of long-lived rear-arc seamount chains (shown on Figure F4). ODP Site 791 is also in the rear arc, but it is located in the narrow, young, and active Sumisu rift (see Figure F4). Site U1436 and ODP Sites 792, 793, and 786 are in the modern fore arc. BON = boninite, FAB = fore-arc basalt.
Figure F11. Hot fingers hypothesis of Tamura et al. (2002) proposed for northeast Japan and adapted here for the origin of Izu rear-arc seamount chains. Hypothetically, mantle convection above the subducting slab produces fingerlike hot regions in the mantle wedge below the rear-arc plate. These hot regions extend toward the arc front with time, suggesting younging of rear-arc seamounts from west to east.
Figure F12. A. K2O vs. SiO2 of Izu arc front lava compared to those of the rear-arc seamount chains. Average continental crust from Rudnick and Gao (2004). B. Chondrite-normalized REE abundances of Izu arc-front lava compared with those of the rear-arc seamount chain. In both A and B, rear-arc seamount chain patterns are similar to average continental crust. Figure modified from Tamura et al. (2007 and references therein).
Figure F13. End-member hypotheses for the evolution of Izu arc crust, which resulted in the Neogene Izu arc being asymmetric in its geochemical characteristics: from the beginning and from the middle. Red = crust rich in fluid-mobile recycled slab components and strongly depleted in mantle-derived fluid-immobile elements typical of the modern arc front; blue = crust created where diminished slab signature and lower degrees of mantle melting produced crust enriched in mantle-derived fluid-immobile elements typical of the rear-arc seamount chains; “blue” crustal rocks are more similar to average continental crust than “red” arc front magmas (Figure F12). In the “from the beginning” hypothesis, the geochemical asymmetry has always existed; in the “from the middle” hypothesis, the asymmetry developed over time. Each model has implications for the mechanisms involved in generation of arc magmas and of continental crust.
Figure F14. Two main basin types recognized within arcs, as defined by Smith and Landis (1995). A. Volcano-bounded basin: small, irregular basins between individual volcanoes; larger linear troughs between volcanic chains; and thick basin fill preserved only in oceanic arcs, below sea level. Low areas between the series of rear-arc seamount chains shown on Figure F11 are volcano-bounded basins formed during growth of the chains between ~17 and 3 Ma. Site U1437 is located in one of these volcano-bounded basins, which we refer to as the Enpo-Manji Basin (Figure F15A). B. Fault-bounded basin: rapidly subsiding basins that are deep (up to 10 km) and have very high sediment accumulation rates (~1 km/My); they are found in continental and oceanic arcs. A fault-bounded basin is currently forming in the <1.5 Ma active rift west of the Izu arc front (Figure F6). Although the broader zone of extension (<3 Ma) produced faults within the eastern halfs of the volcano-bounded basins between the rear-arc seamount chains, including the basin drilling at Site U1437 (some visible on Figure F15B), the bounding volcanic chains and not the <3 Ma extensional zone faults primarily controlled accommodation (Figure F15A).
Figure F15. Seismic lines with interpreted seismic layers (M. Yamashita, pers. comm., 2014) running (top) transverse to the Enpo-Manji volcano-bounded basin and (bottom) along the axis of the basin; positions of lines shown in Figure F23C. A. The Manji volcano is northwest with 40Ar/39Ar ages of 6.86 and 6.53 Ma and an unnamed southeast volcano has a 40Ar/39Ar age of 1.96 Ma (see Figure F23B). B. An unnamed southwest volcano with an 40Ar/39Ar age of 12.35 Ma; minor north-northwest faults lie transverse to the volcano-bounded basin, parallel to normal faults in the broad extensional zone to the east (Figure F6). The north-northwest faults appear to have been active prior to the deposition of Layer L3 but do not provide the primary accommodation, which is a large linear trough in the low area between the Manji and Enpo seamount chains (Figure F23A) (i.e., a volcano-bounded basin; see Figure F14).
Figure F16. New sedimentary and volcaniclastic lithology naming conventions based on relative abundances of grain and clast types. Principal lithology names are compulsory for all intervals. Prefixes are optional except for “tuffaceous” lithologies. Suffixes are optional and can be combined with any combination of prefix/principal name. First-order division is based on abundance of volcanic-derived grains and clasts: >25% volcanic grains is either “volcanic” (>75% volcanic grains; named from grain size classification of Fisher and Schmincke, 1984 [orange]) or “tuffaceous” (25%–75% volcanic grains). Tuffaceous lithologies: if dominant nonvolcanic grain component is siliciclastic, the grain size classification of Wentworth (1922; green) is used; if not siliciclastic, it is named by the dominant type of carbonate, chemical, or biogenic grain (blue). 0%–25% volcanic grains are classified as nonvolcanic and treated similarly to tuffaceous lithologies: when nonvolcanic siliciclastic sediment dominates, the grain size classification of Wentworth (1922; green) is used; when the combined carbonate, other chemical, and biogeneic sediment dominate, the principal lithology is taken from the dominant component type (blue). Closely intercalated intervals can be grouped as domains to avoid repetitive entry at the small-scale level.
Figure F17. Ternary diagram of volcaniclastic grain size terms and their associated sediment and rock types (modified from Fisher and Schmincke, 1984), subdivided into unconsolidated and consolidated lithologies.
Figure F18. Location of Site U1436 (proposed Site IBM-4GT) and ODP Sites 792, 786, and 787. Site U1436 lies 60 km east of the Aogashima basalt-dominant island volcano that forms an inhabited islet within the Izu archipelago. East of Aogashima isaland is the rhyolite-dominant submarine East Aogashima Caldera.
Figure F19. Shipboard age model and calculated sedimentation/accumulation rates, Site U1436. T = top, B = bottom, X = crossover.
Figure F20. A. Summary lithostratigraphic log, Hole U1436A. B. Downhole evolution in relative proportions of main lithofacies in Hole U1436A: tuffaceous mud, mafic volcaniclastics, and evolved volcaniclastics. Relative abundances are the normalized total thickness of each lithofacies per core. No values are plotted when recovery is too low or when core disturbance is too severe.
Figure F21. Site U1436 lithologies. A. Tuffaceous mud lithofacies with mafic ash and evolved ash lithofacies (interval 350-U1436A-3H-2, 2–86 cm). B. Black glassy mafic ash lithofacies underlain and overlain by tuffaceous mud lithofacies (interval 350-U1436D-11F-2A, 7–88 cm). C. Shards in the black glassy mafic ash (350-U1436A-8H-2-W, 97–99 cm; TS03). D. Evolved ash lithofacies with basal fine-grained lapilli and normally graded ash intercalated with tuffaceous mud lithofacies (interval 350-U1436A-4H-2A, 10–29 cm).
Figure F22. Shipboard ICP-AES and pXRF analyses results, Site U1436, compared to Izu arc front volcanoes and turbidites from Site 792.
Figure F23. A–C. Bathymetric maps of rear-arc region behind the arc-front volcanoes (Figure F11). 40Ar/39Ar and K-Ar ages from Ishizuka et al. (2003b). Age groups: ~12.5–3 Ma rear-arc basalt to rhyolite seamount volcanoes, <3 Ma bimodal volcanic rocks in extension zone that overlaps eastern half of the rear-arc seamount chains, and <1 Ma bimodal volcanic rocks of the narrow active rift (Figure F6). Site U1437 lies in a volcano-bounded basin (Figure F14A) between the Manji and Enpo rear-arc seamount chains at the foot of flat-topped Manji Volcano, presumably planed by wave action. JAMSTEC MCS surveys (M. Yamashita, pers. comm., 2014) shown in Figures F15, F24.
Figure F24. Seismic Line IBr5, which runs east from the Manji rear-arc seamount chain in the west to the arc front in the east, plotted on Figure F23B (M. Yamashita, pers. comm., 2014). A. Seismic velocity image obtained from wide-angle OBS data, with OBSs deployed every 5 km along Line IBr5. B. Depth-converted MCS reflection profile along Line IBr5. Dashed yellow lines = iso-velocity contours of 5 and 6 km/s obtained from seismic velocity image in Figure F13A, which are interpreted as the depth to igneous basement (upper crust) and middle crust, respectively (M. Yamashita, pers. comm., 2014).
Figure F25. Shipboard biostratigraphic and magnetostratigraphic datums, age-depth model, and LSR/MAR rates. LSR, total MAR, CAR, and nCAR are calculated from the age model. T = top, B = bottom, X = crossover.
Figure F26. Summary lithostratigraphic log, Site U1437. The boundary between coarse- and fine-grained volcaniclastics is 2 mm (corresponding to the boundary between ash and lapilli-sized particles).
Figure F27. Physical properties summary. A. 0–1100 mbsf, Holes U1437B and U1437D. APC = advanced piston corer, XCB = extended core barrel, RCB = rotary core barrel. GRA = gamma ray attenuation, MAD = moisture and density, PWL = P-wave logger, PWC = P-wave sensor (caliper), PWB = P-wave sensor (bayonet), WRMSL = Whole-Round Multisensor Logger, MSL = magnetic susceptibility logger, SHMSL = Section Half Multisensor Logger, MSP = point magnetic susceptibility. (Continued on next page.)
Figure F27 (continued). B. 1100 mbsf to bottom of Hole U1437E.
Figure F28. Summary lithostratigraphic logs. A. Hole U1437B. (Continued on next two pages.)
Figure F28 (continued). B. Hole U1437D. (Continued on next page.)
Figure F28. C (continued). Hole U1437E.
Figure F29. Downhole evolution in relative proportions of tuffaceous mud and volcaniclastics, dividing the volcaniclastics further into relative proportions of mafic and evolved materials. Thickness of bars represents core recovery. A. Hole U1437B. (Continued on next two pages.)
Figure F29 (continued). B. Hole U1437D. (Continued on next page.)
Figure F29 (continued). C. Downhole evolution of the relative proportion of tuffaceous mudstone and volcaniclastics and number and composition of volcanic clasts per core, normalized for recovery, Hole U1437E.
Figure F30. Representative lithology/interpretation, Unit I. A. 5–10 cm mafic ash intervals with sharp bases and tops grading upward into tuffaceous mud, with mafic ash pods (350-U1437B-10H). B. Evolved tuff intervals grading upward into tuffaceous mud and bioturbation (350-U1437D-10R).
Figure F31. Representative lithology/interpretation, Hole U1437D, Unit II. A. Closely intercalated monomictic tuff, lapilli-tuff, and lapillistone, showing stratification, cross stratification, and normal grading (Core 29R). B. Bioturbated tuffaceous mudstone with evolved tuff and lapilli-tuff intervals, with normal and reverse grading, soft-sediment deformation, and pumice clasts (Core 31R).
Figure F32. Representative lithology and interpretation, Hole U1437D, Unit III. A. Dark gray evolved tuff (Core 54R). B. Dark and light gray evolved tuff with green alteration showing planar and cross bedded stratification (Core 54R). C. Planar-bedded evolved tuff with crystals showing a sharp lower contact and a diffuse bioturbated upper contact grading upward into tuffaceous mudstone (Core 41R). D. Alternating tuffaceous mudstone, evolved tuff, and evolved lapilli-tuff, as well as closely intercalated tuffaceous mudstone and evolved tuff (Core 41R). E. Intercalated white to gray-green evolved tuff with soft-sediment deformation (58R-3, 70–94 cm [964.16–964.40 mbsf]).
Figure F33. Representative lithology/interpretation, Hole U1437E, Unit V A. Monomictic, reversely graded lapilli-tuff with pumice. Note erosive tuff base and reverse coarse-tail grading of pumice lapilli and fiamme (flattened pumice) upward; the tuff grades upward into increasingly muddy tuffaceous mudstone (Core 22R [1266.0–1267.67 mbsf]; red box shows location of D. Close-up and interpretation (22R-4, 74–130 cm [1266.74–1267.30 mbsf]). (Continued on next two pages.)
Figure F33 (continued). B. Thin section photomicrographs of evolved tuff: (a) light green tuff composed of a formerly glassy matrix with pyroxene and feldspar crystals (8R-4, 45–48 cm; TS83 [1136.45–1136.48 mbsf]); (b) intercalated white and gray tuff with a crystal-rich and vitric-rich layers. The crystal-rich layer is composed of plagioclase, clinopyroxene, and amphibole (8R-1, 59–62 cm; TS82 [1133.59–1133.62 mbsf]); (c) dark gray tuff composed of altered glassy shards, plagioclase, and opaques (7R-7, 71–73 cm; TS81 [1130.71–1130.73 mbsf]); (d) stratified brown tuff composed of altered glass shards, plagioclase, and opaques (19R-1, 81–84 cm; TS95 [1233.81–1233.84 mbsf]). C. Lapilli-tuff and lapillistone: (a) white to light-gray lapilli-tuff with large pumice lapilli (20R-2, 22–25 cm; TS97 [1244.22–1244.25 mbsf]) with matrix composed of glass shards, smaller pumice lapilli, and crystals of plagioclase; (b) clast-supported dark gray-green lapilli-tuff with pumice lapilli and volcanic lithic clasts and plagioclase and opaque crystals (16R-6, 114–117 cm; TS91 [1211.14–1211.17 mbsf]); (c) clast-supported dark gray-green pumice lapilli-tuff with crystals of pyroxene, plagioclase, and opaque minerals (17R-2, 114–117 cm; TS92 [1216.14–1216.17 mbsf]). The plagioclase crystals in TS91 and TS92 contain melt inclusions. (Continued on next page.)
Figure F33 (continued). D. Soft-sediment faulting in a sequence of interlayered tuff, tuffaceous mudstone, and tuffaceous sandstone (22R-1, 64–90 cm [1262.44–1262.70 mbsf]).
Figure F34. Representative lithologies and interpretation, Hole U1437E, Unit VI (Core 39R [1427.1–1436.35 mbsf]). A. Matrix-supported monomictic lapilli-tuff with fiamme, with stratification and inclined basal contact (39R-6, 0–17 cm [1433.43–1433.60 mbsf]) and matrix-supported monomictic lapilli-tuff and tuff intervals (39R-8 [1435.7–1436.35 mbsf]). Reddish horizons are tuffaceous mudstone rich. (Continued on next page.)
Figure F34 (continued). B. Left: clast-supported polymictic lapillistone with vitric clasts (subrounded pumice) and lithic clasts (subrounded mudstone and evolved volcanics) (1383.08–1383.21 mbsf). Right: clast-supported polymictic lapilli-tuff with vitric clasts (subrounded pumice) and lithic clasts (rounded mafic and evolved volcanics) (1376.81–1376.97 mbsf). C. Variety of clast types and differences: (top) clast-supported polymictic lapilli-tuff (33R-22, 36–39 cm; TS118 [1370.3–1370.33 mbsf]); (bottom) matrix-supported polymictic lapilli-tuff (29R-3, 38–41 cm; TS112 [1333.08–1333.11 mbsf]). D. Stratified tuff with fiamme on (left) macroscopic and (right) microscopic scale (39R-8, 45–65 cm [1436.15–1436.35 mbsf]).
Figure F35. Representative lithologies/interpretation, Hole U1437E, igneous Unit 1. A. Unit 1 relationship with Unit VI (35R [1388.10–1397.90 mbsf]). Only 1.21 m was recovered but its true thickness may be up to 6.50 m (see text). A second interval of similar material lower in the core (labeled “?”) is only 5 cm thick (35R-3, 59–64 cm) and has no recovered contacts; it was therefore described as a clast (note that similar clasts are described from the host Unit VI). (Continued on next page.)
Figure F35 (continued). B. Upper contact on igneous Unit 1 intrusive rhyolite and relationship with its host in Unit VI (35R-1, 37–121 cm [1388.47–1389.31 mbsf]). For discussion, see text. Photomicrographs of the (a, b) margin (35R-1, 76–78; TS121 [1388.86–1388.88 mbsf]) and (c, d) interior (35R-1, 115–118; TS122 [1389.25–1389.27 mbsf]) show the chilled upper margin of igneous Unit 1. C. Peperitic lower contact on igneous Unit 1 intrusive rhyolite (35R-2, 55–73 cm).
Figure F36. Glassy deposit, Hole U1437E, Unit VII. A. Homogeneous black glassy lapilli-tuff and lapillistone in the upper 183.93 m of Unit VII showing glass, plagioclase (plag), and clinopyroxene (cpx) in (top) plane-polarized light (PPL) and (bottom) cross-polarized light (XPL) (45R-1, 74–77 cm; TS134 [1486.14–1486.17 mbsf]). B. Black glassy lapilli-tuff and lapillistone with one of the rare lithic clasts, in (top) PPL and (bottom) XPL. Glass fragments (0.5–3 mm on average) have boundaries that are very poorly defined (43R-1, 36–40 cm; TS142 [1466.26–1466.30 mbsf]). C. Green lithic lapilli-tuff with blocks that dominates the lower part of Unit VII (57R-1, 88–105.5 cm). Note the complexly embayed and quenched margins on the blocks, which may represent clasts or the margins of intrusions or lava.
Figure F37. Rock-magnetic indexes SIRM/k and S−0.3T plotted against subbottom depth and compared with the pore water sulfate profile for Holes U1437B and U1437D.
Figure F38. Headspace methane and ethane concentrations, Holes U1437B, U1437D, and U1437E. Methane and ethane are plotted at 0 when below detection.
Figure F39. Pore water geochemical depth profiles, Holes U1437B and U1437D. Horizontal dashed line = boundary of Holes U1437B and U1437D. Vertical dashed lines = IAPSO seawater compositions.
Figure F40. Pore water geochemical depth profiles for Na, K, Ca, and Mg (ion chromatography) and Li and Si (ICP-AES), Holes U1437B and U1437D. Horizontal dashed line = boundary of Holes U1437B and U1437D. Vertical dashed lines = IAPSO seawater compositions (seawater Si [99 µM] is below scale).
Figure F41. Calcium carbonate depth profiles, Holes U1437B–U1437E. CaCO3 values are a 5-point average. For comparison, TOC/TNat contents are shown. Zero values are assigned when below detection.
Figure F42. Tuffaceous mud/mudstone compositions, Site U1437, determined by ICP-AES and pXRF. End-member compositions (averages for Izu arc-front basalt–dominant island volcanoes, Izu arc-front rhyolite–dominant submarine calderas, Izu rear-arc lava, Ryukyu dacite, Chinese loess, and marine carbonate) are plotted together with a schematic mixing triangle. Data plotting outside the triangle can be explained by simplifying assumptions regarding the end-member compositions. Tuffaceous mud data for fore-arc Site U1436 are plotted for comparison. Data sources: Scudder et al. (2009), Morse and Mackenzie (1990).
Figure F43. Depth variations for tuffaceous mud/mudstone analyzed by coulometry (CaCO3), ICP-AES (Zr, Y, and TiO2), and pXRF (Rb, Zr, Y, and TiO2), Site U1437. Vertical lines = overall average for the site.
Figure F44. Major and trace element compositions vs. SiO2 for volcaniclastic and igneous samples from sedimentary Units I–VII and igneous Unit 1 measured by ICP-AES, Site U1437. Fields circled by red and blue curves represent arc-front and rear-arc fields, respectively. (Continued on next page.)
Figure F45. Zr/Y vs. SiO2 for volcaniclastic and igneous samples from sedimentary Units I–VII and igneous Unit 1 compared to literature data. Note that R2 rhyolites from the arc front (rhyolite-dominant submarine calderas) are shown as a separate field as a subset of the arc-front data. Data sources: Tamura et al. (2009), Gill et al. (1994), Bryant et al. (2003), Straub et al. (2003, 2010), Hochstaedter et al. (2001), Ishizuka et al. (2002, 2003a, 2003b, 2006a, 2006b), Machida et al. (2003, 2008), Tollstrup et al. (2010). One outlier from the arc front field contains anomalously high Zr/Y and is not included in the “blob.”
Figure F46. Zr and Zr/Y analyzed by pXRF and ICP-AES for volcaniclastic and igneous samples, Site U1437. Probability curves below depth panels show the relative distribution of Zr and Zr/Y in basalt-dominant island volcanoes from the arc front (including R1 rhyolites), rhyolite-dominant submarine calderas in the arc front (R2 rhyolites), and rear-arc volcanic rocks. Vertical lines = composition of the peaks in the literature data distributions. Ig1 = igneous Unit 1. Data sources: Tamura et al. (2009), Gill et al. (1994), Bryant et al. (2003), Straub et al. (2003, 2010), Hochstaedter et al. (2001), Ishizuka et al. (2002, 2003a, 2003b, 2006a, 2006b), Machida et al. (2003, 2008), Tollstrup et al. (2010).
Figure F47. Summary of logs recorded by triple combo tool string in Hole U1437D and comparison to physical properties measured on cores recovered at Site U1437. HLDS = Hostile Environment Litho-Density Sonde, HNGS = Hostile Environment Natural Gamma Ray Sonde, GRA = gamma ray attenuation core data, MAD = moisture and density core data.
Figure F48. Section of seismic Line IBM3-NW5 crossing Site U1437, displayed as a function of depth using the time-depth relationship derived from the VSP and the synthetic seismogram.
Figure F49. Event periodicity from volcaniclastics deposited in the past 6.9 My, Site U1437. Thin red line = actual computed frequencies/cored interval, thick red line = frequencies adjusted for core recovery.
- F1. Tectonic setting of IBM arc.
- F2. Evolution of IBM arc.
- F3. Bathymetric features.
- F4. Wide-angle seismic profile location.
- F5. Wide-angle seismic profiles.
- F6. Volcano-tectonic domains within Izu arc.
- F7. MCS Section IBM4-EW5 E-W profile.
- F8. Periodic variation in average crustal thickness.
- F9. Sr, Nd, and Pb isotopes.
- F10. Wide-angle seismic profile across Izu arc.
- F11. Hot fingers hypothesis.
- F12. K2O vs. SiO2 of Izu arc front lavas.
- F13. Hypotheses for the evolution of Izu arc crust.
- F14. Two main basin types recognized within arcs.
- F15. Seismic lines with interpreted seismic layers.
- F16. Sedimentary and volcaniclastic lithology naming conventions.
- F17. Volcaniclastic grain size.
- F18. Location of Site U1436.
- F19. Shipboard age model.
- F20. Summary lithostratigraphic log, Hole U1346A.
- F21. Hole U1436A lithologies.
- F22. ICP-AES and pXRF results.
- F23. Bathymetric map.
- F24. Seismic Line IBr5.
- F25. Shipboard biostratigraphic and magnetostratigraphic datums.
- F26. Summary lithostratigraphic log, Site U1437.
- F27. Physical properties summary.
- F28. Summary lithostratigraphic logs, Site U1437.
- F29. Downhole proportions of mud and volcaniclastics.
- F30. Unit I.
- F31. Unit II.
- F32. Unit III.
- F33. Unit V.
- F34. Unit VI.
- F35. Igneous Unit 1.
- F36. Glassy deposit, Unit VII.
- F37. Rock-magnetic indexes SIRM/k and S−0.3T.
- F38. Headspace methane and ethane concentrations.
- F39. Pore water geochemical depth profiles.
- F40. Na, K, Ca, Mg, Li, and Si depth profiles.
- F41. CaCO3 depth profiles.
- F42. Tuffaceous mud/mudstone compositions.
- F43. Depth variations for mud and mudstone.
- F44. Major and trace element compositions vs. SiO2.
- F45. Zr/Y vs. SiO2.
- F46. Zr and Zr/Y.
- F47. Logs recorded by triple combo tool string, Hole U1437D.
- F48. Seismic Line IBM3-NW5 crossing Site U1437.
- F49. Event periodicity from tephras deposited in the past 6.9 My.