Gallagher, S.J., Fulthorpe, C.S., Bogus, K., and the Expedition 356 Scientists
Proceedings of the International Ocean Discovery Program Volume 356
publications.iodp.org
doi:10.14379/iodp.proc.356.105.2017

Site U14601
S.J. Gallagher, C.S. Fulthorpe, K. Bogus, G. Auer, S. Baranwal, I.S. Castañeda, B.A. Christensen, D. De Vleeschouwer, D.R. Franco, J. Groeneveld, M. Gurnis, C. Haller, Y. He, J. Henderiks, T. Himmler, T. Ishiwa, H. Iwatani, R.S. Jatiningrum, M.A. Kominz, C.A. Korpanty, E.Y. Lee, E. Levin, B.L. Mamo, H.V. McGregor, C.M. McHugh, B.F. Petrick, D.C. Potts, A. Rastegar Lari, W. Renema, L. Reuning, H. Takayanagi, and W. Zhang 2
Keywords: International Ocean Discovery Program, IODP, Expedition 356, JOIDES Resolution, Site U1460, Perth Basin, Indonesian Throughflow, Pliocene, Pleistocene, Leeuwin Current, West Australian Current, subsidence, Australian winter-dominated rainfall regime, Houtman-Abrolhos Reef, subtropical carbonates
MS 356-105: Published 26 February 2017
Background and objectives
International Ocean Discovery Program (IODP) Site U1460 lies in the northern part of the Perth Basin, about 18 nmi north of IODP Site U1459 and ~150 m from the Morangie-1 industry well on the Carnarvon ramp (James et al., 1999; Collins et al., 2014). Site U1460 is north of the Houtman Abrolhos main reef complex, which contains the most southerly tropical reefs in the Indian Ocean (Figures F1, F2, F3).

Figure F1. Map of the northwest shelf showing major basins and location of modern and “fossil” reefs.
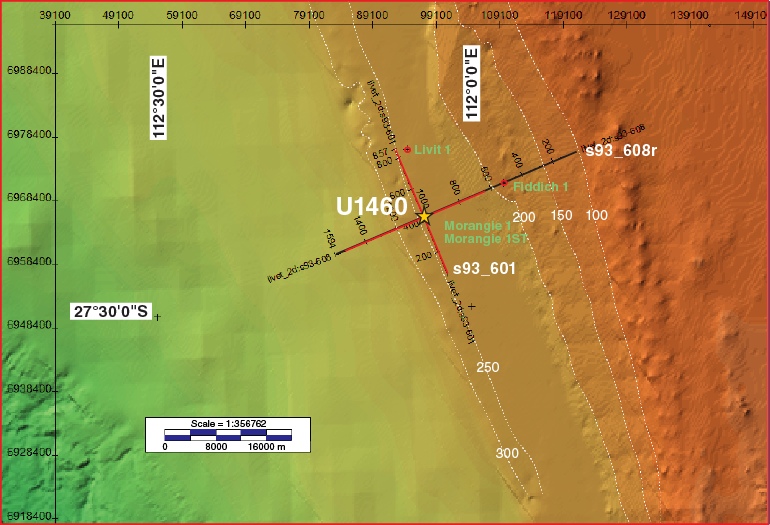
Figure F2. Bathymetric map showing the seafloor around Site U1460.
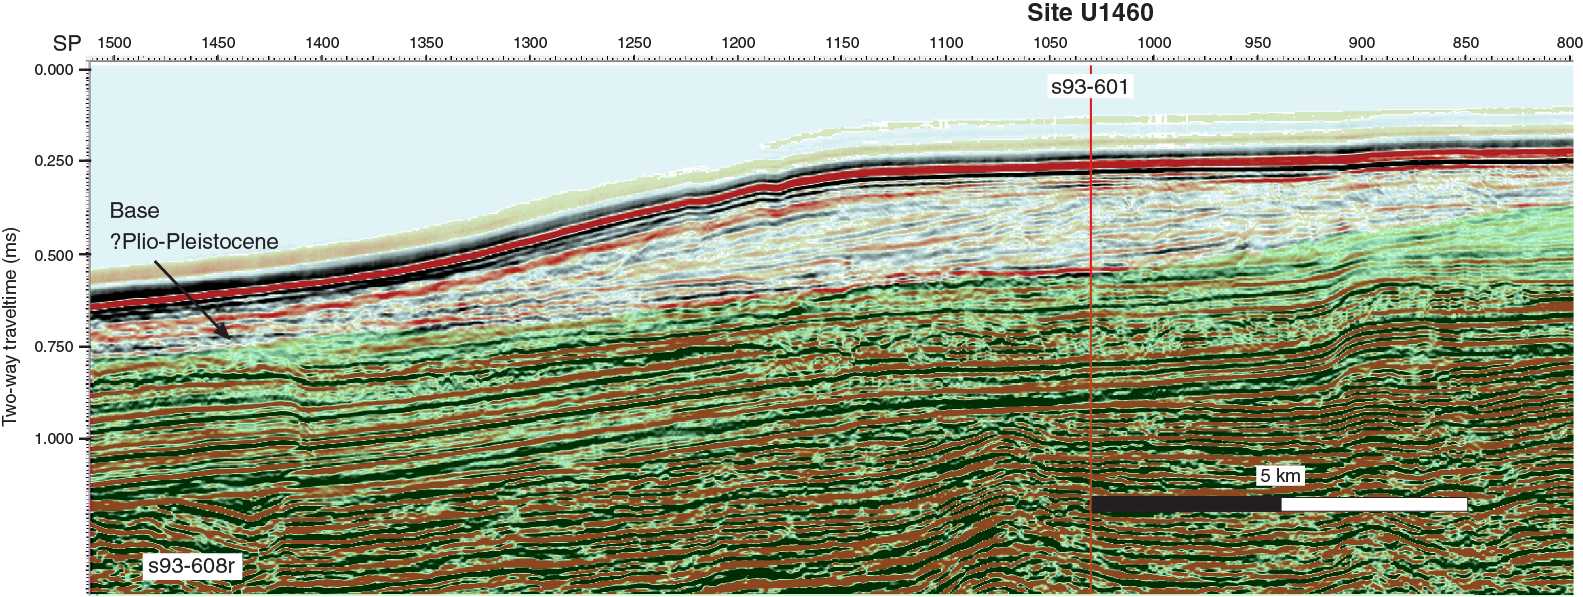
Figure F3. Multichannel seismic profile across Site U1460.
Site U1460 is at the northern edge of the modern winter-dominated rainfall zone of southwestern Australia and was targeted to chart the timing of this regime; prior to coring at this site, we suggested that it was not likely to yield an orbital-scale climate record because of slope erosional processes. However, we recovered a 300 m thick late Pliocene to Pleistocene record that may, in fact, reveal orbital-scale climate variability and complement the record at IODP Site U1461. Site U1460 is south of a climatic divide between the Australian monsoon–dominated north and the westerly wind-driven, winter rainfall–dominated south. The site is near the southern end of our north–south latitudinal transect and also provides a shelf to shelf-edge record of the tropical–subtropical transition related to Leeuwin Current activity. Site U1460 is influenced by the anticlockwise, colder West Australian Current gyre; the relative influence of this gyre versus the Leeuwin Current produces variations in paleoproductivity that may be documented over millions of years. Subsidence rates in this region are estimated to be significantly less than in the Carnarvon Basin further north because of variations in mantle dynamic subsidence between the Perth and Carnarvon Basins. Paleobathymetric analyses should produce the first detailed >1 My subsidence record for this part of the western margin of Australia, where previous subsidence estimates only extend to 125 ka (Collins and Testa, 2010).
Operations
Transit to Site U1460
After the 85 nmi transit from Site U1459, averaging 10.8 kt (7.9 h), the vessel arrived at Site U1460 at 2050 h on 12 August 2015 and offset 50 m to the west of the site coordinates. Shortly after arrival (2130 h), an acoustic positioning beacon was deployed.
Site U1460
After offsetting the vessel from the beacon, drill floor activities commenced. Given the previous difficulty establishing the mudline at Site U1459 (broken core barrel), we decided to tag the seafloor with the bit to determine depth and hardness. Hole U1460A was started at 0115 h on 13 August 2015. Based on the recovery of the mudline core, the seafloor depth was calculated as 214.5 meters below sea level (mbsl). Cores 356-U1460A-1F through 65F were recovered to 300.1 m drilling depth below seafloor (DSF). Core recovery was excellent (300.1 m cored with 291.39 recovered [recovery = 97.1%]). Hole U1460A ended at 0605 h on 14 August. The total time spent on Hole U1460A was 33.25 h (Tables T1, T2).
Table T1. Operations summary, Site U1460. Download table in .csv format.
Table T2. Site U1460 core summary. Download table in .csv format. View PDF table.
After offsetting the vessel 20 m north of Hole U1460A, Hole U1460B was started at 1920 h on 15 August. Based on the recovery of the mudline, the seafloor depth was calculated as 214.4 mbsl. After establishing the mudline, each core was advanced by recovery in an attempt to recover missing sections of core from the previous hole. Cores 356-U1460B-1F through 68F were recovered to 306.6 m DSF with the half-length advanced piston corer (HLAPC) system. Core recovery was excellent with 300.81 m recovered from 306.6 m cored (recovery = 98%). In situ temperature measurements with the advanced piston corer temperature tool (APCT-3) were taken on Cores 12F, 20F, 28F, 33F, and 36F. The total time spent on Hole U1460B was 37.75 h (Tables T1, T2).
Site U1460 ended at 1945 h on 15 August. A total of 133 cores were recovered with the HLAPC system; of the 606.7 m cored, 592.2 m was recovered (recovery = 97%).
Hole U1460A
After arriving at Hole U1460A (27°22.4948′S, 112°55.4296′E), preparations for coring commenced. As a result of previous difficulty establishing the mudline core at Site U1459 (broken core barrel), the seafloor was tagged with the bit to determine its precise location and whether it was as hard as the previous site. A nonmagnetic HLAPC core barrel was dressed with a core liner, picked up, and run into the hole. Hole U1460A was started at 0115 h on 13 August. Based on the recovery of the mudline core, the seafloor depth was calculated to be 214.5 mbsl. Coring continued with the HLAPC system through Core 356-U1460A-64F to 298.2 m DSF. After the mudline core, each core was advanced 4.7 m despite partial strokes on Cores 2F, 9F, and 64F. Hole U1460A was cored to a final depth of 300.1 m DSF (Core 65F). During coring, a routine slip, cut, and retermination of the coring line was performed. At the conclusion of coring, the drill string was pulled back to 231.6 m DSF and the top drive was set back. The drill string was pulled back to just above the seafloor, clearing the seafloor at 0605 h on 14 August and ending Hole U1460A. Of 300.1 m cored, 291.39 m of material was recovered (recovery = 97.1%). The total time spent on Hole U1460A was 33.25 h.
Hole U1460B
After offsetting the vessel 20 m north of Hole U1460A, preparations were made to begin Hole U1460B (27°22.4867′S, 112°55.4265′E). A nonmagnetic HLAPC core barrel was dressed with a core liner, picked up, and run into the hole. Hole U1460B was started at 1920 h on 14 August. Based on the recovery of the mudline core, the seafloor depth was calculated to be 214.4 mbsl. Coring continued with the HLAPC system through Core 356-U1460B-68F to 306.6 m DSF. After the mudline core, each core was advanced by recovery in an attempt to cover any gaps from Hole U1460A. Of the 306.6 m cored, 800.81 m was recovered (recovery = 98%). Also in this hole, in situ temperature measurements were made with the APCT-3 before recovering Cores 12F, 20F, 28F, 33F, and 36F. During coring, a routine slip, cut, and retermination of the coring line was performed. At the conclusion of coring, the drill string was pulled back to 260.7 m DSF and the top drive was set back. The drill string was pulled from the hole and the advanced piston corer/extended core barrel bit cleared the rig floor at 1940 h. The thrusters and hydrophones were pulled and secured, and at 1945 h on 15 August, Site U1460 concluded. The total time spent on Hole U1460B was 37.75 h.
Lithostratigraphy
Lithostratigraphic units and their boundaries are defined by changes in lithology (identified by visual core description and smear slide observations), physical properties, color reflectance (L*, a*, and b*), and petrographic thin section analyses. Site U1460 consists of two lithostratigraphic units, with three subunits in the upper unit (Table T3; Figure F4). Unit boundaries are defined as the first occurrence of a new lithology downhole. Subunits are distinguished primarily by differences in fossil abundance, as well as changes in diagenetic overprint and mineralogical components. Lithified layers characterized by authigenic mineralization and interpreted as hardgrounds define the boundaries between subunits. These hardgrounds are associated with peaks in natural gamma radiation (NGR) and are used for correlation between Holes U1460A and U1460B (Figure F4).
Table T3. Lithostratigraphic unit summary, Site U1460. Download table in .csv format.
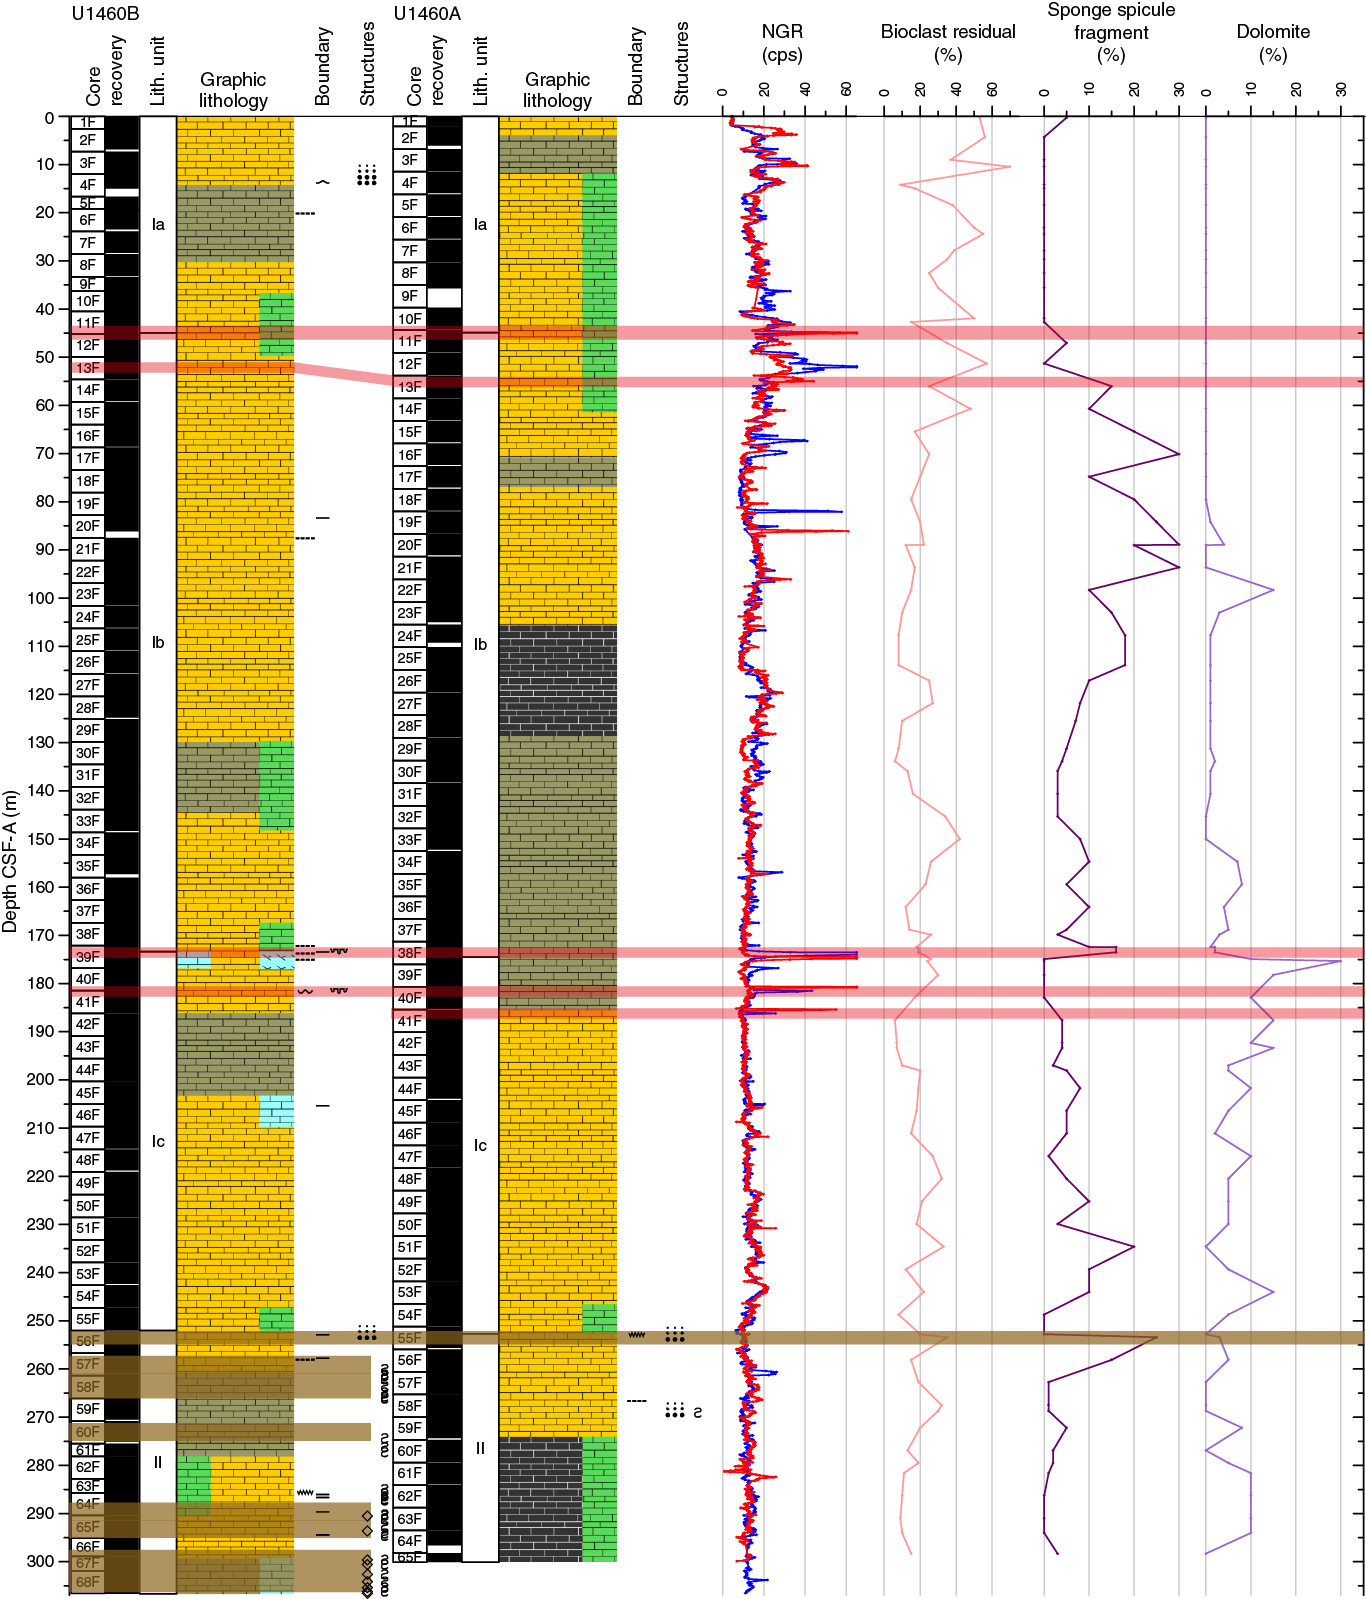
Figure F4. Lithostratigraphic summary, Site U1460.
The lithologic descriptions are based on sediments recovered from Holes U1460A (0–300.08 m core depth below seafloor [CSF-A]) and U1460B (0–306.65 m CSF-A). Smear slide and thin section observations are based primarily on samples from Hole U1460A (Figure F5; Tables T4, T5) and supplemented by data from Hole U1460B.
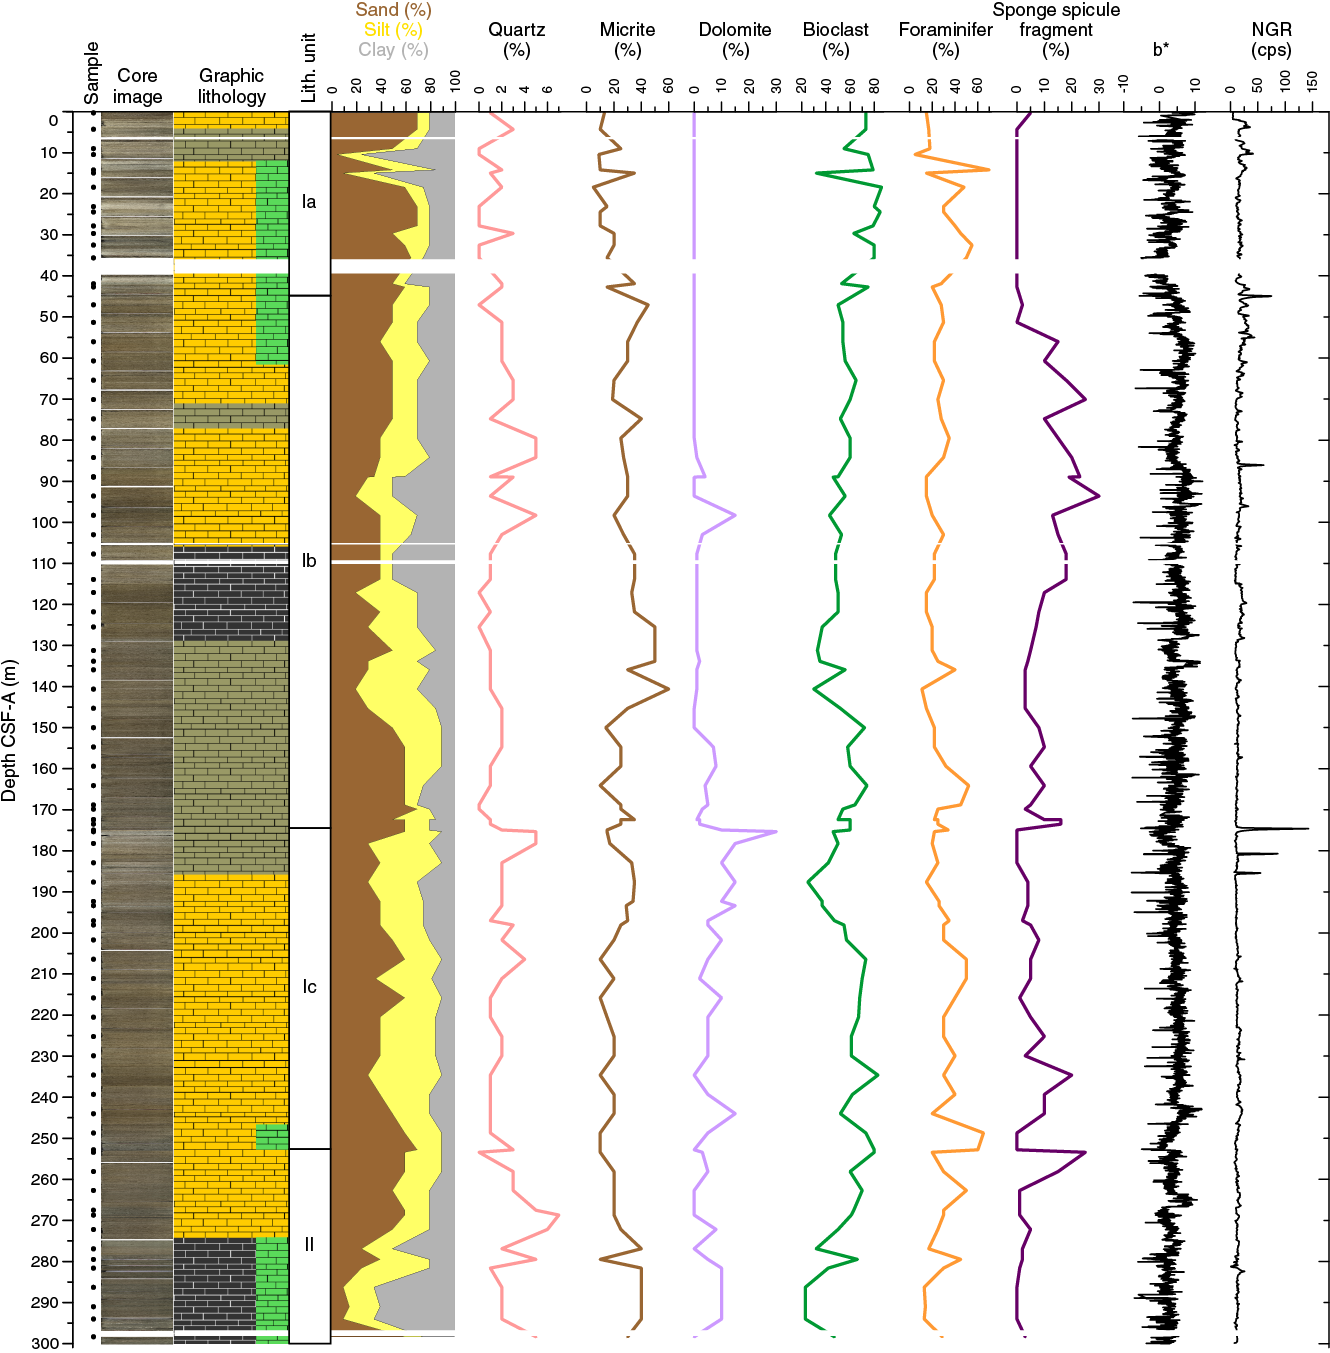
Figure F5. Smear slide summary, Hole U1460A.
Table T4. Site U1460 smear slide samples. Download table in .csv format.
Table T5. Thin section samples, Site U1460 Subunit Ic and Unit II. Download table in .csv format.
Holes U1460A and U1460B were aligned based on drilling depth and the occurrence of correlated lithologic boundaries, including hardgrounds and reworked sediment (Figure F4; Table T4).
Unit I
- Intervals: 356-U1460A-1F-1A, 0 cm, through 55F-2A, 0 cm; 356-U1460B-1F-1A, 0 cm, through 56F-1A, 0 cm
- Depths: Hole U1460A = 0–252.70 m CSF-A (257.20 m thick); Hole U1460B = 0–252.00 m CSF-A (252.00 m thick)
- Age: recent–early Pleistocene
- Lithology: predominantly unlithified to partially lithified skeletal packstone with wackestone and grainstone intervals
- Core quality: moderately affected by drilling disturbances, mainly by fall-in of bioclastic gravel at core tops
Unit I consists mainly of unlithified to partially lithified packstone with minor wackestone and grainstone and some lithified intervals (Figure F4). This unit is divided into three subunits based on the abundances of macrofossils and sponge spicules and variation in diagenetic alteration. Macrofossils are concentrated in Subunit Ia, sponge spicules in Subunit Ib, and Subunit Ic is rich in authigenic glauconite, with increased dolomite and macrofossils (Figure F5). Records from Holes U1460A and U1460B are very similar.
Subunit Ia
- Intervals: 356-U1460A-1F-1A, 0 cm, through 11F-1A, 50 cm; 356-U1460B-1F-1A, 0 cm, through 11F-4A, 42 cm
- Depths: Hole U1460A = 0–44.90 m CSF-A (44.90 m thick); Hole U1460B = 0–44.94 m CSF-A (44.94 m thick)
- Age: recent–Middle Pleistocene
- Lithology: predominantly unlithified skeletal packstone with interbedded wackestone
- Core quality: moderately affected by drilling disturbances, mainly by fall-in of bioclastic gravel at core tops
Subunit Ia is characterized by beige to greenish-gray skeletal packstones. The packstones are interbedded with wackestones and mudstones in the uppermost 20 m (Figure F4). The sediment is predominantly unlithified, except for a minor lithified interval in the lowermost part of the subunit. The base of the lithified interval, corresponding to the base of Subunit Ia, is defined by a hardground at 44.90 m CSF-A (Sample 356-U1460A-11F-2A, 50 cm). Glauconite is present throughout the subunit but increases in abundance toward the base. Bioclasts of neritic macrofossils such as echinoderms, bryozoans, bivalves, and gastropods are present, with major pelagic components including planktonic foraminifers. Microscopic bioclastic fragments are common in Subunit Ia. The abundance of skeletal material, especially macrofossils, suggests that facies of Subunit Ia represent a neritic to hemipelagic setting.
Smear slides
Smear slide samples from Subunit Ia are dominated by shell fragments, best highlighted by the “bioclast residual” in Figure F4 (bioclast residual = bioclast total − [total foraminifer + total sponge spicules]). Benthic and planktonic foraminifers with size ranges from coarse silt to sand are also common (Figures F5, F6). The sediment is an unconsolidated carbonate-rich skeletal packstone with foraminifers. Several lightly compacted nannofossil-rich muds occur in Subunit Ia (Samples 356-U1460A-5F-2, 71 cm, and 6F-2, 71 cm). There are minor amounts of quartz and mica in most samples. Micrite dominates the clay- and silt-sized fraction, accompanied by minor amounts of clay minerals (Figure F5).
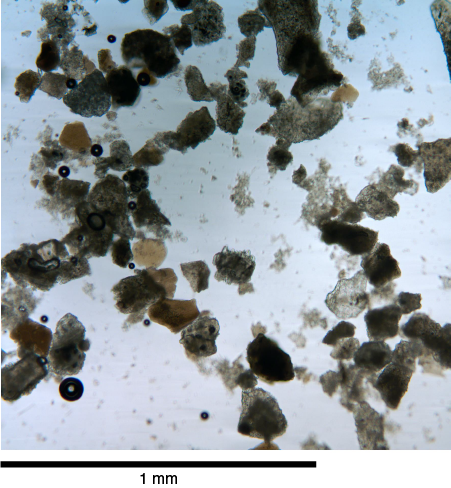
Figure F6. Dominant fossil assemblage and foraminifers.
Subunit Ib
- Intervals: 356-U1460A-11F-1A, 50 cm, through 38F-3A, 23 cm; 356-U1460B-11F-4A, 42 cm, through 39F-1A, 126 cm
- Depths: Hole U1460A = 44.90–174.53 m CSF-A (129.63 m thick); Hole U1460B = 44.94–173.36 m CSF-A (128.42 m thick)
- Age: Middle–early Pleistocene
- Lithology: unlithified packstone in upper part and partially lithified wackestone and mudstone in lower part of the subunit
- Core quality: unlithified layers occasionally appear slightly soupy from dewatering; lithified layers are slightly to moderately fractured; severe drilling disturbance from fall-in of bioclastic gravel commonly occurs at core tops
The top of Subunit Ib is defined by a ~10 cm thick lithified skeletal and intraclast-rich grainstone layer with bioturbation and dark gray patches. The lithified layer in Hole U1460A is severely fractured from drilling and is better preserved in Hole U1460B (Figure F7). This lithified layer is interpreted as a hardground and is associated with a peak in NGR (Figure F4). Immediately below the hardground in both holes and continuing for ~1 m, the sediment is mottled with green and dark gray patches, likely from glauconite and other authigenic minerals concentrated in burrows. There is a second hardground, also correlated across both holes (top of Samples 356-U1460A-13F-2, 73 cm, and 356-U1460B-13F-2, 60 cm), approximately 11 m below the first hardground. Glauconite is common below the hardground to 61.5 m CSF-A in Hole U1460A (Sample 14F-2, 0 cm).
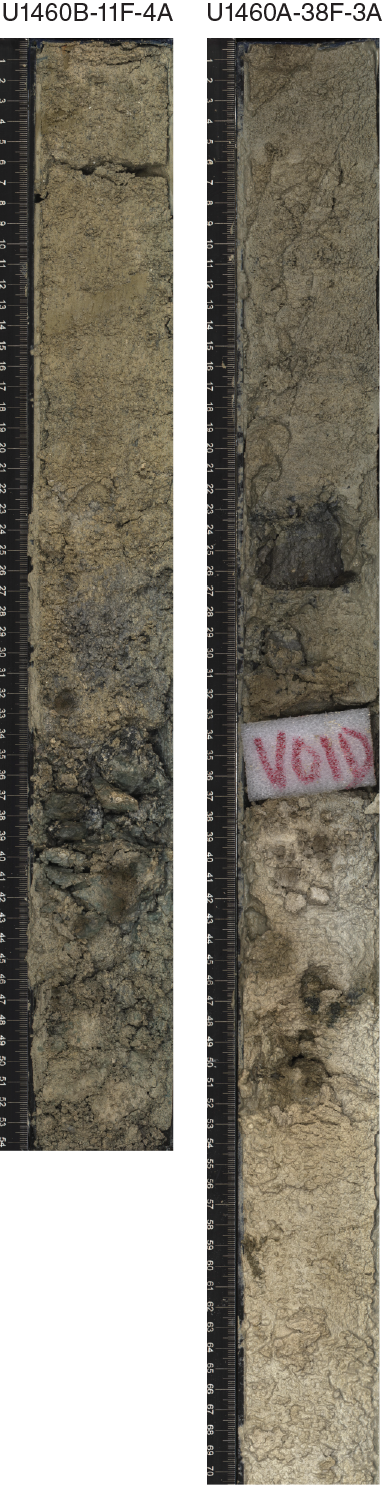
Figure F7. Hardgrounds at the top of Subunits Ib and Ic, Site U1460.
The hardgrounds coincide with a shift in the bioclastic assemblage that distinguishes Subunit Ia from Subunit Ib. Subunit Ib is dominated by foraminifers and sponge spicules (Figure F4). Sponge spicules are very abundant to 128.83 m CSF-A (Sample 356-U1460A-28F-CC, 15 cm).
The upper part of Subunit Ib is dominated by unlithified beige to light brown packstone and the lower part by partially lithified wackestone and mudstone (Figure F4). Glauconite content increases in Hole U1460B in the lower part of the unit. Celestite replaces bioclasts or calcite around some burrows. The abundance of planktonic foraminifers and sponge spicules indicates Subunit Ib was deposited in a hemipelagic setting.
Smear slides
The sediment is characterized by an abundance of sponge spicules, ranging from 20 to 1000 µm in length (Figure F8). Sponge spicule abundance shows an inverse relationship to NGR in Subunit Ib (Figure F4). Compared to Subunit Ia, there are fewer shell fragments and foraminiferal tests. The abundance of foraminiferal tests remains relatively constant throughout the subunit. Subunits Ia and Ib contain similar amounts of siliciclastic components. Dolomite is present and is mostly associated with either glauconitic hardgrounds or particularly glauconite-rich intervals.
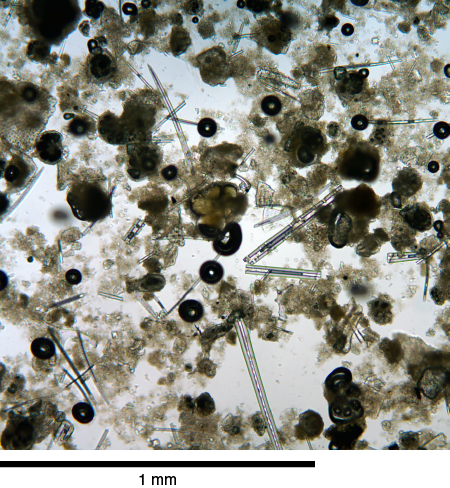
Figure F8. Siliceous sponge spicules up to 200 µm in diameter.
Subunit Ic
- Intervals: 356-U1460A-38F-3A, 23 cm, through 55F-2A, 0 cm; 356-U1460B-39F-1A, 126 cm, through 56F-1A, 0 cm
- Depths: Hole U1460A = 174.53–252.70 m CSF-A (78.17 m thick); Hole U1460B = 173.36–252.00 m CSF-A (78.64 m thick)
- Age: early Pleistocene
- Lithology: unlithified packstone with unlithified to partially lithified wackestone toward the top of the subunit
- Core quality: slight to moderate drilling disturbance; fill-in material in core tops and slight to moderate biscuit formation
Subunit Ic begins at the top of a hardground layer (Samples 356-U1460A-38F-3, 23 cm, and 356-U1460B-39F-1, 126 cm). In Hole U1460A, the hardground is the first of three within the interval 174.53–185.58 m CSF-A (interval 38F-3, 23 cm, through 41F-1, 32 cm) (Figures F7, F9, F10). Only the top two Subunit Ic hardgrounds from Hole U1460A are present in Hole U1460B (the tops of hardgrounds in Hole U1460B occur at 173.36 and 181.50 m CSF-A; Samples 39F-1, 126 cm, and 41F-1, 10 cm).

Figure F9. Hardground, Subunit Ic.
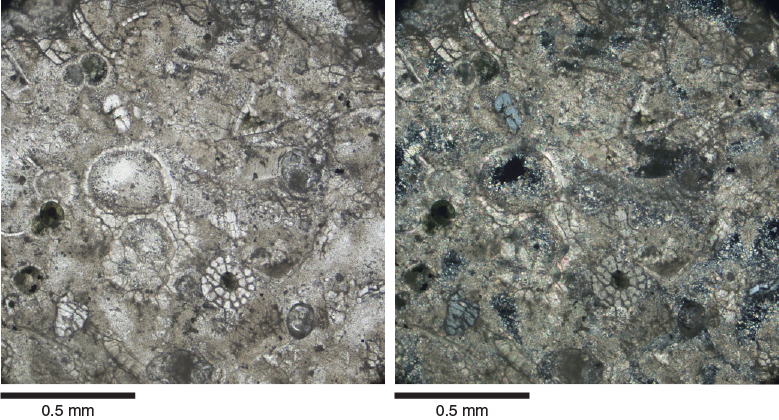
Figure F10. Hardground at the top of Subunit Ic showing skeletal packstone with recrystallized bioclasts cemented by microcrystalline cement.
The hardgrounds in Subunit Ic are similar in composition to the hardground at the top of Subunit Ib, and there is a similar alteration of the sediment immediately below them in both subunits. The first Subunit Ic hardground coincides with a rapid downcore increase in dolomite content (Figure F4). Dolomite is present throughout Subunit Ic, although the dolomite increase in Subunit Ib is intermittent (Figures F4, F5). Glauconite is rare throughout most of Subunit Ic in both holes; however, it is common at the base of Subunit Ic.
Bioclasts are dominated by planktonic and small benthic foraminifers, and there is an increasing abundance of sponge spicules toward the base of the subunit (Figure F5). The depositional setting of Subunit Ic was hemipelagic.
Smear slides
Smear slide samples from the top of Subunit Ic have the highest concentrations of dolomite at the site. Despite the common presence of euhedral dolomite, evidence for dolomitization of foraminiferal tests is restricted to just a few slides (interval 356-U1460A-39F-2, 71 cm, through 43F-3, 26 cm). Sponge spicules are present but are less abundant than in Subunit Ib, with echinoid spine fragment–rich intervals occurring throughout the subunit. Quartz sand is common but not a major constituent of the sediment.
Thin sections
One thin section was prepared from the hardground that forms the Subunit Ib/Ic boundary (Figure F10). The thin section shows that the hardground is a skeletal packstone to grainstone with abundant planktonic and rare benthic foraminifers. The planktonic foraminifers are mainly fine sand sized. Other bioclasts are rare (e.g., echinoderm fragments and ostracods). Angular silt- to fine sand–sized siliciclastic quartz grains are present as minor constituents. The primary micrite matrix is in the early stages of neomorphism and partially converted to microsparite. Matrix porosity is low.
Unit II
- Intervals: 356-U1460A-55F-2A, 0 cm, through 65F-CC, 12 cm; 356-U1460B-56F-1A, 0 cm, through 68F-CC, 12 cm
- Depths: Hole U1460A = 252.70–300.08 m CSF-A (47.31 m thick); Hole U1460B = 252.00–306.65 m CSF-A (54.65 m thick)
- Age: early Pleistocene–early Pliocene
- Lithology: unlithified to partially lithified packstone, mudstone, and wackestone
- Core quality: drilling disturbance is slight to moderate except at the base of the unit, where the disturbance is severe
Unit II is characterized by unlithified to partially lithified packstone (light brown and beige) and mudstone (light grayish green) interbedded with wackestone (gray). Unit II is defined by the first appearance of a mass-wasting deposit. Mass-wasting deposits in Unit II are characterized by graded or contorted beds (Figure F11). The first mass-wasting deposit appears in Hole U1460A at 252.7 m CSF-A (Section 55F-2) and in Hole U1460B at 252 m CSF-A (Section 56F-1) and can be correlated between the holes.
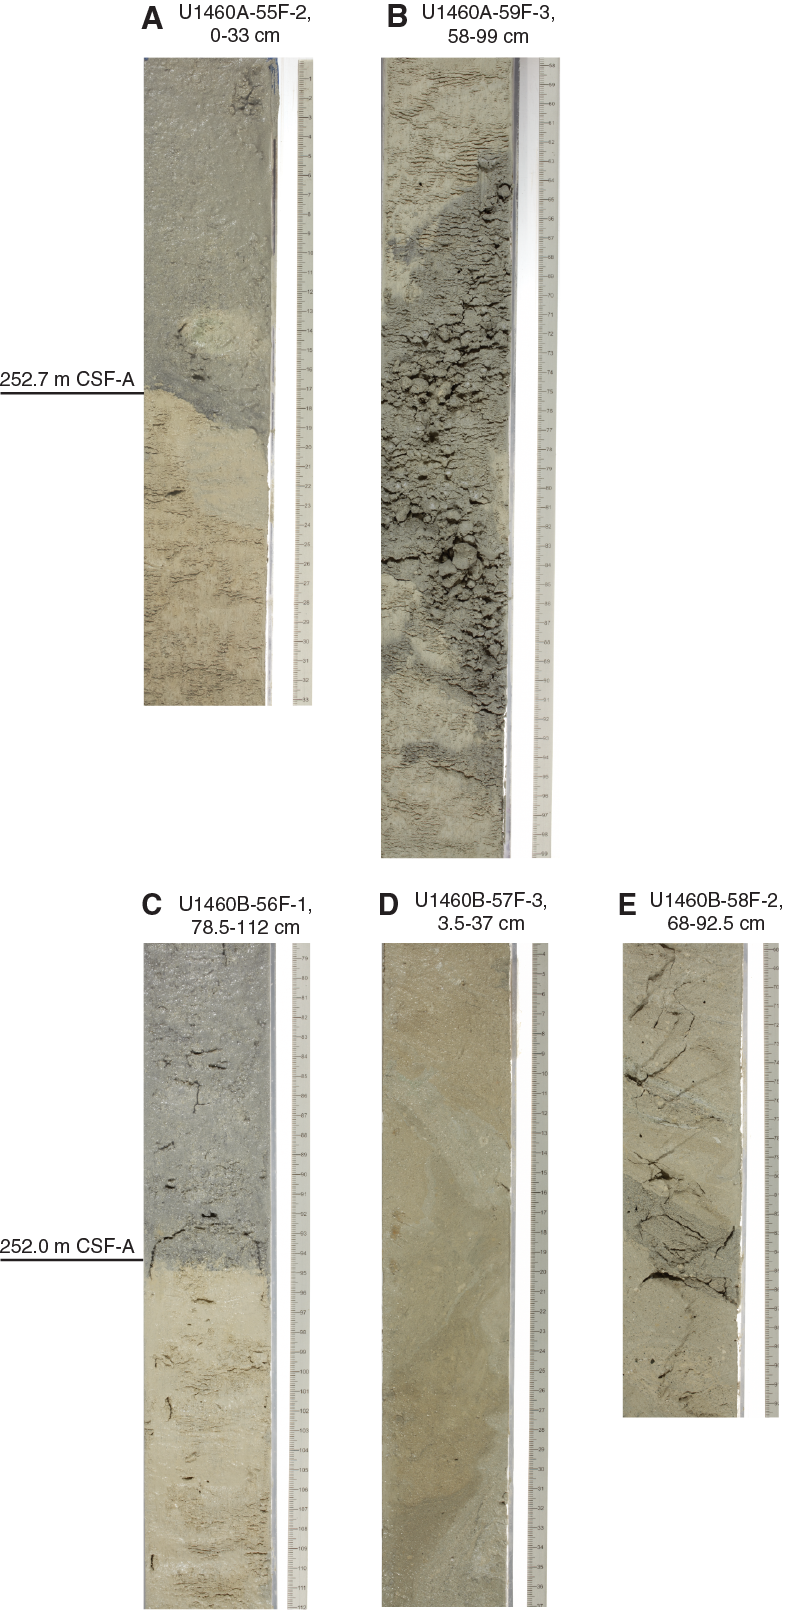
Figure F11. Unit II mass-wasting deposits, Site U1460.
The mass-wasting deposits have sharp inclined to subhorizontal basal contacts and show fluidized structures, isoclinal and recumbent folds, inclined and contorted layers, and floating clasts of varying sizes (millimeters to centimeters long) and lithologies (Figure F11). Glauconite is present throughout the unit, both in the matrix and in the floating clasts. The mass-wasting deposits also contain abundant large-sized benthic foraminifers and are interbedded with unlithified beige homogeneous packstone.
The sediment becomes partially lithified toward the base of both holes. The facies of Unit II is interpreted to be hemipelagic to pelagic.
Smear slides
Unit II contains fewer sand-sized grains with more numerous clay-sized particles, clay minerals, and micrite than Unit I (Figure F5). The number of bioclasts, including foraminifers, sponge spicules, and echinoids, decreases throughout Unit II (Figure F12). There are very few bioclasts, and sponge spicules disappear in the interval from 286.28 to 294.2 m CSF-A in Hole U1460A (62F-2, 71 cm, through 64F-1, 52 cm). Downcore, the amount of bioclasts again increases slightly.
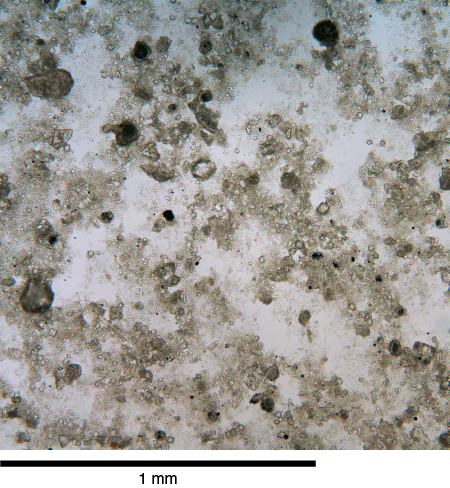
Figure F12. Packstone interbedded with mass-wasting deposits in Unit II.
Thin sections
Four thin sections were prepared from the packstones that are interbedded with mass-wasting deposits in Unit II. Overall, the limestones are foraminifer-rich packstones, comprising mainly planktonic foraminifers and rare benthic foraminifers (Figure F13). Finely dispersed pyrite is common, with silt-sized angular quartz grains scattered through the thin sections.
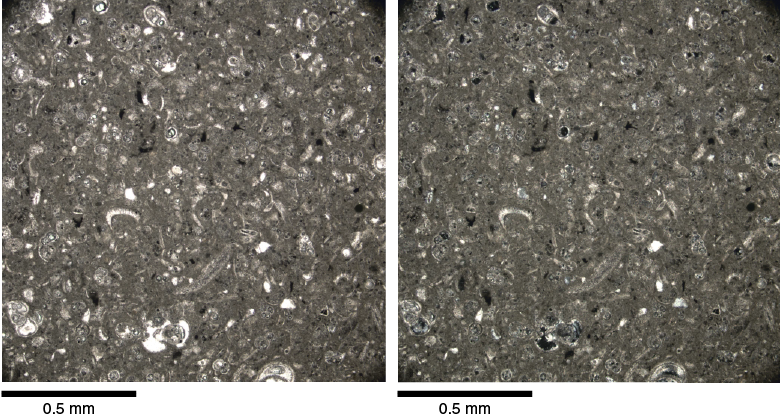
Figure F13. Packstone interbedded with mass-wasting deposits within Unit II.
Biostratigraphy and micropaleontology
Calcareous nannofossils are common to dominant and show overall good preservation in the (predominantly) packstone sediments recovered at Site U1460. The nannofossil assemblages are dominated by placolith-bearing members of the Noelaerhabdaceae family, most notably by small (<4 µm) Gephyrocapsa spp. and Reticulofenestra spp. The early Pleistocene–late Pliocene marker species Discoaster brouweri (top at 1.93 Ma) is rare from Sample 356-U1460A-45F-CC (208.85 m CSF-A) to the bottom of Hole U1460A (Sample 65F-CC; 300.08 m CSF-A). The top occurrence of Sphenolithus spp. in Samples 356-U1460A-63F-CC (293.45 m CSF-A) and 356-U1460B-65F-CC (295.04 m CSF-A) indicates that the bases of both Holes U1460A and U1460B are of middle Pliocene age. A total of 54 smear slides were examined for biostratigraphic marker species and common taxa.
Planktonic foraminifer preservation and abundance are significantly better at Site U1460 than at the previous sites. Biozone Pt1a (0.61–1.93 Ma; top of Globorotalia tosaensis and base of Globorotalia truncatulinoides) is between Samples 356-U1460A-19F-CC and 57F-CC (86.5 and 265.2 m CSF-A). Below Sample 60F-CC (279.3 m CSF-A), a Pliocene faunal assemblage (Biozone PL4) indicates a minimum age of 3.47 Ma (top of Dentogloboquadrina altispira). The bottom of Hole U1460B (Sample 68F-CC; 306.65 m CSF-A) is in Biozone PL2 (top of Globorotalia margaritae), and based on the presence of Globorotalia crassaformis, Site U1460 has an oldest age of 4.3 Ma (base of Biozone PL2).
The samples contain between 13% and 63% benthic foraminifers, with Cibicides spp. and Cibicidoides spp. the most common taxa. Four assemblages can be identified by abundances of Uvigerina peregrina, Siphogenerina raphana, Bolivina spp., Trifarina spp., Cibicides spp., and Cibicidoides spp. In each sample, 7–35 species are present. Except for the uppermost three samples, preservation is poor and affected by fragmentation and abrasion. The proportion of planktonic foraminifers suggests outer shelf to upper slope (100–500 m) paleodepths.
Calcareous nannofossils
Core recovery was good to excellent in both Holes U1460A and U1460B, with an extended Pleistocene section and early Pliocene strata at the bottom of both holes (Table T6). Calcareous nannofossils are abundant with overall good preservation throughout the cored interval. Preservation is moderate in the interval between Samples 356-U1460A-44F-CC and 50F-CC (203.91 and 232.51 m CSF-A). A total of 47 smear slides from Hole U1460A were examined. The base of Emiliania huxleyi, which denotes the Biozone NN20/NN21 boundary (0.29 Ma; Gradstein et al., 2012), occurs in Sample 1F-CC (2.13 m CSF-A). The top of Pseudoemiliania lacunosa, which defines the Biozone NN19/NN20 boundary (0.44 Ma), is in Sample 5F-CC (20.65 m CSF-A). Downhole, P. lacunosa is rare to common throughout the sampled sections (Table T7) and occur in both subcircular and oval shapes. Reticulofenestra asanoi (similar in size and shape to oval P. lacunosa but having a wider collar and smooth proximal shields; Figure F14) was identified in Samples 28F-CC through 38F-CC (128.88–176.24 m CSF-A), constraining the age to 0.91–1.14 Ma within Biozone NN19. The top occurrence of Calcidiscus macintyrei in Sample 42F-CC (194.99 m CSF-A) indicates an age of 1.60 Ma or older (basal part of Biozone NN19). The top of D. brouweri and Biozone NN18 (1.93 Ma) is between Samples 44F-CC (203.91 m CSF-A) and 45F-CC (208.85 m CSF-A). D. brouweri is present to rare until the bottom of Hole U1460A and is also consistently present in smear slide samples from the gray and brown unlithified packstones in Section 58F-3 (268.66–269.07 m CSF-A; toothpick samples taken at 36 cm [gray packstone, above sharp contact], 48 cm [brown packstone, below sharp contact], and 77 cm [gray packstone]). The top of Biozone NN16, which includes the Pliocene/Pleistocene boundary, is marked by Discoaster surculus in Sample 61F-CC (283.93 m CSF-A; >2.49 Ma). Sphenolithus spp. (mainly Sphenolithus abies) are present from Sample 63F-CC (293.45 m CSF-A) and further downcore, denoting the basal part of Biozone NN16 (3.54–3.7 Ma). In Hole U1460B, an additional seven core catcher samples were examined toward the base of the hole. This confirmed the top of Sphenolithus spp. at 295.04 m CSF-A (Sample 356-U1460B-65F-CC) and provided an additional early Pliocene biostratigraphic datum, the top of Reticulofenestra pseudoumbilicus (3.7 Ma), at 300.8 m CSF-A in Sample 67F-3, 0 cm.
Table T6. Calcareous nannofossil and planktonic foraminifer datums, Site U1460. Download table in .csv format.
Table T7. Calcareous nannofossil abundance and range charts, Site U1460. Download table in .csv format.
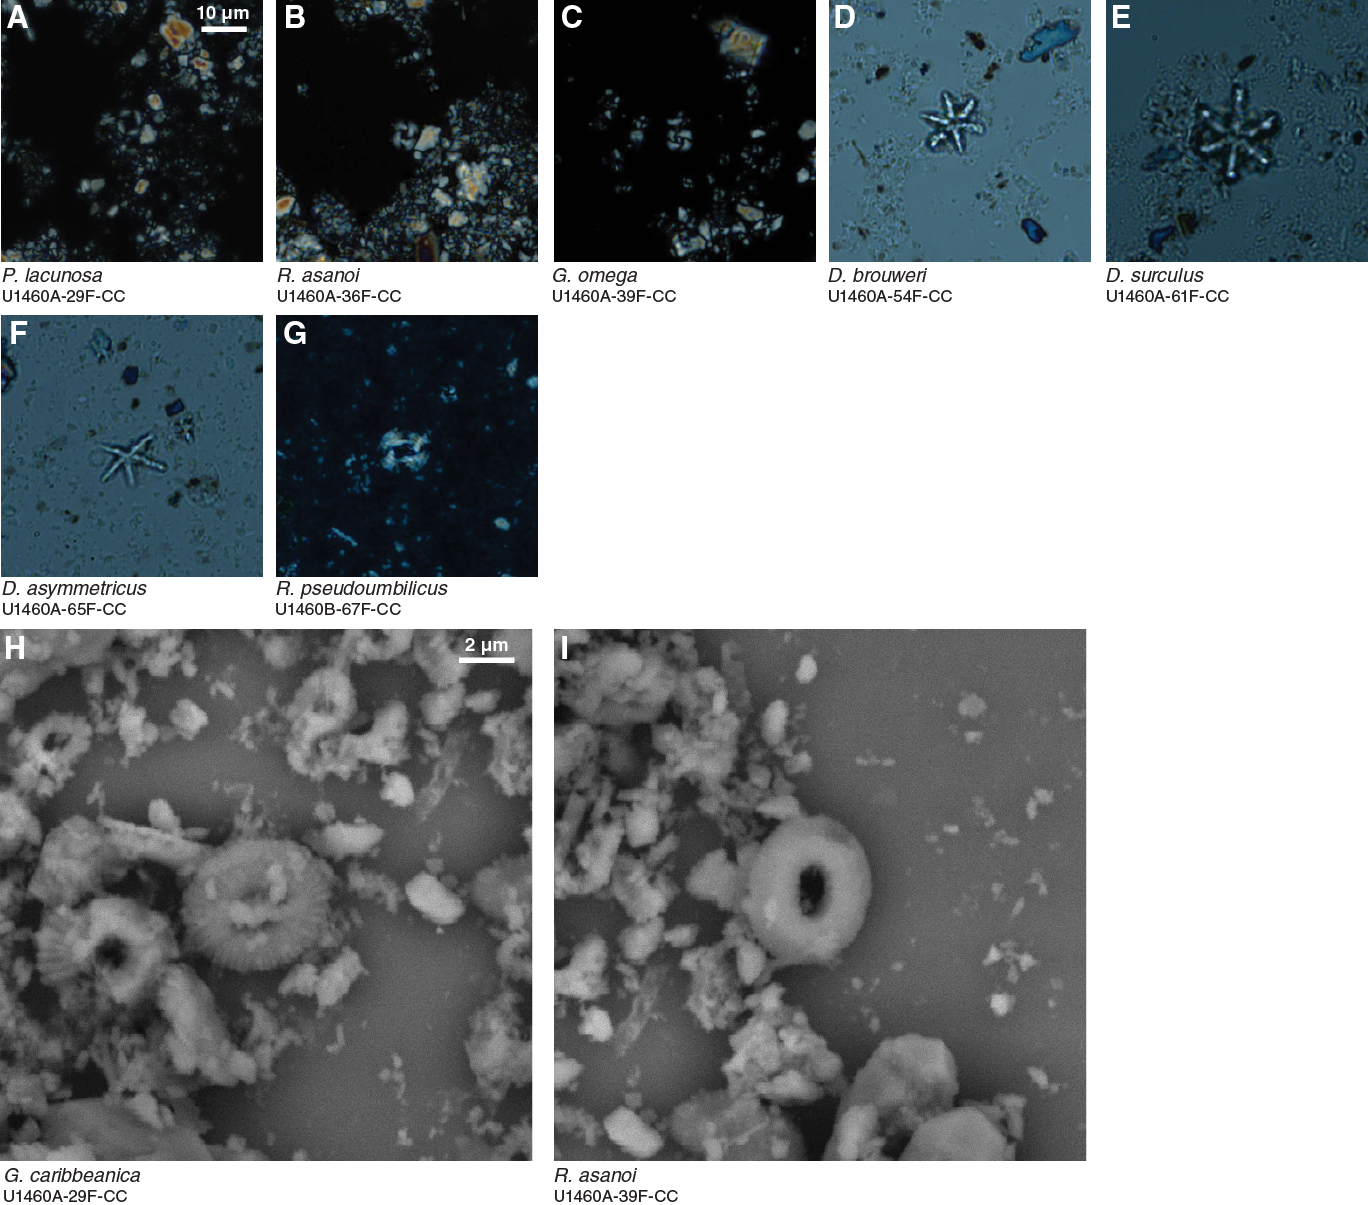
Figure F14. Calcareous nannofossils, Site U1460.
Planktonic foraminifers
A total of 11 core catcher samples were analyzed for planktonic foraminiferal content from Hole U1460A out of the processed samples (1F-CC though 65F-CC; 0–300.08 m CSF-A). For Hole U1460B, Samples 66F-CC through 68F-CC (297.3–306.65 m CSF-A) were processed for analyses. Overall species diversity varied from 5 to 10 different taxa in each sample, with higher diversity beginning in Sample 356-U1460A-57F-CC (265.2 m CSF-A) and continuing until Sample 65F-CC (300.08 m CSF-A) (Tables T8, T9). Planktonic foraminifers were generally common to abundant, apart from Samples 45F-CC through 57F-CC (208–265 m CSF-A), which contained fewer specimens (Figure F15). Preservation varied between poor and good without a clear downcore trend (Table T9).
Table T8. Occurrence of main genera and species of benthic and planktonic foraminifers and additional bioclasts and minerals, Site U1460. Download table in .csv format.
Table T9. Planktonic foraminifer presence, abundance, and preservation at Site U1460. Download table in .csv format.
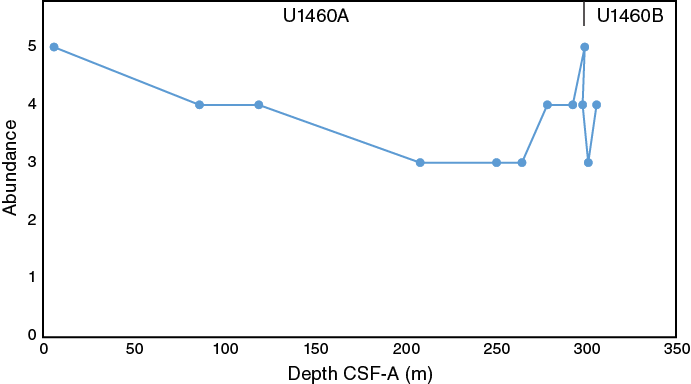
Figure F15. Planktonic foraminifer abundance, Site U1460.
The absence of G. tosaensis (top at 0.61 Ma) in Sample 356-U1460A-2F-CC (6.1 m CSF-A) and its presence in Sample 19F-CC (86.5 m CSF-A) indicate the sediments belong to Biozones Pt1b and Pt1a, respectively (Table T6). The continuing presence of G. truncatulinoides to Sample 57F-CC (265.2 m CSF-A) indicates the base of Biozone PT1a (1.93 Ma). The presence of D. altispira (top at 3.47 Ma; Gradstein et al., 2012) in Samples 60F-CC through 63F-CC (279.3–293.4 m CSF-A) and in Samples 356-U1460B-66F-CC and 67F-CC (300 m CSF-A) suggests Biozone PL4. Additionally, the presence of G. crassaformis indicates that these samples are younger than 4.3 Ma (base of Biozone PL2). In the bottom core of Hole U1460B (Sample 68F-CC; 306.65 m CSF-A), G. margaritae is present, indicative of the top of Biozone PL2 (3.85 Ma) (Tables T6, T9).
Benthic foraminifers
A total of 17 core catcher samples were investigated from Hole U1460A. Overall, the number of species present per sample ranged from 7 (Samples 356-U1460A-49F-CC and 53F-CC; 227.9 and 246.6 m CSF-A) to 35 (Sample 1F-CC; 2.13 m CSF-A). With the exception of the three uppermost cores from Hole U1460A (Samples 1F-CC through 9F-CC; 2.13–35.6 m CSF-A), the preservation of benthic foraminiferal tests was poor throughout Site U1460. Preservational damage ranged from abrasion and fragmentation (breakage) to occasional cementation (coating in secondary crystals). Species richness fluctuated slightly due to a combination of preservational damage and changing conditions at the sediment/water interface.
All Site U1460 samples largely yield the same species, but abundance of the dominant species varied in several intervals. Species of Cibicides spp. and Cibicidoides spp. were almost always present, but five foraminiferal assemblages are present downhole. All assemblages overlapped without clear boundaries, largely because they are based on the same selection of dominant species.
The first benthic foraminiferal assemblage is present from Samples 356-U1460A-1F-CC through 5F-CC (2.13–20.63 m CSF-A) and contains a range of shallow- and deeper water temperate species. The assemblage is dominated by infaunal taxa including U. peregrina and S. raphana with abundant Cibicidoides spp., Globocassidulina subglobosa, Miliolina spp., and Quinqueloculina spp. (Figure F16).
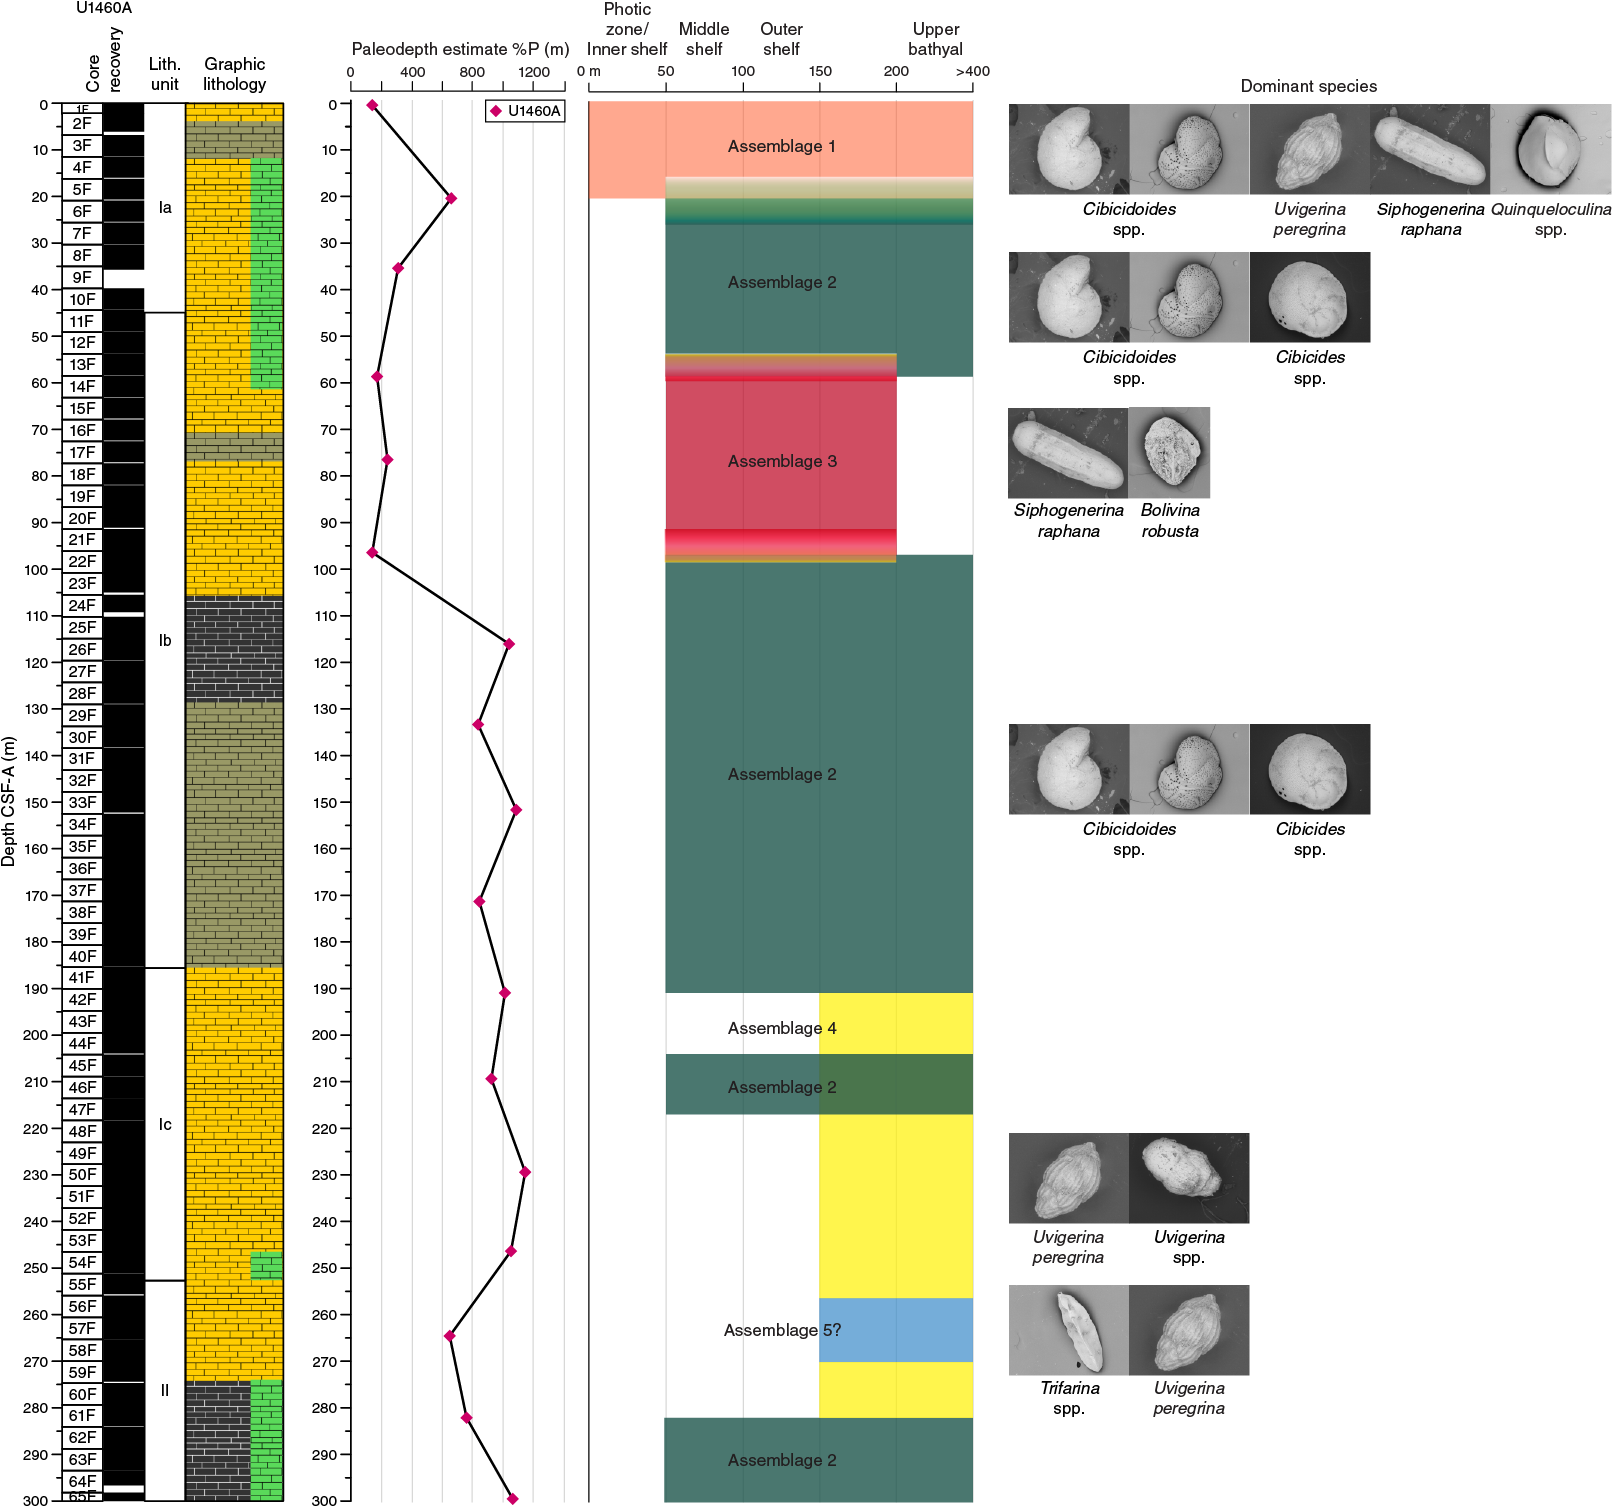
Figure F16. Dominant benthic foraminiferal species and assemblages, Hole U1460A. This figure is available in an oversized format.
The second assemblage is present from Samples 356-U1460A-5F-CC through 13F-CC (20.63–58.42 m CSF-A). This assemblage is marked by an abundance of Cibicides spp., Cibicidoides spp., and other rotalid epifaunal species, particularly Cibicides wuellerstorfi. This assemblage reappears in other sections of Hole U1460A, including Samples 21F-CC through 26F-CC (96.31–119.51 m CSF-A), briefly in Sample 45F-CC (208.85 m CSF-A), and from Sample 61F-CC (283.93 m CSF-A) to the bottom of the hole (Figure F16).
The third assemblage is present from Sample 356-U1460A-13F-CC through 21F-CC (58.42–96.31 m CSF-A) and is marked by the dominance of infaunal species S. raphana and Bolivina robusta (Figure F16). These species belong to the stress-tolerant group of smaller benthic foraminifers and might indicate increased organic input or upwelling on the shelf.
The fourth assemblage is present from Samples 356-U1460A-41F-CC through 53F-CC (190.19–246.67 m CSF-A) and is dominated by infaunal Uvigerina spp., particularly U. peregrina.
It is unclear as to whether there is an additional fifth assemblage because it is only found in one sample (356-U1460A-57F-CC; 265.31 m CSF-A). This assemblage is marked by a dominance of infaunal Trifarina spp. (Figure F16). This assemblage might be mixed by slumping deeper than 250 m CSF-A in Holes U1460A and U1460B (see Lithostratigraphy). Considering mass-wasting events identified in these intervals, this assemblage indicates a variable and stressful environment.
Overall paleodepth estimates (van Hinsbergen et al., 2005) range from outer shelf (Sample 356-U1460A-21F-CC; 96.31 m CSF-A) to upper bathyal (Sample 49F; 227.92.9 m CSF-A) (Tables T8, T10). Shallower depths are associated with Assemblages 1 and 3 and deeper depths with Assemblages 2 and 4 (Figure F16).
Table T10. Benthic foraminifer abundance, Site U1460. Download table in .csv format.
Benthic foraminifer percentage and diversity combined for all holes at Site U1460 are illustrated in Figure F17.
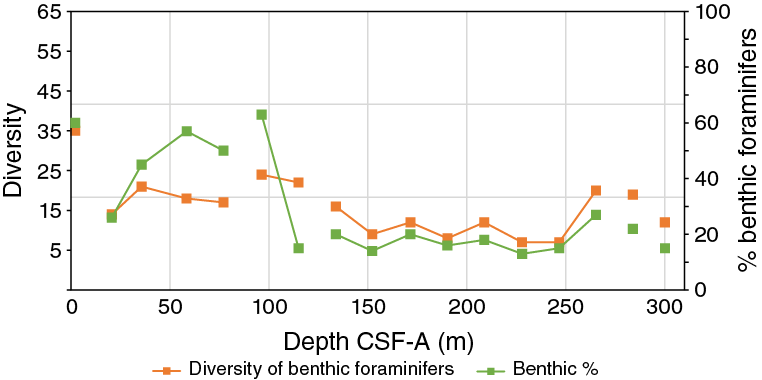
Figure F17. Benthic foraminifer diversity percentage of total foraminifers, Site U1460.
Other bioclasts
Sponge spicules were abundant in Hole U1460A. They were observed in all samples analyzed for benthic foraminifers but are more dominant in the upper two-thirds of Hole U1460A. During washing of sediments, the sponge spicules floated and accumulated on top of sediments of the 150–2000 µm size fraction. A spicule-rich example (Sample 356-U1460A-13F-CC) is shown in Figure F18.

Figure F18. Sponge spicules.
Ostracods were observed in low abundance in almost all analyzed samples and were common in Sample 356-U1460A-26F-CC (119.51 m CSF-A) (Table T8).
Geochemistry
At Site U1460, 64 samples were analyzed for headspace gas content and 31 samples (5 cm whole rounds) for interstitial water (IW) geochemistry and bulk sediment geochemistry (total organic carbon [TOC], carbonate, and total nitrogen [TN]). In general, elevated salinity characterizes the site, with values of 35 at the top, increasing with depth to values of 61 at 287 m CSF-A. Most of the major elements in the IW samples also exhibit increasing concentrations with increasing depth. The site is also characterized by high percentages of calcium carbonate (mean = 90 wt%) and low TOC (mean = 0.48 wt%) and TN (mean = 0.03 wt%).
Headspace gases
Headspace gas analysis for routine safety monitoring revealed the presence of methane in very low concentrations, with most samples ranging between 2 and 10 parts per million by volume (ppmv) (Figure F19; Table T11). Ethane was only detected in three samples at extremely low concentrations (<2 ppmv). No higher molecular weight hydrocarbons were detected.
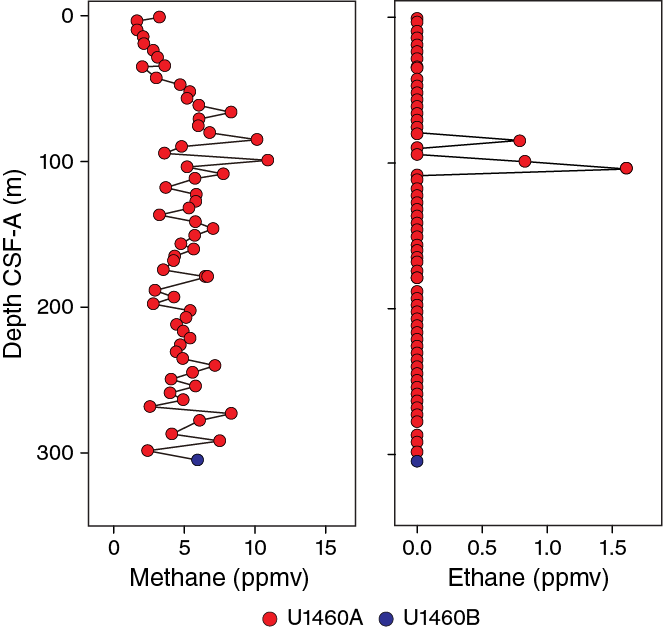
Figure F19. Hydrocarbons in headspace gases, Site U1460.
Table T11. Headspace gas contents, Site U1460. Download table in .csv format.
Interstitial water geochemistry
Alkalinity ranges from 3.4 to 8.8 mM and displays a pattern of generally increasing values with increasing depth until approximately 250 m CSF-A. From 250 m CSF-A to the bottom of the hole, a slight decrease in alkalinity is observed (Figure F20). pH ranges from 7.1 to 7.8, with the highest values observed at the top, and steadily decreases with depth. Salinity ranges from a value of 35 in the uppermost sediments and increases with depth, reaching a value of 61 at 287 m CSF-A.
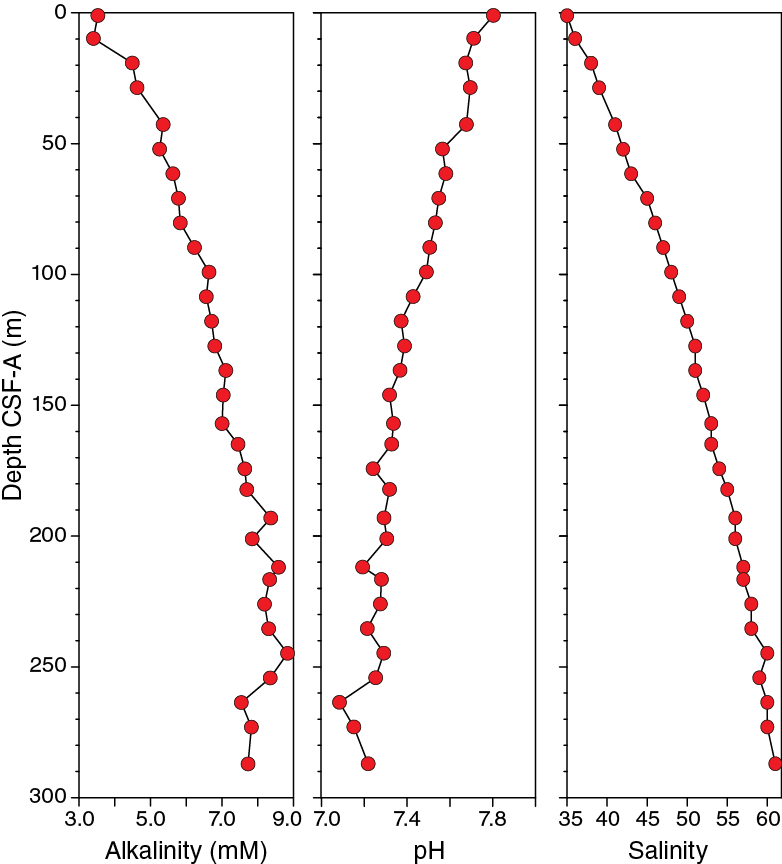
Figure F20. Alkalinity, pH, and salinity, Site U1460.
Major constituents bromide, calcium, chloride, magnesium, sulfate, and sodium exhibit increasing concentrations with depth (Figure F21). Sulfate concentrations are relatively constant in the upper 50 m and subsequently increase with depth. Potassium concentrations decrease slightly from the surface toward the bottom of the hole. Ammonium concentrations increase to ~100 m CSF-A, remain constant to ~170 m CSF-A, and then gradually decrease toward the bottom of the hole. Phosphate was present in IW samples at Site U1460 in low concentrations (<4 µM).
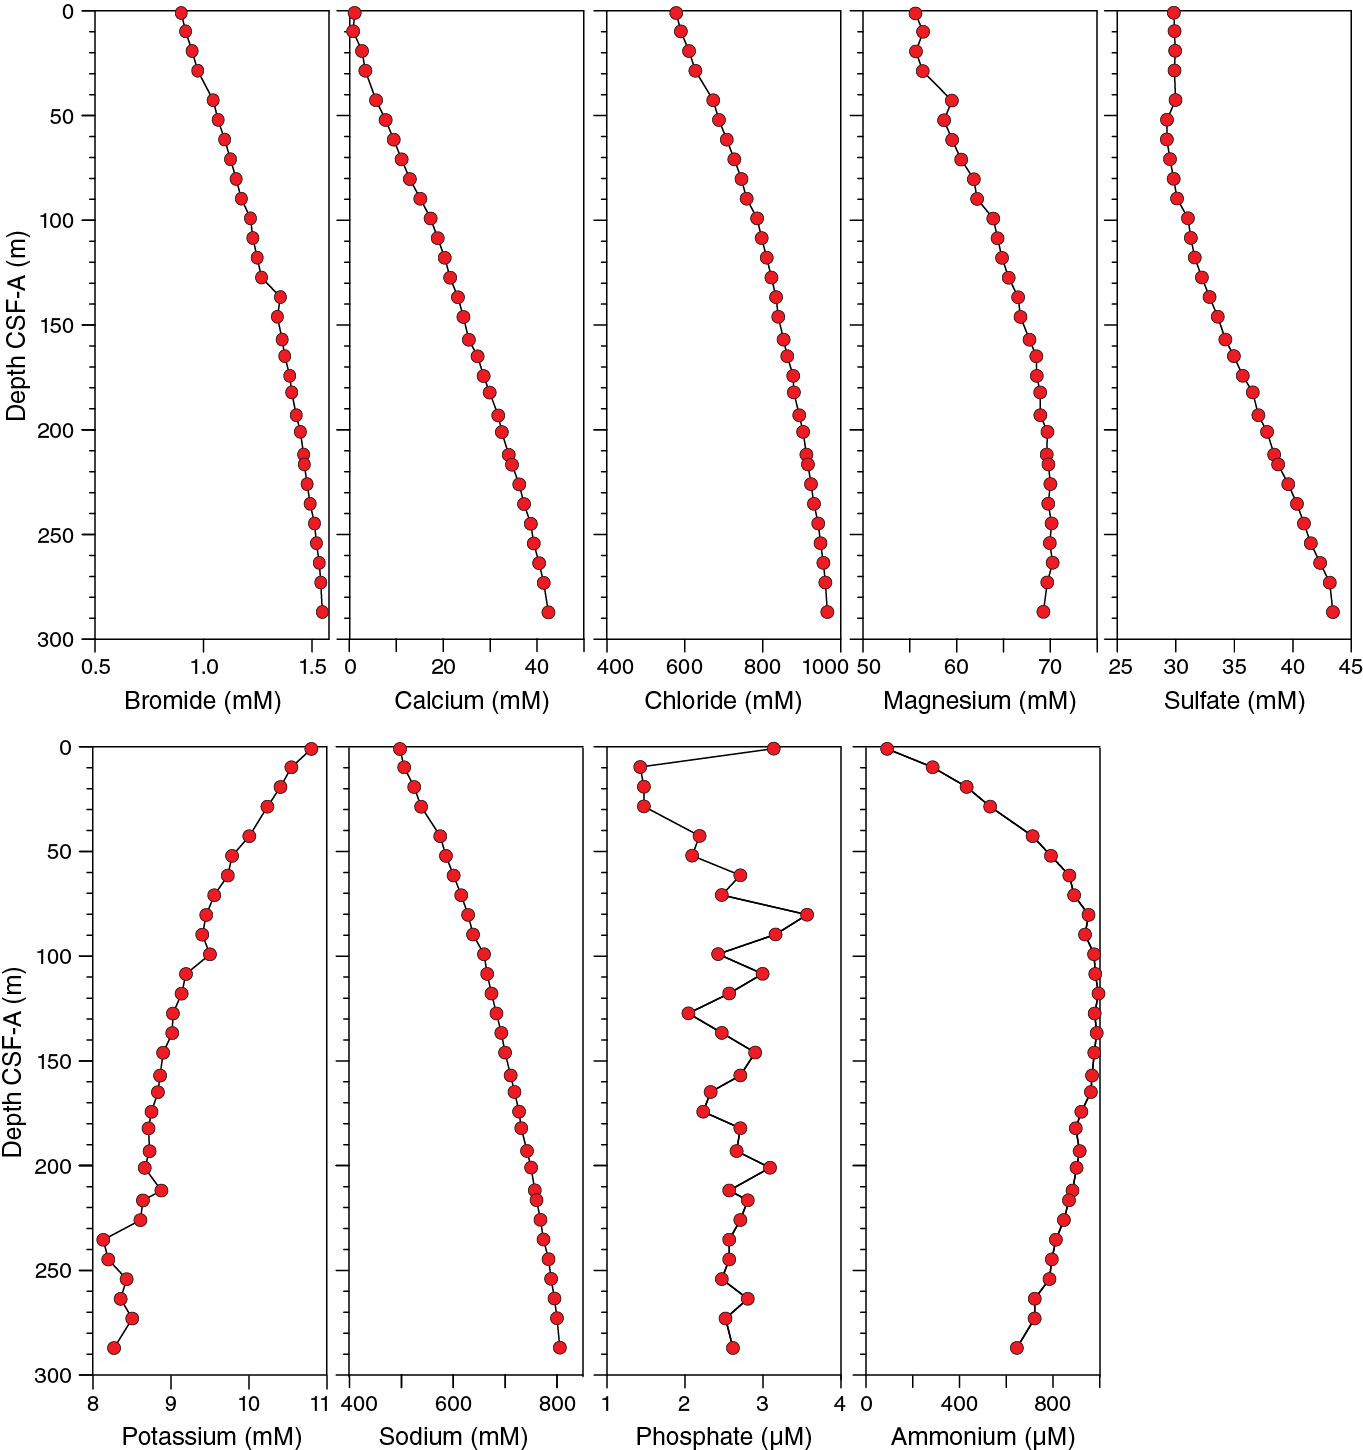
Figure F21. Major constituent interstitial water geochemistry, Site U1460.
The minor elements all exhibit different downcore patterns at Site U1460 (Figure F22). Barium and iron were present in IW samples in low concentrations (<5 µM). Strontium increases rapidly from the surface to 19 m CSF-A and then remains relatively unchanged to the base of the hole. Lithium displays a decreasing trend in the upper 52 m and then increases gradually toward the bottom. Silicon increases from the surface to a maximum at 137 m CSF-A. From 137 to 193 m CSF-A, silicon concentrations decrease followed by relatively stable values toward the bottom. Boron concentrations increase from the surface to 52 m CSF-A, remain relatively stable until 201 m CSF-A, and then gradually increase toward the base of the hole.
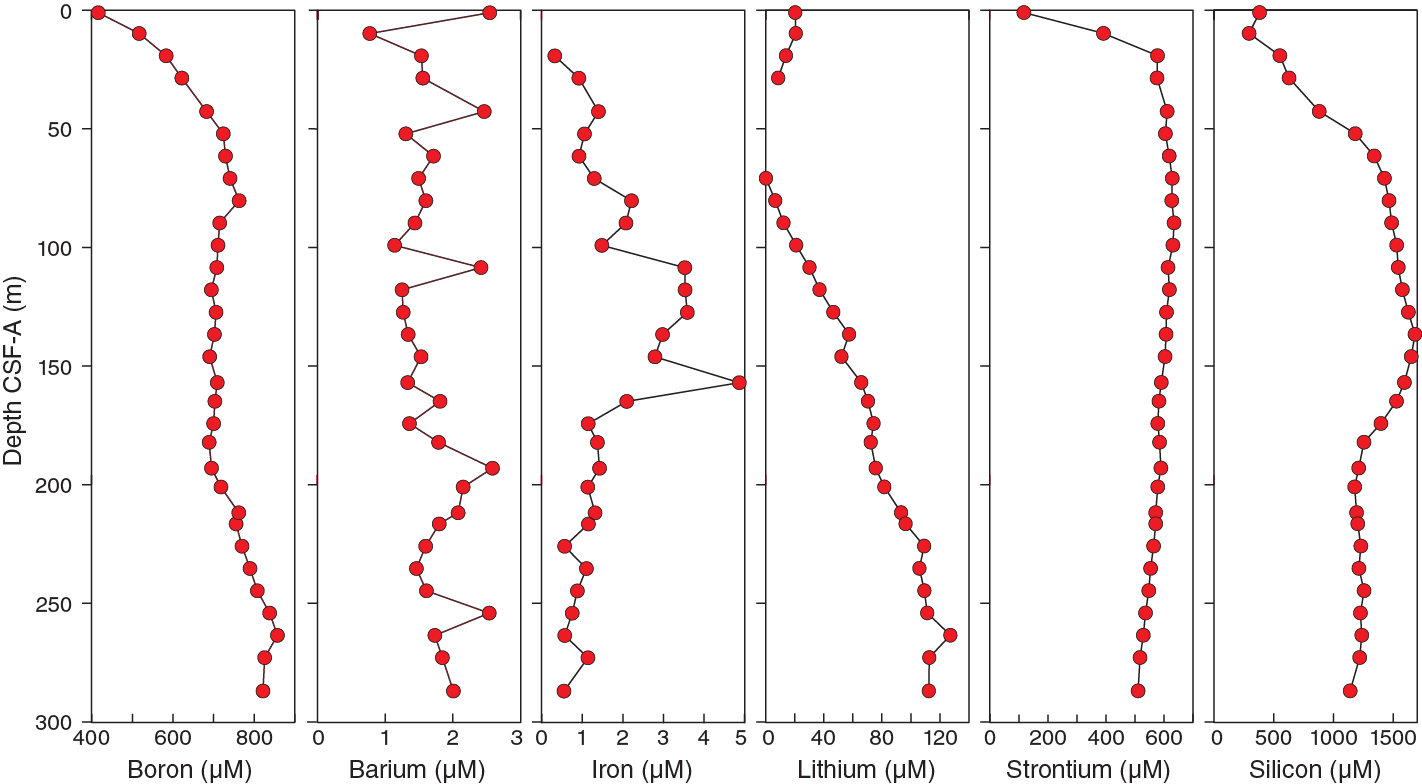
Figure F22. Minor element interstitial water geochemistry, Site U1460.
Bulk sediment geochemistry
Calcium carbonate content at Site U1460 is high and ranges from 71 to 94 wt% with a mean of ~90 wt% (Figure F23). TOC is low, ranging from 0.2 to 0.7 wt% with a mean of 0.48 wt%. The interval from 146 to 157 m CSF-A contains an excursion to lower TOC values. TN at Site U1460 is very low, ranging from 0.0001 to 0.0898 wt% with a mean of 0.03 wt%. TN was below detection limit in many samples, particularly deeper than 200 m CSF-A.
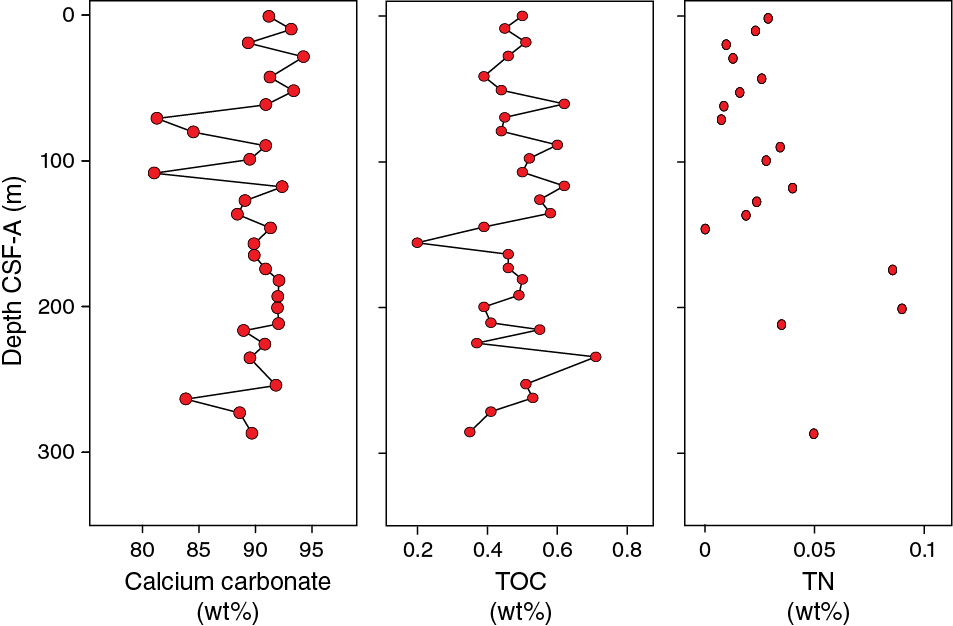
Figure F23. Bulk sediment geochemistry, Site U1460.
Paleomagnetism
Paleomagnetic investigations at Site U1460 included routine measurements and partial alternating field (AF) demagnetization of natural remanent magnetization (NRM) of archive-half sections and selected discrete samples from working-half sections of Hole U1460A. Hole U1460B was not measured because lithologic similarities to Hole U1460A indicated overlapping stratigraphy. Isothermal remanent magnetization (IRM) and backfield IRM curves from discrete samples provided coercivity of remanence values ranging from 40.7 to 67.0 mT. Further cumulative log-Gaussian (CLG) analysis indicated three components. Intensity values at this site ranged from 10−2 to 10−5 A/m after AF demagnetization to peak fields of 30 mT. Based on nannofossil-based age constraints (0.91 Ma at 129 m CSF-A), the possible polarity reversal at ~120 m CSF-A may be indicative of the Brunhes/Matuyama boundary (Chron C1n and Subchron C1r.1r [0.781–0.988 Ma]).
Archive-half measurements
NRM measurements of Hole U1460A archive-half sections were performed with progressive stepwise AF demagnetization to 30 mT (in 10 mT steps) at 10 cm resolution. Based on principal component analysis (PCA) (Figure F24), directions were generally attributed to the characteristic remanent magnetization after 30 mT. We measured 215 sections spanning the entire cored interval for the hole (300 m), excluding cores that were completely disturbed or contained fluidized sediment. It was not possible to recover oriented cores because they were drilled using the HLAPC system (see Operations), and consequently declination data are not reported or considered in magnetostratigraphy interpretations.
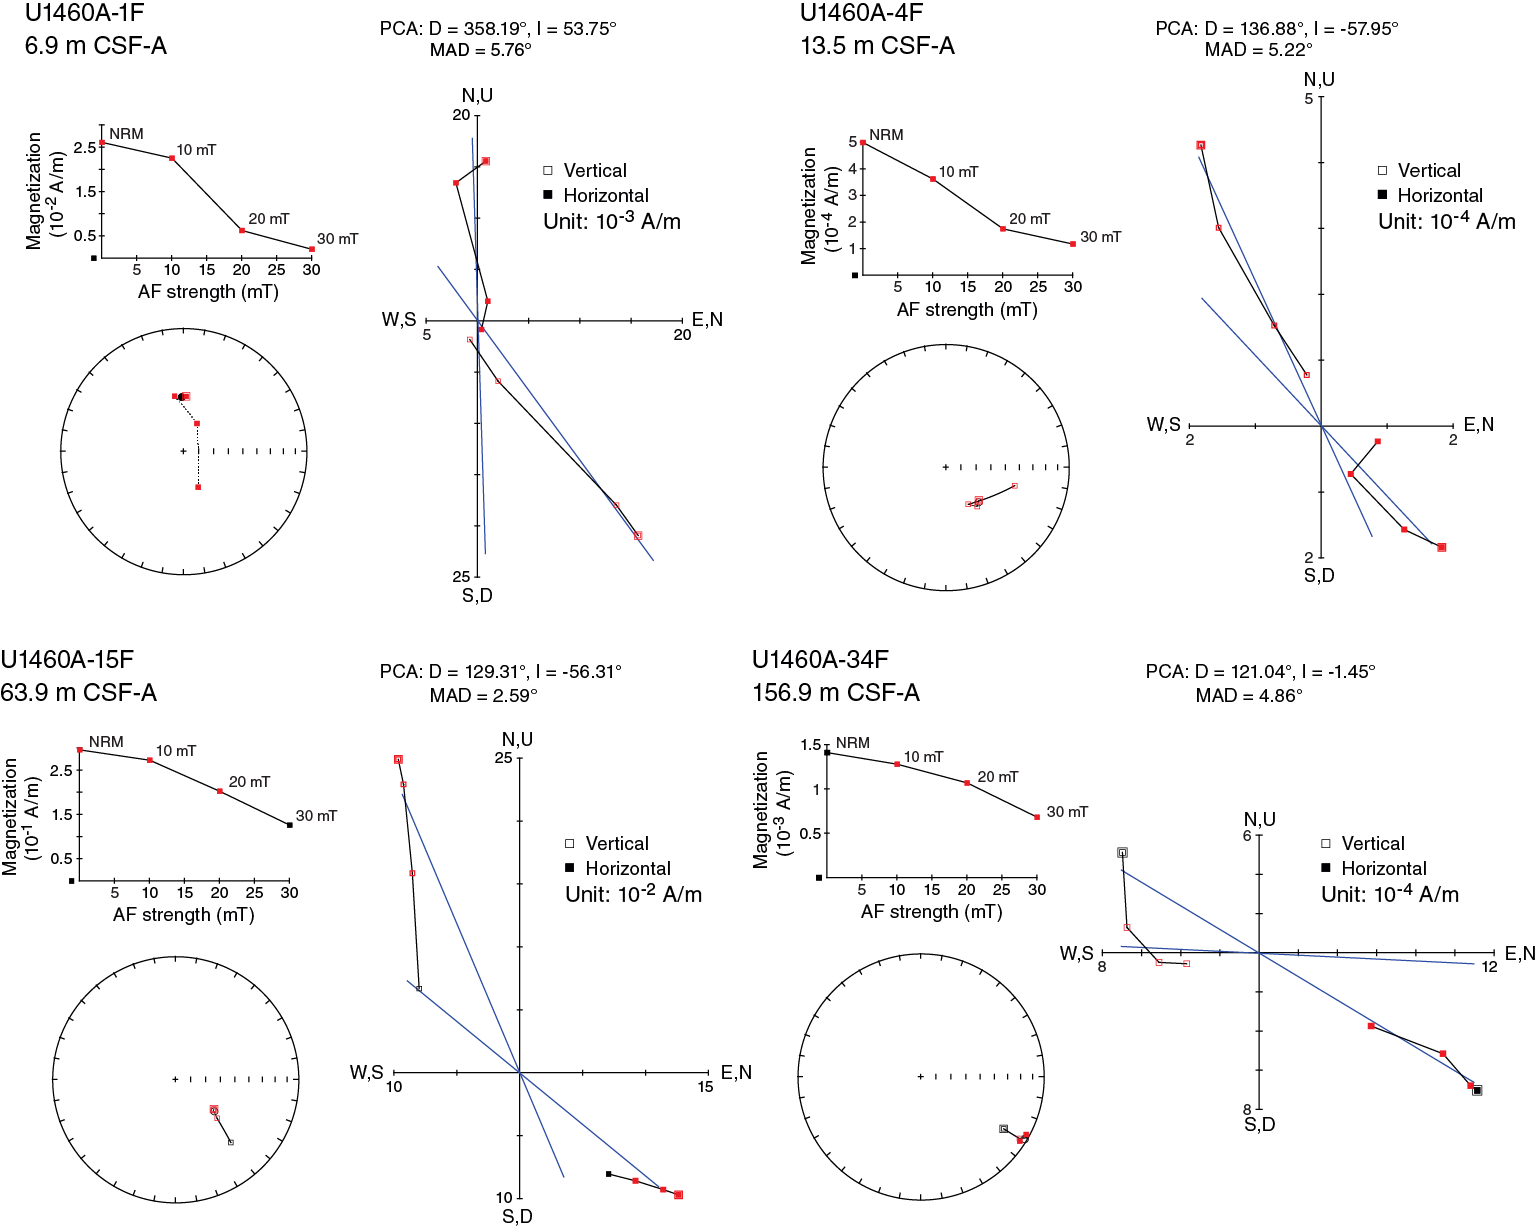
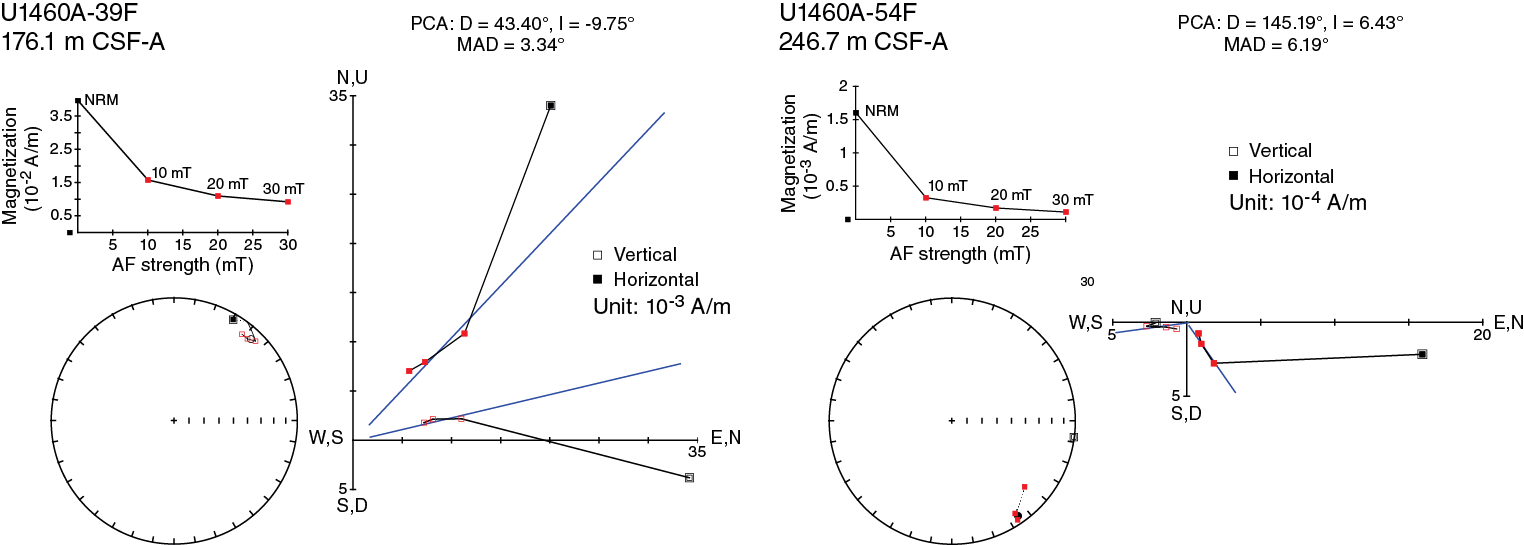
Figure F24. AF demagnetization results from archive-half core sections at 6 depths, Hole U1460A.
Discrete sample measurements
We collected one discrete cube sample per two cores from Cores 356-U1460A-2F through 65F, depending on recovery and core conditions (see Paleomagnetism in the Expedition 356 methods chapter [Gallagher et al., 2017a]), resulting in a resolution of about one discrete sample per 10 m of core. Discrete samples from 12 selected cores distributed throughout Hole U1460A were measured using the superconducting rock magnetometer in-line AF demagnetizer in 10 mT steps up to a peak field of 80 mT (Figure F25). AF demagnetization behavior was used to verify the reliability of the split-core measurements and to determine the representative demagnetization behavior of the recovered sediments.
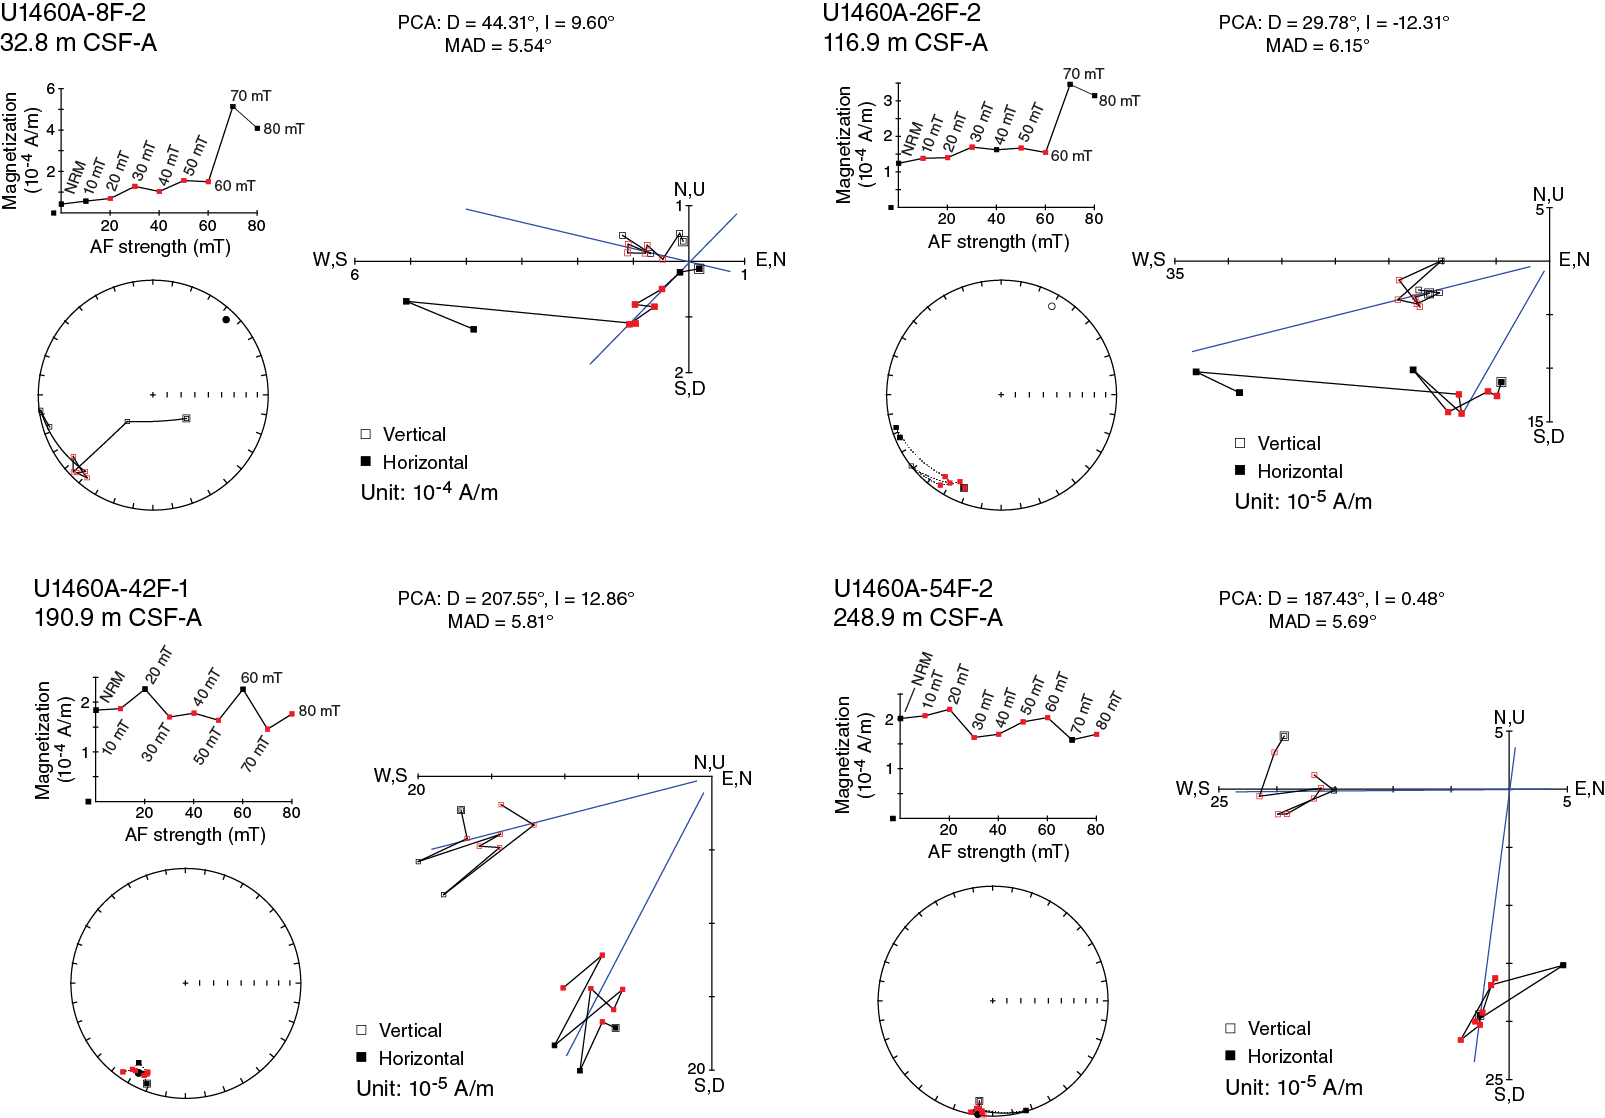
Figure F25. AF demagnetization results from discrete samples at 4 depths, Hole U1460A.
To provide a better understanding of the magnetic coercivity content, IRM acquisition curves from representative samples were generated using an IM-10 impulse magnetizer (ASC Scientific) (Figure F26). Magnetization was induced in varying steps (0 to ~1200 mT) along the z-axis of discrete samples, which were previously demagnetized at 180 mT. At each step, induced magnetization was measured using the JR-6A spinner magnetometer. To provide information on the individual magnetic coercivity content, which may be associated with the NRM carriers, IRM curves were modeled for selected samples using a CLG function according to Kruiver et al. (2001) (Figure F27). For example, Sample 356-U1460A-4F-3, 58–60 cm, was fit with three components. Two of the components exhibited low magnetic coercivity behavior (B1/2 = 7.9–56.2 mT), which fits 81% of the signal, indicating a granulometric distribution related to magnetite and/or titanomagnetite. Component 1 (pink in Figure F27) provided a dispersion parameter value of ~0.3 associated with multidomain magnetite grains (Robertson and France, 1994). The third component exhibited high-coercivity behavior (B1/2 = 263 mT), which suggests the presence of hematite and/or goethite. Backfield IRM measurements were also performed on selected samples (Figure F28) to identify the coercivity of remanence (Hcr) parameter for the magnetic carriers present in discrete samples. The backfield IRM curve shows that the Hcr values for these four samples range from 40.7 to 67.0 mT.

Figure F26. IRM acquisition curves for 4 discrete samples.
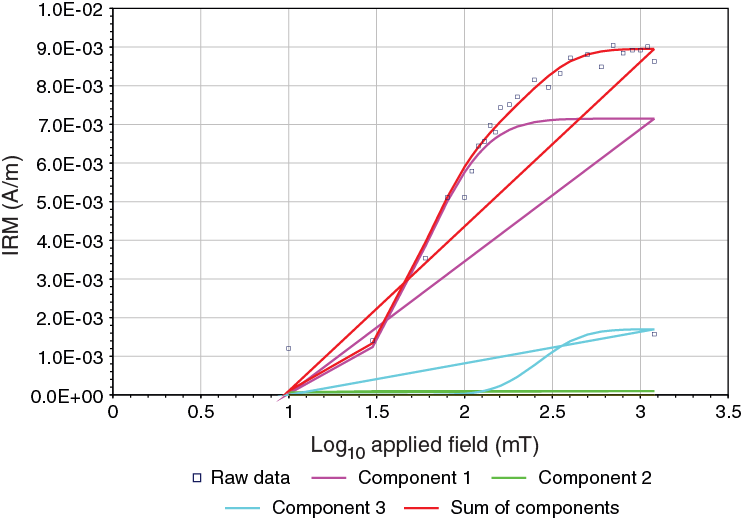
Figure F27. CLG analysis of IRM curve of one discrete sample.
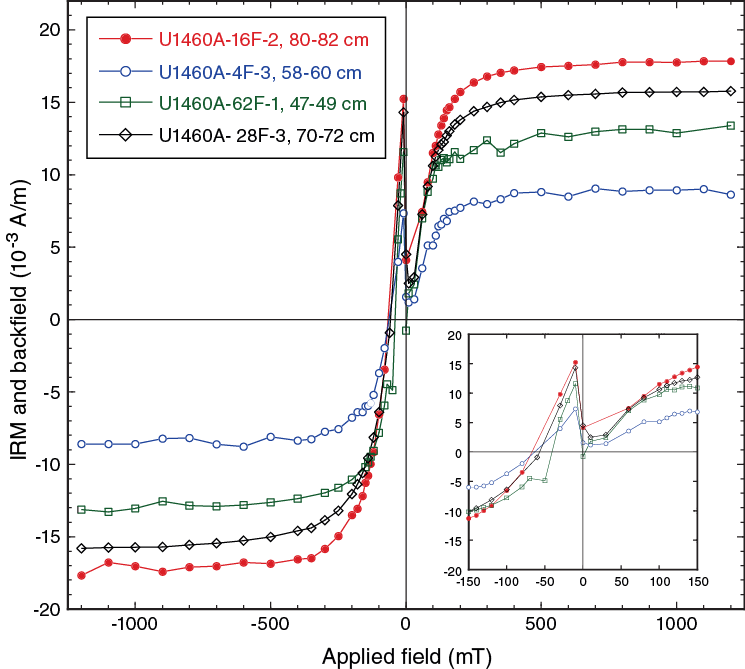
Figure F28. IRM acquisition curves for 4 discrete samples plotted with their respective backfield curves.
Magnetostratigraphy
In Hole U1460A, sediments exhibit residual NRM intensity values ranging from 10−2 to 10−5 A/m after AF demagnetization with peak fields of 30 mT (Figure F29). Higher intensity peak values (~1 A/m) were observed throughout the whole succession and can be related to pervasive drilling-induced magnetization that is commonly encountered (e.g., Gee et al., 1989). Site U1460 sediments were considerably less altered than those at Site U1459 (see Lithostratigraphy); however, the magnetic signal is not distinguishable shallower than 119 m CSF-A and generally clusters in the normal (negative inclination) polarity range. There is a distinct peak of positive magnetic inclination (reversed polarity) at ~119–129 m CSF-A. Based on the presence of the calcareous nannofossil R. asanoi (see Biostratigraphy and micropaleontology) at ~129 m CSF-A, this period of reversed polarity may be younger than 0.91 Ma, constraining it to Subchron C1r.1r (0.781–0.988 Ma) (Gradstein et al., 2012).
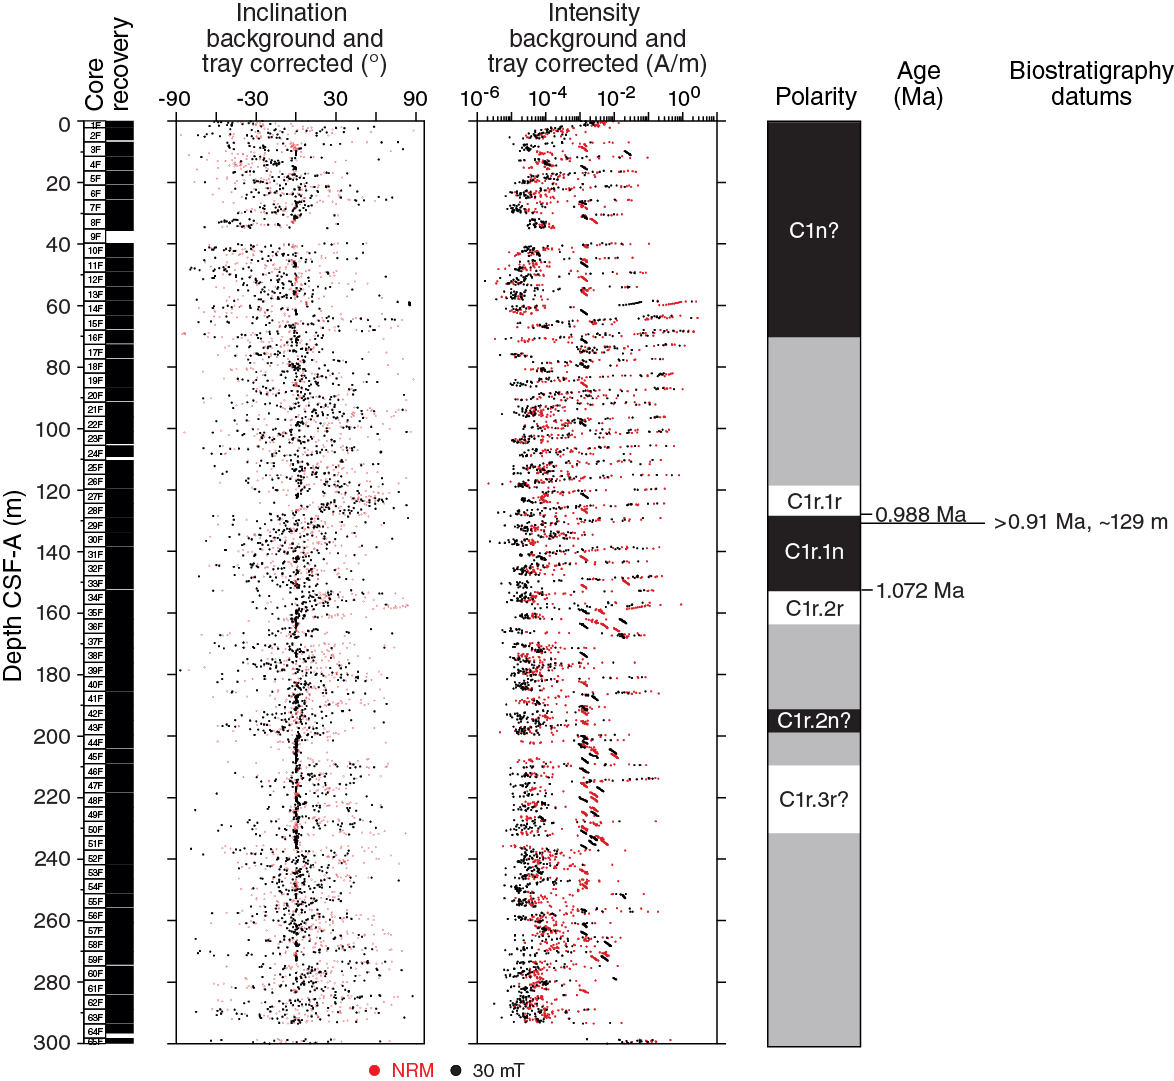
Figure F29. Magnetostratigraphic data set, Hole U1460A.
Above and below the interpreted Subchron C1r.1r at 119 m CSF-A, there is some evidence of other periods of normal and reversed polarities. Inclination values from 87 to 101 and 153 to 158 m CSF-A also exhibit reversed polarities, but they are less well defined than the peak between 119 and 129 m CSF-A (Figure F29). There are also two possible distinguishable normal polarity intervals from 101 to 119 and 129 to 153 m CSF-A. To summarize, the pattern seen in the inclination data may be interpreted as normal polarity from 0 to 87 m CSF-A, followed by three successive reversed polarity intervals, separated by two normal polarity intervals. It is possible that these features could be associated with Subchrons C1r.1r (0.781–0.988 Ma), C1r.1n (0.988–1.072 Ma), C1r.2r (1.072–1.173 Ma), C1r.2n (1.173–1.185 Ma), and C1r.3r (1.185–1.778 Ma) (Gradstein et al., 2012). However, the relative lengths of each polarity interval reflected by the data imply large changes in sedimentation rate. More in-depth analysis must be carried out before a more detailed and dependable magnetostratigraphy can be provided.
Physical properties
Core recovery at Site U1460 was very high (97%), so physical properties measurements were clearly able to demonstrate how these parameters vary with depth. Magnetic susceptibility (MS) shows large-scale trends that are similar between both Holes U1460A and U1460B and between the Whole-Round Multisensor Logger (WRMSL) and Section Half Multisensor Logger (SHMSL). All MS records showed a general decrease of ~2 SI from the top to 180–200 m CSF-A. From that depth to the bottom of both holes (300.08 and 306.65 m CSF-A, respectively), an increase of 1–2 SI is observed in all MS records. However, the meter-scale variability was not consistent from hole to hole and between the two loggers. The NGR data are characterized by strong variations with amplitudes up to 30 counts/s that can be correlated between the holes at vertical scales of tens of meters, despite measuring at different resolutions between Holes U1460A (every 10 cm) and U1460B (every 20 cm). Moreover, a few hardground and condensed layers produced major peaks in the NGR data (>140 counts/s), facilitating accurate correlation of these layers. However, for correlation on a core-to-core basis using the NGR data, higher resolution (10 cm) data from both holes are preferable (see Stratigraphic correlation). Porosity decreased from 50%–60% at the top to 39%–49% at the bottom of the holes. We calculated correlation coefficients between the downhole decrease in porosity and the downhole increases in P-wave velocities (R = 0.405), bulk densities (R = 0.88), and thermal conductivities (R = 0.67). These results suggest that the long-term variations in these properties may be, in part, due to compaction. In situ temperature measurements were made in Hole U1460B to complement the thermal conductivity measurements. This allowed for calculation of the geothermal flux (62 mW/m2). We also experimented with the number of MS measurements per position on the SHMSL and found that at least two averaged measurements per position are required to produce useful data for these carbonate sediments.
Magnetic susceptibility
Recovery from Holes U1460A and U1460B was excellent at about 97% for both holes. MS was measured twice, once on the WRMSL at 5.0 cm intervals and once as point magnetic susceptibility (MSP) measurements on the SHMSL at 2.5 cm intervals. A generally stable to slightly decreasing trend in MS was seen in the 50-point moving average curves from the surface to 170–200 m CSF-A, depending on the tool and the hole (Figure F30). MS measured on the WRMSL showed an increase between 180 m CSF-A and the bottom of Hole U1460A (~300 m CSF-A). MS increased gradually in the bottom 120 m of Hole U1460A, whereas a two-fold stepwise increase was observed in Hole U1460B. The MSP data of Hole U1460A (measured on the SHMSL) confirmed a gradual increasing trend in the lowermost 100 m of the hole. The MSP data of Hole U1460B showed a significant step to higher MS values at about 170 m CSF-A. Although this stepwise behavior was also observed in the WRMSL data for this hole, the step in the SHMSL data occurred about 10 m higher than in the WRMSL data.
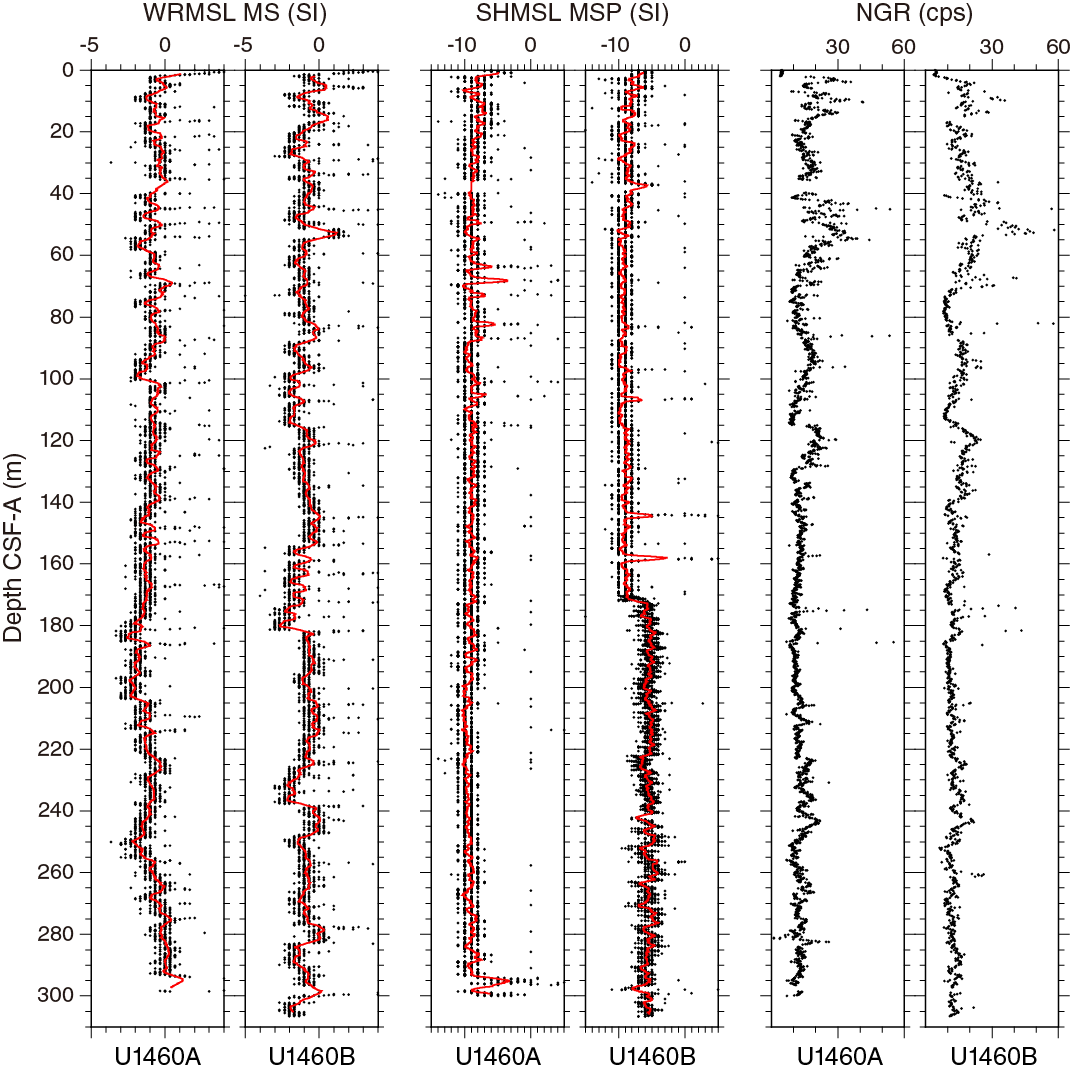
Figure F30. WRMSL MS, SHMSL MSP, and NGR results, Site U1460.
As mentioned in Physical properties in the Site U1459 chapter (Gallagher et al., 2017b), the low-precision setting for the MSP measurements on the SHMSL (a single measurement per position) prevented a detailed comparison of MS data obtained by the WRMSL and the SHMSL. During shipboard measurements of Hole U1460B, different settings were used to run the SHMSL. Between the top of the hole and Section 356-U1460B-38F-2 (172.12 m CSF-A), only one measurement was made per position. Between Sections 38F-3 and 53F-2 (242.31 m CSF-A), three MS measurements were made and averaged per position. Below that section to the bottom of the hole, two MS measurements were taken and averaged. Figure F31 shows the effect of the number of MS measurements on data quality and measurement time per section. The low-precision single measurement setting did not allow for detailed comparison or for interpretations. Using three measurements per position dramatically increased data quality. However, the data obtained with the two and three measurements per position setting exhibited consistently lower MS values near section boundaries. We ascribed this pattern to a drift in instrument readings during the measurement of every section half, because the vast majority of the sections in question were filled with homogeneous sediment.
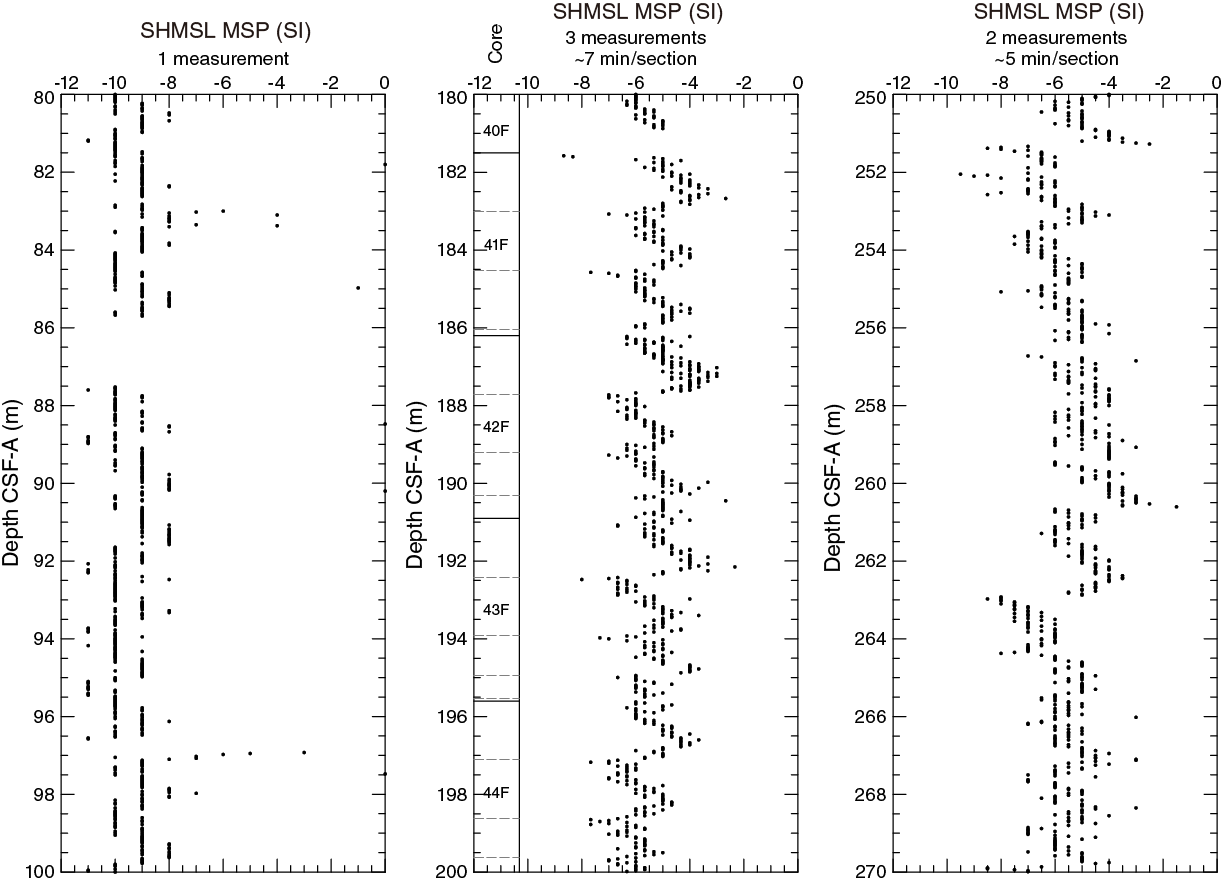
Figure F31. The effect of changing the number of MSP measurements taken at each position on the SHMSL, Site U1460.
Natural gamma radiation
NGR was measured at 10 cm intervals in Hole U1460A and at 20 cm intervals in Hole U1460B (Figure F30). NGR counts obtained from the cores showed considerable similarities between the two holes. Several distinct peaks were evident and proved valuable for correlation between holes (see Stratigraphic correlation). The peaks occurred at 10, 50, 85, 95, 120, and 175 m CSF-A in both Holes U1460A and U1460B. On average, variability in NGR counts decreased with depth. Several distinct peaks in NGR counts look like artifacts, but close inspection of the core suggests that they are not. For example, high NGR counts (>140 counts/s) occurred at 174.6 (Sample 356-U1460A-38F-3, 30 cm) and 173.8 m CSF-A (Sample 356-U1460B-39F-2, 20 cm). These depths correspond to major hardgrounds (see Lithostratigraphy). Section 356-U1460B-66F-3 was not measured for NGR because this section was affected by drilling distortion and would not have produced useful measurements.
P-wave velocity
P-wave velocity was measured on whole cores from both holes at Site U1460 using the WRMSL and on discrete samples from Hole U1460A split cores. P-wave velocity measurements from the split cores were relatively invariant in the upper 140 m of Hole U1460A at ~1620 m/s and then slowly increased with depth from ~140 to 260 m CSF-A, where they reached ~1720 m/s (Figure F32). In the deepest portion of the hole (deeper than 240 m CSF-A), P-wave velocity measurements rose to 1860 m/s. The overall average P-wave velocity was 1698 m/s. The gross changes in velocity in the cores from the two holes were generally reflected in both bulk density and porosity, which increased and decreased downhole, respectively, to ~140 m CSF-A (Figure F33). In general, P-wave velocities measured using the WRMSL were slightly lower than those measured on the split core, and only the highest WRMSL velocity measurements corresponded to the discrete measurements. Most measurements made on the split core required manual selection of the first arrival time (see Physical properties in the Expedition 356 methods chapter [Gallagher et al., 2017a]). It is likely that the manual approach was more accurate than the automatic first-arrival selection made by the WRMSL and that this is the source of the difference between the two methods.

Figure F32. P-wave velocity, penetrometer, and shear strength results, Site U1460.

Figure F33. Bulk density, grain density, and porosity, Site U1460.
Gamma ray attenuation
Gamma ray attenuation (GRA), measured every 5 cm on the WRMSL, was used to estimate bulk density. GRA showed an overall increase with depth in both Holes U1460A and U1460B (Figure F33). Additionally, these data are consistent with results obtained from discrete moisture and density (MAD) measurements (see Moisture and density). Bulk density was relatively stable at about 1.75 g/cm3 to 155 m CSF-A. The higher frequency variations fluctuated by about ±0.15 g/cm3. At ~115 m CSF-A, both holes show a sharp drop below and then return to approximately background bulk densities. However, the only discrete measurement of density at around this depth (Sample 356-U1460A-2F-2, 71 cm) was 1.77 g/cm3, which was not significantly different than other discrete measurements above and below this depth.
Moisture and density
Discrete samples were obtained at an interval of one per core in Hole U1460A and one sample per ~4–5 cores in Hole U1460B. These samples were generally taken from the middle of the core where evidence of disturbance was low and, in the case of Hole U1460A, at locations where smear slides were also taken (see Lithostratigraphy). Discrete bulk density measurements compare very well to GRA estimates of bulk density in both Holes U1460A and U1460B (Figure F33). However, discrete results tended to correspond to the lower GRA bulk density estimates.
GRA and MAD results suggest a cyclic pattern in the upper 180 m of both Holes U1460A and U1460B (Figure F33). In each of these cycles, density first increases rapidly downhole followed by a significantly slower decrease. The cycles may be lithologically controlled because decreasing bulk density is incompatible with the expected compaction of sediments with burial depth.
Grain densities began relatively high, with values of ~2.77 ± 0.2 g/cm3 near the surface but decreased to ~2.70 ± 0.03 g/cm3 by 100 m CSF-A before increasing again from ~173 m CSF-A (Figure F33). These variations could be due to primary mineralogy or to the composition of authigenic mineralization.
Porosity decreased with depth (Figure F33). Porosity generally ranged between 50% and 60% from the surface to ~210 m CSF-A. Porosity values of about 50% were seen from 210 to 250 m CSF-A. Deeper than 250 m CSF-A to the base of the holes, porosity ranged from 39% to 49%. Some of the changes seen in P-wave velocity, thermal conductivity, and bulk density can be ascribed to compaction and loss of porosity. Correlation coefficients for each of these parameters as compared with the MAD discrete porosity results in Hole U1460A were very strong for GRA bulk density (R = 0.88, based on 63 measurements taken within 2 cm of the corresponding MAD sample), quite good for thermal conductivity (R = 0.67, based on 81 measurements taken at 23 locations), and weak for P-wave velocity (R = 0.405, based on 14 measurements taken within 30 cm of the corresponding MAD sample).
Reflectance spectroscopy and colorimetry
The reflectance spectroscopy and colorimetry data in the upper parts of Holes U1460A and U1460B (0–50 m CSF-A) showed considerable variability over short stratigraphic intervals (Figure F34). Subsequent variations tended to have patterns that were unique to each index but similar between the two holes, making them ideal for correlation between holes. Longer term trends are less consistent between holes. For example, a long-term fall in a* from about 58 to 140 m CSF-A in Hole U1460B is less pronounced in Hole U1460A. In addition, a sudden jump in a* to a broad peak between 190 and 240 m CSF-A in Hole U1460B is not observed in Hole U1460A.

Figure F34. Color reflectance ratios, Site U1460.
Discrete stress measurement
Discrete measurements of shear and normal stress were taken only in Hole U1460A. These measurements were taken where sediments were soft enough to use the handheld Torvane and the pocket penetrometer. These two measurements of strength tend to show similar trends (Figure F32). That is, the sediments were relatively weak from the surface to ~40 m CSF-A and from ~120 to 200 m CSF-A. Higher material strengths were seen from ~40 m CSF-A to about 120 m CSF-A and from ~200 m CSF-A to the bottom of the hole.
Thermal conductivity, temperature,
and heat flux
Thermal conductivity measurements were performed on every two to four cores (usually in Section 2) in both Holes U1460A and U1460B by inserting the thermocouple needle into a hole drilled in the core liner of the whole-round cores before they were split. Three independent measurements were made for each run and the mean and standard deviation determined. Results ranged from 1.0 to 1.5 W/(m·K) with means of 1.16 W/(m·K) in Hole U1460A and 1.18 W/(m·K) in Hole U1460B (Figure F35B), but conductivity clearly increased with depth in both holes.
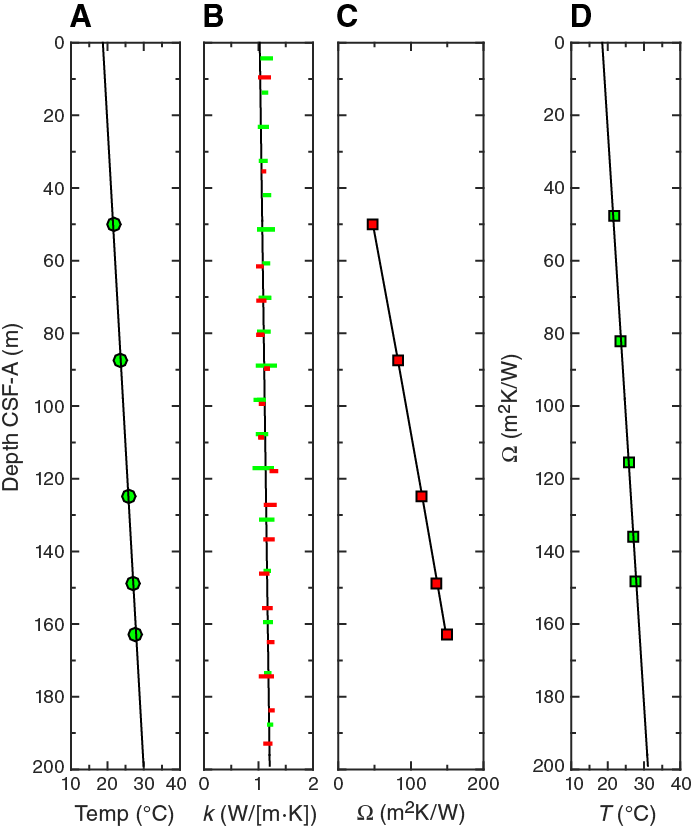
Figure F35. A. APCT-3 in situ temperature. B. Thermal conductivity. C. Depth vs. thermal resistance. D. Thermal resistance vs. temperature.
Independently, in situ temperature was measured using the APCT-3 in Hole U1460B. Core recovery and other drilling indicators from Hole U1460A were used to estimate which Hole U1460B cores would be most suitable for deployment of the APCT-3. Excellent temperature records were obtained in Cores 356-U1460B-12F and 20F, in which the characteristic peak in temperature during penetration of the core barrel was found (Figure F36A). However, the temperature records obtained from Cores 28F, 33F, and 36F displayed uncharacteristic behavior, in which the temperature slowly increased over a period of several seconds before cooling, never reaching the characteristic peak before cooling (Figure F36B). We suggest that this may have been caused by the coring tool slowing and coming to a gradual, instead of sudden, stop. Nevertheless, extrapolation of the cooling curves to a longer timescale was successful and extracted the ambient temperature (Figure F35A). Five temperature estimates were extracted to 162.7 m CSF-A, showing a linear increase with depth with a gradient of 56.47°C/km. Using a Bullard-type analysis (Figure F35D) we found that thermal resistance linearly increased with temperature. This is indicative of a very reliable estimate of the heat flux unperturbed by internal heating and fluid flow. The estimated geothermal flux is 62 mW/m2.
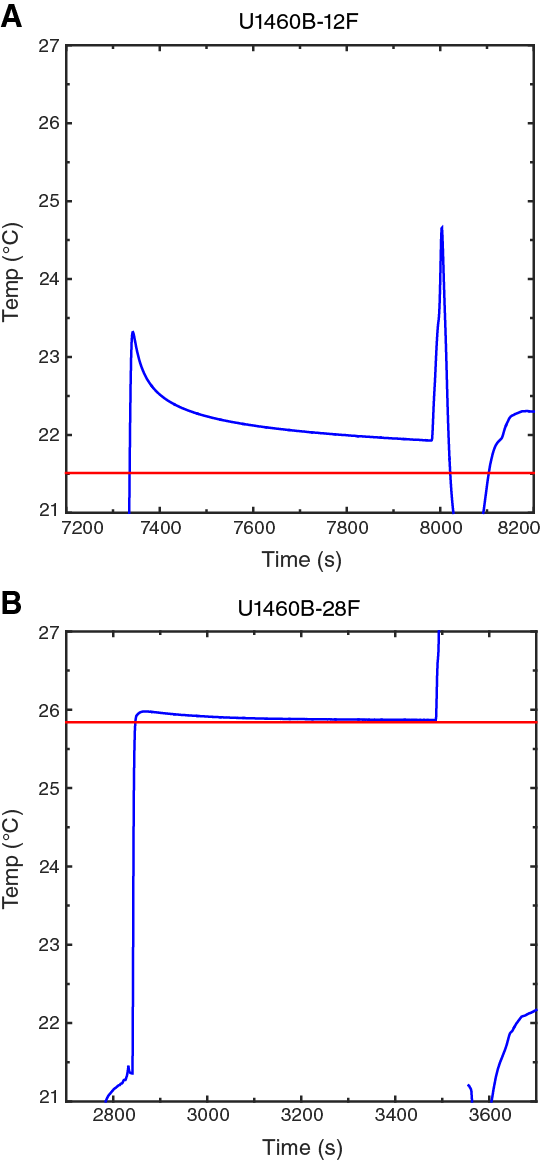
Figure F36. Temperature as a function of time in the coring shoe using the APCT-3.
Downhole measurements
No logging was attempted at this site.
Stratigraphic correlation
Two holes were cored at Site U1460. Recovery in both holes was good, with the exception of a low-recovery interval in Core 356-U1460A-9F (35.7–39.7 m CSF-A) at the top of Hole U1460A. Both holes were drilled with the HLAPC system, resulting in more numerous gaps between cores. Because of these gaps together with considerable lithologic variation between holes, detailed correlation between holes could not be performed. However, cores from Holes U1460A and U1460B are generally at similar depths in the hole, and sedimentary features (hardgrounds and mass wasting) were identified as intervals that should be avoided in each core when sampling.
Coring in Hole U1460B was guided by the examination of 10 cm resolution MS and GRA data gathered on cores from Hole U1460A using the Special Task Multisensor Logger (STMSL). For example, Core 356-U1460B-5F was cut short to a length of 3 m to reduce the chance of coincident gaps between the two holes (Figure F37). Core 356-U1460B-10F (36.3–40.59 m CSF-A) recovered a coring gap (35.7–39.7 m CSF-A) produced by low recovery in Core 356-U1460A-9F as the result of coring a hardground.
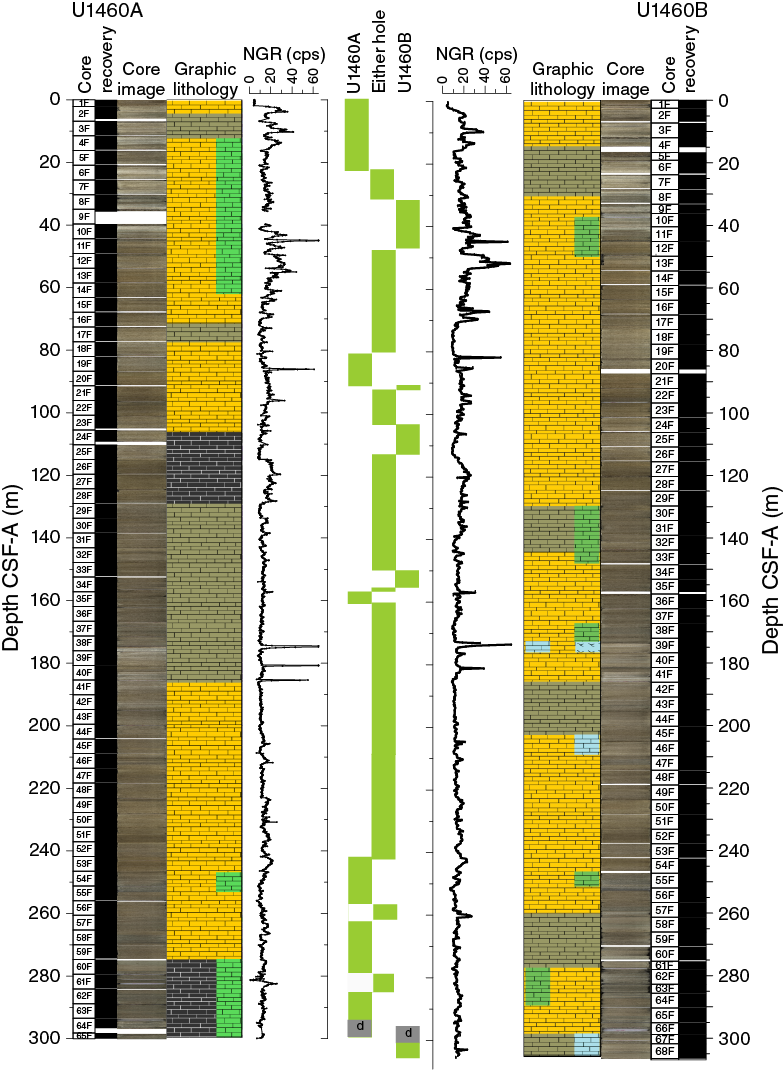
Figure F37. Suggested intervals for continuous sampling, Holes U1460A and U1460B.
Correlation was attempted between Holes U1460A and U1460B using NGR, which was run at 10 cm resolution on all Hole U1460A cores and at 20 cm resolution on Hole U1460B cores. Correlations were enhanced by comparison of NGR to GRA data collected on the STMSL and b* collected on the SHMSL. MS data were not used because the high values present at the top of each core are thought to be related to drilling. Coring through hardgrounds can create problems with core integrity that can lead to reduced confidence in the correlations between holes. Many of the cores had rubble at the top, indicating either fall-in from the upper part of the hole during coring or alteration during handling. For example, when drilling through hard intervals, the sediments were often watery and when liners were tilted on the catwalk to prevent sediment from flowing out, graded bedding was falsely generated. This frequently occurred with rubbly cores. Finally, when attempting HLAPC coring on hardgrounds, softer material was sometimes sucked into the core (flow-in) instead of penetrating the hard surface. Therefore, correlations of peaks at many core tops (rubble) and bottoms (flow-in) are not reliable. Calibration of the correlation to core photos and lithologic descriptions was attempted, but the considerable lithologic variation across the two holes, especially in the lower parts of the holes where debris flows were found (Core 356-U1460A-55F; Cores 356-U1460B-56F through 58F, 60F, 64F through 65F, and 67F through 68F; see Lithostratigraphy), led to a composite built more on speculation than certainty. After several attempts, it was concluded that the records were not sufficient for the precise correlation necessary to create a splice. In addition, gaps associated with coring hardground surfaces using the HLAPC also confounded attempts to generate a continuous correlation or a spliced record. Instead, likely depth equivalents and tentative correlations are presented for Holes U1460A and U1460B (Figure F37).
Integration of the data from both holes indicates that the oldest sediments recovered were of Pliocene age (Figures F38, F39). The exact position of the Pliocene/Pleistocene boundary could not determined within the sampling resolution utilized by the biostratigraphers, but Pliocene material is present in the basal units of Holes U1460A and U1460B and correlates to the lower part of Unit II (see Lithostratigraphy). The remainder of Unit II and all of Unit I is Pleistocene to Holocene in age (see Biostratigraphy and micropaleontology).
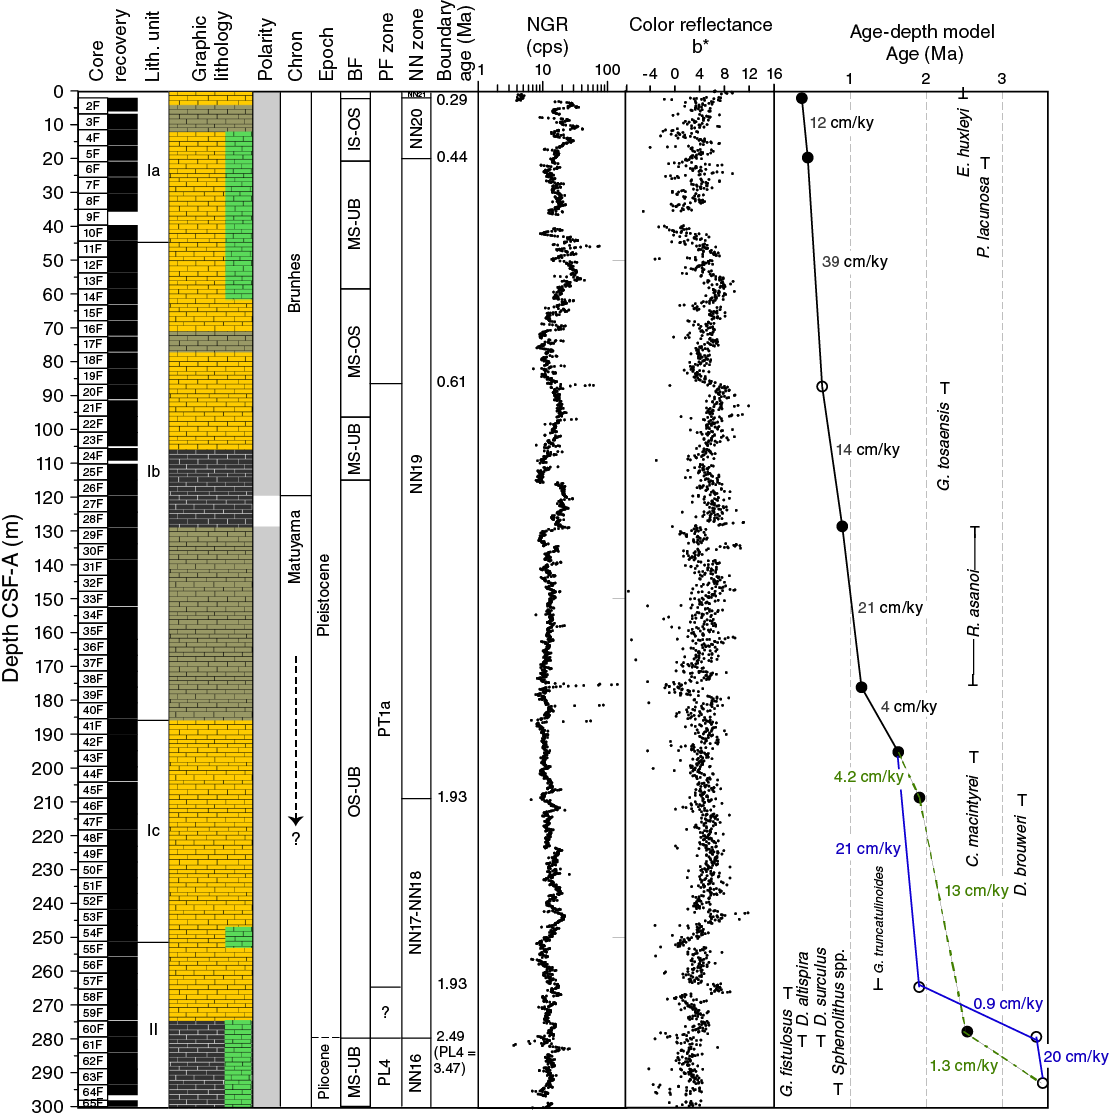
Figure F38. Hole U1460A lithology summary with NGR and color reflectance b*.

Figure F39. Hole U1460B lithology summary with NGR and color reflectance b*.
Sedimentation rates were calculated from calcareous nannofossil and planktonic foraminiferal datums (Figures F38, F39). Biostratigraphy focused on Hole U1460A with additional analysis of the lowermost interval of Hole U1460B to reduce uncertainty about the age model in the deepest part of Hole U1460B. Planktonic foraminiferal and calcareous nannofossil datums are generally in agreement except for the Pliocene to early Pleistocene, so age models from both holes are presented together in Figure F40. The sedimentation rate produced from planktonic foraminiferal datums indicates moderate to high rates in Pliocene Zones PL2 (2 cm/ky; Hole U1460B) and PL4 (20 cm/ky; Hole U1460A) and high rates (21 cm/ky) in early Pleistocene Zone Pt1a (Hole U1460A). The high planktonic foraminiferal datum–based sedimentation rates (20 cm/ky) around Zone PL4 correlate with a zone of mass wasting in lower Unit II. The lowest sedimentation rates (0.9 cm/ky) occur within the lowermost Pleistocene sediment (~265–280 m CSF-A in Hole U1460A) at the change from mud-rich wackestone to more sandy packstone. The low sedimentation rate from ~265 to 280 m CSF-A indicates reduced deposition (or a possible unconformity) just above the Pliocene/Pleistocene boundary in Hole U1460A and occurs between the top of D. altispira and the bottom of G. truncatulinoides (~1.9–2.5 Ma). In contrast, the lowest rates based on calcareous nannofossils are associated with glauconite-rich zones of mass wasting in Unit II (Figure F38) between ~280 and 290 m CSF-A within Zone NN16.

Figure F40. Site U1460 lithology summary with NGR for each hole.
Sedimentation rates are very high throughout the Pleistocene (12–39 cm/ky) with the exception of one interval at the base of Zone NN19, from the top of D. brouweri (1.93 Ma) to the bottom of R. asanoi (1.14 Ma) (Figure F38). This unit (~176.24–208.85 m CSF-A) of low sedimentation rate terminates at a hardground around the base of Core 356-U1460A-38F (~177 m CSF-A). The calcareous nannofossil datum C. macintyrei may be reworked.
References
Collins, L.B., James, N.P., and Bone, Y., 2014. Carbonate shelf sediments of the western continental margin of Australia. In Chiocci, F.L., and Chivas, A.R. (Eds.), Continental Shelves of the World: Their Evolution During the Last Glacio-Eustatic Cycle. Memoirs - Geological Society of London, 41:255–272. http://dx.doi.org/10.1144/M41.19
Collins, L.B., and Testa, V., 2010. Quaternary development of resilient reefs on the subsiding Kimberley continental margin, northwest Australia. Brazilian Journal of Oceanography, 58(SPE1):67–77. http://dx.doi.org/10.1590/S1679-87592010000500007
Gallagher, S.J., Fulthorpe, C.S., Bogus, K., Auer, G., Baranwal, S., Castañeda, I.S., Christensen, B.A., De Vleeschouwer, D., Franco, D.R., Groeneveld, J., Gurnis, M., Haller, C., He, Y., Henderiks, J., Himmler, T., Ishiwa, T., Iwatani, H., Jatiningrum, R.S., Kominz, M.A., Korpanty, C.A., Lee, E.Y., Levin, E., Mamo, B.L., McGregor, H.V., McHugh, C.M., Petrick, B.F., Potts, D.C., Rastegar Lari, A., Renema, W., Reuning, L., Takayanagi, H., and Zhang, W., 2017a. Expedition 356 methods. In Gallagher, S.J., Fulthorpe, C.S., Bogus, K., and the Expedition 356 Scientists, Indonesian Throughflow. Proceedings of the International Ocean Discovery Program, 356: College Station, TX (International Ocean Discovery Program). http://dx.doi.org/10.14379/iodp.proc.356.102.2017
Gallagher, S.J., Fulthorpe, C.S., Bogus, K., Auer, G., Baranwal, S., Castañeda, I.S., Christensen, B.A., De Vleeschouwer, D., Franco, D.R., Groeneveld, J., Gurnis, M., Haller, C., He, Y., Henderiks, J., Himmler, T., Ishiwa, T., Iwatani, H., Jatiningrum, R.S., Kominz, M.A., Korpanty, C.A., Lee, E.Y., Levin, E., Mamo, B.L., McGregor, H.V., McHugh, C.M., Petrick, B.F., Potts, D.C., Rastegar Lari, A., Renema, W., Reuning, L., Takayanagi, H., and Zhang, W., 2017b. Site U1459. In Gallagher, S.J., Fulthorpe, C.S., Bogus, K., and the Expedition 356 Scientists, Indonesian Throughflow. Proceedings of the International Ocean Discovery Program, 356: College Station, TX (International Ocean Discovery Program). http://dx.doi.org/10.14379/iodp.proc.356.104.2017
Gee, J., Staudigel, H., and Tauxe, L., 1989. Contribution of induced magnetization to magnetization of seamounts. Nature, 342(6246):170–173. http://dx.doi.org/10.1038/342170a0
Gradstein, F.M., Ogg, J.G., Schmitz, M.D., and Ogg, G.M. (Eds.), 2012. The Geological Time Scale 2012: Amsterdam (Elsevier).
James, N.P., Collins, L.B., Bone, Y., and Hallock, P., 1999. Subtropical carbonates in a temperate realm; modern sediments on the southwest Australian shelf. Journal of Sedimentary Research, 69(6):1297–1321. http://dx.doi.org/10.2110/jsr.69.1297
Kruiver, P.P., Dekkers, M.J., and Heslop, D., 2001. Quantification of magnetic coercivity components by the analysis of acquisition curves of isothermal remanent magnetization. Earth and Planetary Science Letters, 189(3–4):269–276. http://dx.doi.org/10.1016/S0012-821X(01)00367-3
Robertson, D.J., and France, D.E., 1994. Discrimination of remanence-carrying minerals in mixtures, using isothermal remanent magnetisation acquisition curves. Physics of the Earth and Planetary Interiors, 82(3–4):223–234. http://dx.doi.org/10.1016/0031-9201(94)90074-4
van Hinsbergen, D.J.J., Kouwenhoven, T.J., and van der Zwaan, G.J., 2005. Paleobathymetry in the backstripping procedure: correction for oxygenation effects on depth estimates. Palaeogeography, Palaeoclimatology, Palaeoecology, 221(3–4):245–265. http://dx.doi.org/10.1016/j.palaeo.2005.02.013
1 Gallagher, S.J., Fulthorpe, C.S., Bogus, K., Auer, G., Baranwal, S., Castañeda, I.S., Christensen, B.A., De Vleeschouwer, D., Franco, D.R., Groeneveld, J., Gurnis, M., Haller, C., He, Y., Henderiks, J., Himmler, T., Ishiwa, T., Iwatani, H., Jatiningrum, R.S., Kominz, M.A., Korpanty, C.A., Lee, E.Y., Levin, E., Mamo, B.L., McGregor, H.V., McHugh, C.M., Petrick, B.F., Potts, D.C., Rastegar Lari, A., Renema, W., Reuning, L., Takayanagi, H., and Zhang, W., 2017. Site U1460. In Gallagher, S.J., Fulthorpe, C.S., Bogus, K., and the Expedition 356 Scientists, Indonesian Throughflow. Proceedings of the International Ocean Discovery Program, 356: College Station, TX (International Ocean Discovery Program). http://dx.doi.org/10.14379/iodp.proc.356.105.2017
- F1. Map of the northwest shelf showing major basins and location of modern and “fossil” reefs.
- F2. Bathymetric map showing the seafloor around Site U1460.
- F3. Multichannel seismic profile across Site U1460.
- F4. Lithostratigraphic summary, Site U1460.
- F5. Smear slide summary, Hole U1460A.
- F6. Dominant fossil assemblage and foraminifers.
- F7. Hardgrounds at the top of Subunits Ib and Ic, Site U1460.
- F8. Siliceous sponge spicules up to 200 µm in diameter.
- F9. Hardground, Subunit Ic.
- F10. Hardground at the top of Subunit Ic showing skeletal packstone with recrystallized bioclasts cemented by microcrystalline cement.
- F11. Unit II mass-wasting deposits, Site U1460.
- F12. Packstone interbedded with mass-wasting deposits in Unit II.
- F13. Packstone interbedded with mass-wasting deposits within Unit II.
- F14. Calcareous nannofossils, Site U1460.
- F15. Planktonic foraminifer abundance, Site U1460.
- F16. Dominant benthic foraminiferal species and assemblages, Hole U1460A. This figure is available in an oversized format.
- F17. Benthic foraminifer diversity percentage of total foraminifers, Site U1460.
- F18. Sponge spicules.
- F19. Hydrocarbons in headspace gases, Site U1460.
- F20. Alkalinity, pH, and salinity, Site U1460.
- F21. Major constituent interstitial water geochemistry, Site U1460.
- F22. Minor element interstitial water geochemistry, Site U1460.
- F23. Bulk sediment geochemistry, Site U1460.
- F24. AF demagnetization results from archive-half core sections at 6 depths, Hole U1460A.
- F25. AF demagnetization results from discrete samples at 4 depths, Hole U1460A.
- F26. IRM acquisition curves for 4 discrete samples.
- F27. CLG analysis of IRM curve of one discrete sample.
- F28. IRM acquisition curves for 4 discrete samples plotted with their respective backfield curves.
- F29. Magnetostratigraphic data set, Hole U1460A.
- F30. WRMSL MS, SHMSL MSP, and NGR results, Site U1460.
- F31. The effect of changing the number of MSP measurements taken at each position on the SHMSL, Site U1460.
- F32. P-wave velocity, penetrometer, and shear strength results, Site U1460.
- F33. Bulk density, grain density, and porosity, Site U1460.
- F34. Color reflectance ratios, Site U1460.
- F35. A. APCT-3 in situ temperature. B. Thermal conductivity. C. Depth vs. thermal resistance. D. Thermal resistance vs. temperature.
- F36. Temperature as a function of time in the coring shoe using the APCT-3.
- F37. Suggested intervals for continuous sampling, Holes U1460A and U1460B.
- F38. Hole U1460A lithology summary with NGR and color reflectance b*.
- F39. Hole U1460B lithology summary with NGR and color reflectance b*.
- F40. Site U1460 lithology summary with NGR for each hole.
- T1. Operations summary, Site U1460.
- T2. Site U1460 core summary.
- T3. Lithostratigraphic unit summary, Site U1460.
- T4. Site U1460 smear slide samples.
- T5. Thin section samples, Site U1460 Subunit Ic and Unit II.
- T6. Calcareous nannofossil and planktonic foraminifer datums, Site U1460.
- T7. Calcareous nannofossil abundance and range charts, Site U1460.
- T8. Occurrence of main genera and species of benthic and planktonic foraminifers and additional bioclasts and minerals, Site U1460.
- T9. Planktonic foraminifer presence, abundance, and preservation at Site U1460.
- T10. Benthic foraminifer abundance, Site U1460.
- T11. Headspace gas contents, Site U1460.