Hall, I.R., Hemming, S.R., LeVay, L.J., and the Expedition 361 Scientists
Proceedings of the International Ocean Discovery Program Volume 361
publications.iodp.org
doi:10.14379/iodp.proc.361.108.2017

Site U14791
I.R. Hall, S.R. Hemming, L.J. LeVay, S. Barker, M.A. Berke, L. Brentegani, T. Caley, A. Cartagena-Sierra, C.D. Charles, J.J. Coenen, J.G. Crespin, A.M. Franzese, J. Gruetzner, X. Han, S.K.V. Hines, F.J. Jimenez Espejo, J. Just, A. Koutsodendris, K. Kubota, N. Lathika, R.D. Norris, T. Periera dos Santos, R. Robinson, J.M. Rolinson, M.H. Simon, D. Tangunan, J.J.L. van der Lubbe, M. Yamane, and H. Zhang2
Keywords: International Ocean Discovery Program, IODP, JOIDES Resolution, Expedition 361, Site U1479, Agulhas Current, Agulhas Leakage, Agulhas Plateau, Agulhas Retroflection, Agulhas Return Current, Agulhas Rings, Agulhas Undercurrent, Atlantic Meridional Overturning Circulation, boundary current, Cape Basin, Circumpolar Deep Water, Congo Air Boundary, Delagoa Bight, East Madagascar Current, human evolution, Indian Ocean, Indonesian Throughflow, interocean exchange, Intertropical Convergence Zone, Last Glacial Maximum, Limpopo River, Middle Pleistocene Transition, Miocene, Mozambique Channel, Natal Valley, North Atlantic Deep Water, ocean circulation, paleoceanography, paleoclimate, Pleistocene, Pliocene, salinity, southern Africa, Southern Ocean, Subantarctic Zone, Subtropical Front, Subtropical Gyre, thermohaline circulation, Warm Water Route, Western Boundary Current, Zambezi River
MS 361-107: Published 30 September 2017
Background and objectives
Site U1479 is located on a 30 km wide morphological high rising ~200 m above the regional seafloor on the mid-to-lower western slope of the Agulhas Bank in Cape Basin (35°03.53′S; 17°24.06′E) ~85 nmi southwest of Cape Town, South Africa (Figures F1, F2), at a water depth of 2615 m below sea level (mbsl).
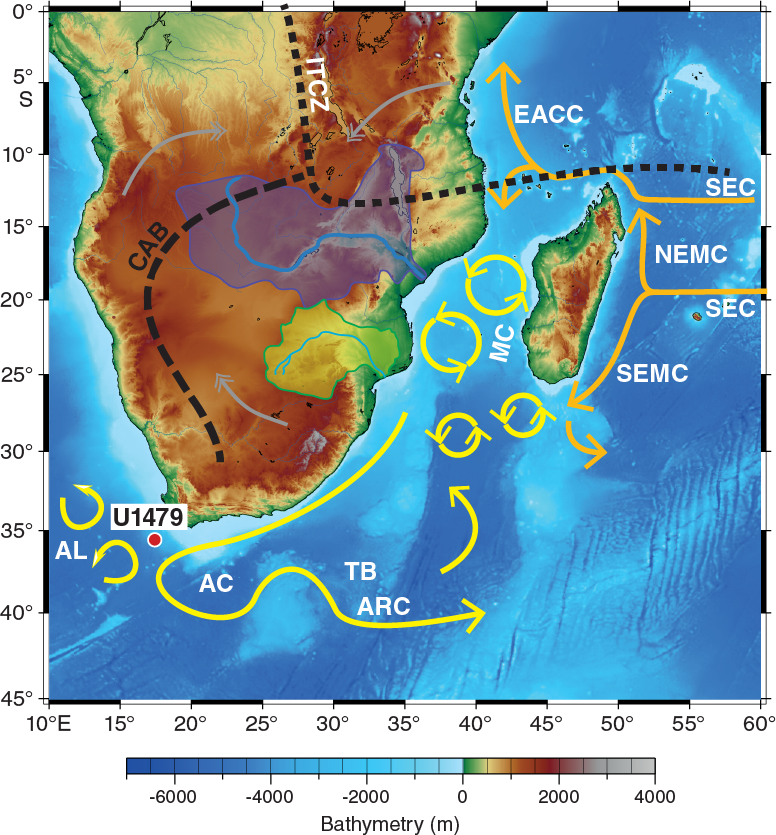
Figure F1. Location map of Site U1479 with main surface currents in the southwest Indian Ocean.
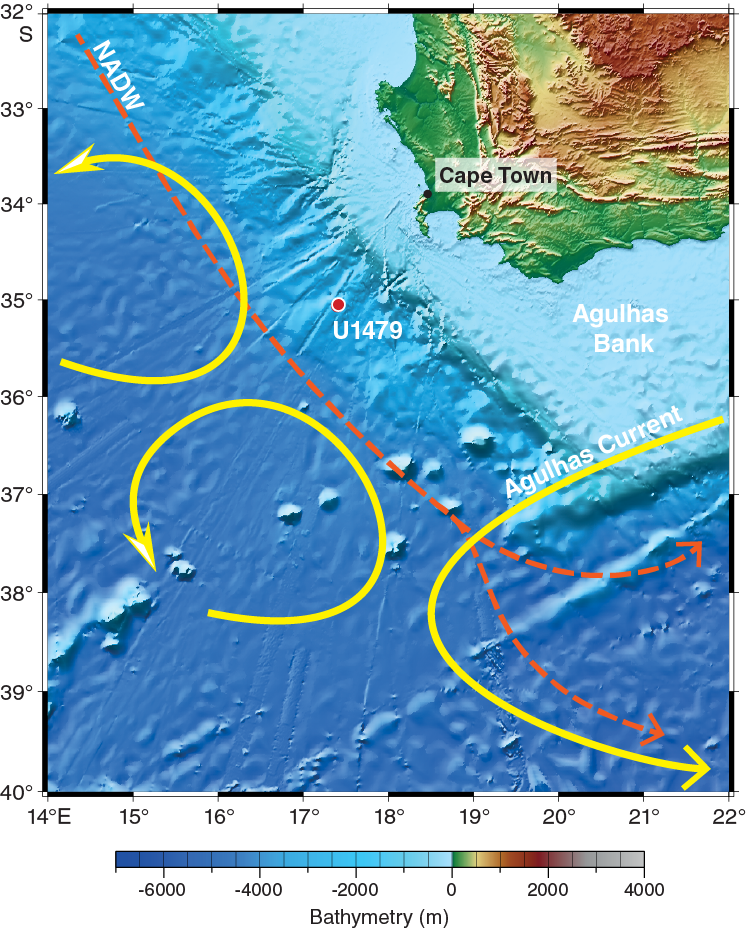
Figure F2. Geomorphologic and oceanographic features around Site U1479.
This region has been the focus of numerous oceanographic and a growing number of paleoceanographic studies (e.g., Beal et al., 2011, and references therein) that describe the present hydrography within the Agulhas ring corridor (or “Cape Cauldron” in Gordon, 2003) while also providing a better understanding of past oceanographic variation in the area and connections with global climate changes. Several studies have highlighted the Agulhas Current’s sensitivity to climate changes and reorganizations of atmospheric and ocean circulation at large (see the Expedition 361 summary chapter [Hall et al., 2017]).
As the Agulhas Current separates, under its own southward inertia, from the Agulhas Bank at the southern tip of Africa, it retroflects and flows eastward as the Agulhas Return Current (Quartly and Srokosz, 1993). During the retroflection, the Agulhas Current periodically sheds Agulhas rings—large anticyclones with diameters up to ~400 km—and filaments at its westernmost extension to the South Atlantic (Figure F3). This leads to a leakage of between 2 and 20 Sv of Indian Ocean Water into the South Atlantic Ocean and affects the water column to greater than 2000 mbsl (Gordon et al., 1987; de Ruijter et al., 1999; Richardson, 2007). The surface and intermediate interocean exchanges are dominated by the migration of Agulhas rings that, once detached from the retroflection, slowly drift northwestward along the Agulhas ring corridor (Lutjeharms et al., 1997; van Aken et al., 2003; Boebel et al., 2003). The Agulhas rings decay rapidly in the Cape Basin (Doglioli et al., 2006; van Sebille et al., 2010), although their remnants pass over Walvis Ridge and can be traced with altimetry far into the South Atlantic Ocean (Schouten et al., 2000).
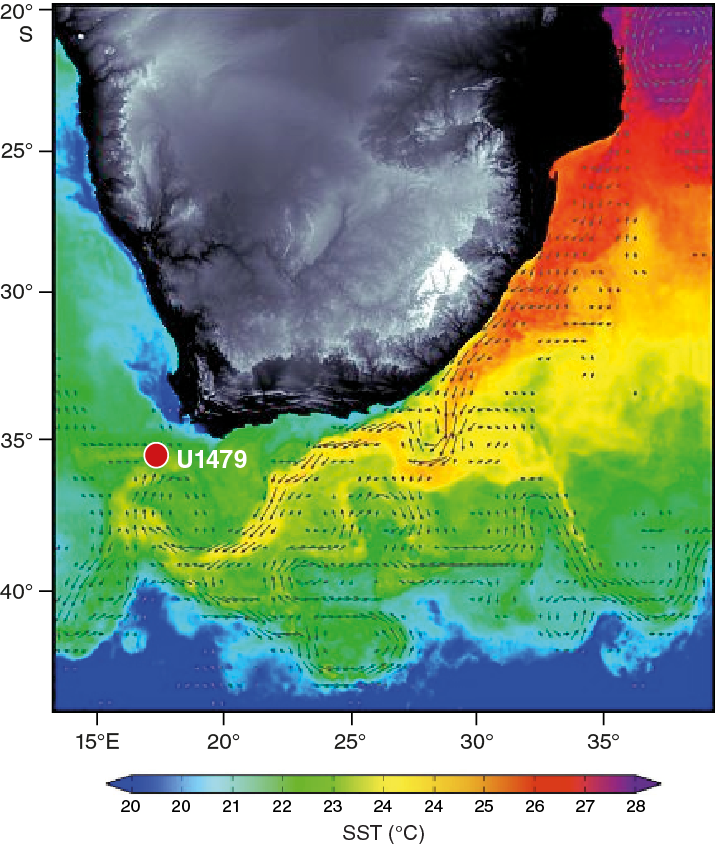
Figure F3. Example sea-surface temperature for the Site U1479 area overlaid with geostrophic current vectors.
Water masses in the region are a complex mix that derives from the South Atlantic, Indian, and Southern Oceans, each with distinct temperature, salinity, and nutrient characteristics (Gordon et al., 1987; Valentine et al., 1993; Lutjeharms, 2006; Whittle et al., 2008). Whittle et al. (2008) documented the temperature and salinity of water from an eddy within the Cape Basin (Figure F4). Arhan et al. (2003) and van Aken et al. (2004) demonstrated the presence of a North Atlantic Deep Water (NADW)-fed deep boundary current flowing southward along the west African continental slope between 1700 and 3800 mbsl. Arhan et al. (2003) estimated NADW transport of 3 ± 5 Sv through Cape Basin at 22.5°S, with a total of 11 ± 7 Sv exiting the South Atlantic Ocean at 35°S. Van Aken et al. (2004) traced the deep salinity maximum associated with the NADW core in a narrow band along the west African continental slope from the southeast Atlantic near 30°S, around the tip of the Agulhas Bank to the Mozambique Channel east of Africa. A recent modeling study by van Sebille et al. (2012) suggests tight coupling between the southward transport of NADW through Cape Basin and the vorticity flux associated with the Agulhas rings. Using the ocean model “For the Earth Simulator,” they found that the most common pathway for NADW lies directly below the Agulhas ring corridor, and the decay of Agulhas rings results in a southward velocity of 1–2 cm/s in the deep water, with an estimated ~4 Sv of NADW being transported from the Deep Western Boundary Current at 25°S to the southern tip of Africa.
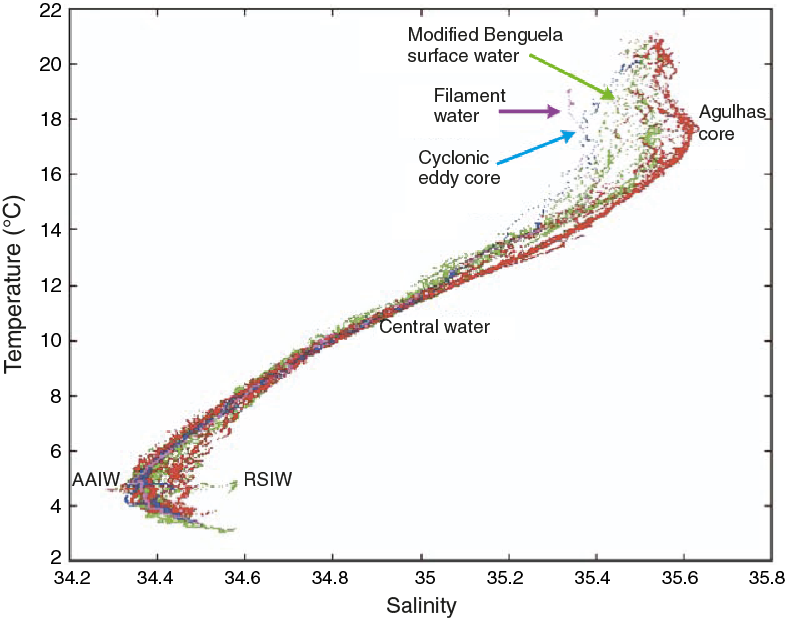
Figure F4. Temperature-salinity plot from an apparent dipole vortex in the southeastern Atlantic Ocean.
In general, the Agulhas ring corridor represents a challenging area for retrieval of high-quality sediment cores. The vigorous Agulhas Current and its mesoscale variability can cause sediment redistribution because meanders and eddies frequently reach the seafloor. Yet, a number of published studies and emerging work demonstrate that paleoceanographic records of excellent quality are in fact achievable for reconstructing both surface and deep-water variability in the region (e.g., Rau et al., 2002, 2006; Peeters et al., 2004; Martínez-Méndez et al., 2010; Dickson et al., 2010; Caley et al., 2011, 2012, 2014; Marino et al., 2013; Dyez et al., 2014; Petrick et al., 2015).
The Site U1479 primary objectives are to
- Recover a complete Pliocene–Pleistocene sedimentary succession, including the early Pliocene warm period, mid-Pliocene expansion of Northern Hemisphere ice sheets, and the mid-Pleistocene transition, from a high-accumulation site located within the Agulhas ring corridor;
- Reconstruct Agulhas Current warm-water transports over the course of both orbitally modulated and more abrupt climate changes;
- Assess the linking between Antarctic climate variations, circumpolar ocean front instability, and connections with Agulhas leakage into the South Atlantic;
- Assess the vigor and hydrography of NADW (or its precursors) exported to Circumpolar Deep Water and the southwest Indian Ocean at a location proximal to the entrance of NADW to the Southern Ocean and southern Indian Ocean; and
- Evaluate the possibility of advective salinity feedbacks between Agulhas leakage and Atlantic Meridional Overturning Circulation variability, notably the possible role of the leakage in modulating surface-to-deep-ocean coupling in the North Atlantic during the transition between climatic states.
Site survey data were collected during R/V Meteor Cruise M75/3 in 2008 (Figures F5, F6, F7, F8, F9). Unfortunately, the cruise experienced bad weather, limiting data quality. Nonetheless, seismic Line GeoB08-236 shows that Site U1479 is positioned on a 30 km wide, 200 m morphological high on the mid-to-lower western slope of the Agulhas Bank (Figure F5). The seismic line reveals a great similarity to the seismic line across Deep Sea Drilling Program (DSDP) Site 360 on the Cape Basin continental rise (The Shipboard Scientific Party, 1978). Shallow portions of the rise are characterized by surface erosion to 1.8 s two-way traveltime (TWT; ~1350 mbsl), which marks the influence of AAIW. At greater depth, surface sedimentary units gradually increase in thickness. Between 2.6 and 3.4 s TWT (~1950–2550 mbsl), the seafloor shows V-shaped incision and erosional truncation. Deeper than 3.4 s TWT and seaward of the 35 km offset, sediment structures are relatively undisturbed, and the sediment thickness further increases across the ramp on which Site U1479 is located. In the deepest part beyond the 8 km offset, truncation and erosion are present again. The topographic high has a smooth seafloor topography and an aggradational stacking pattern consisting of parallel internal reflectors of low seismo-acoustic amplitude. Reflectors within the uppermost 100 ms TWT converge slightly toward the outer fringes of the morphological high where reflectors are truncated. Site U1479 is at a location with an expanded uppermost section downward to the first strong reflector at 100 ms TWT (Figure F8). Below this reflector, the seismo-acoustic facies shows a uniformly layered section downward to another major reflector at 460 ms TWT (~345 mbsf) that we consider the equivalent of Reflector L of Martin et al. (1981), which was inferred to be late Pliocene (Preu et al., 2011).
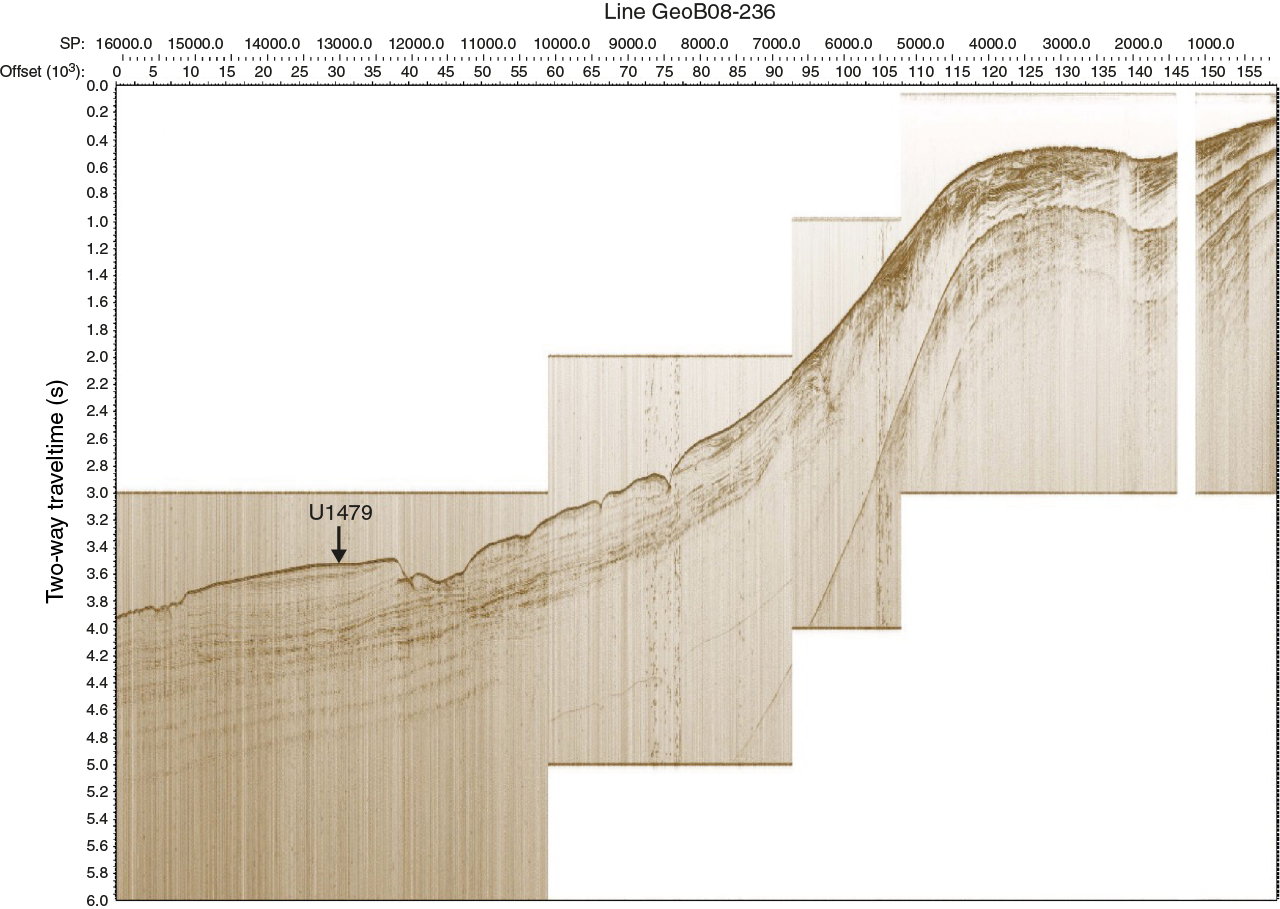
Figure F5. Seismic Line GeoB08-236 showing a long transect from the shelf downslope to approximate Site U1479 position.
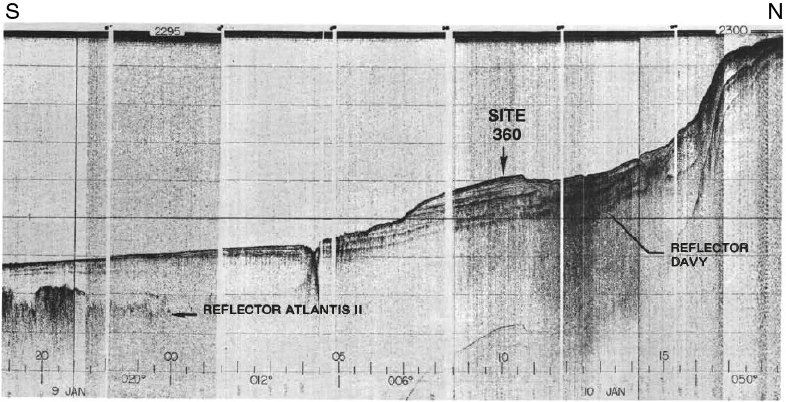
Figure F6. Conrad seismic line across Deep Sea Drilling Project (DSDP) Site 360, Cape Basin, during Leg 40.

Figure F7. Bathymetry and parasound survey tracks, Site U1479.
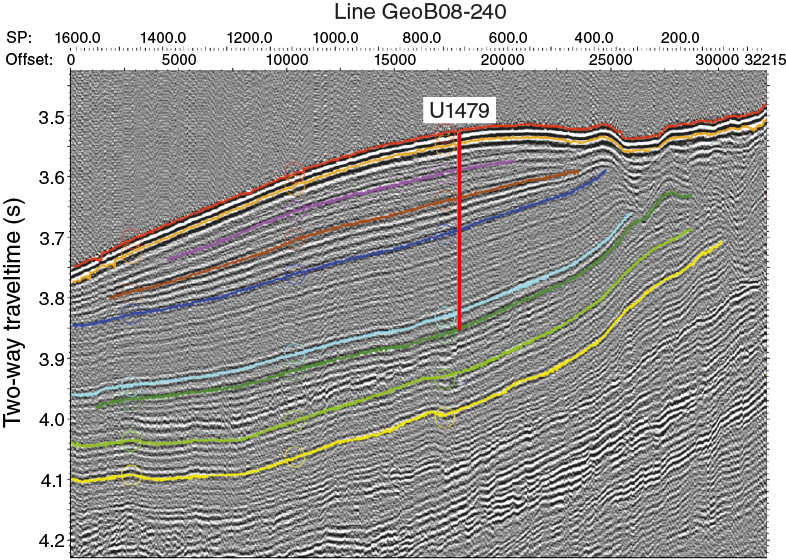
Figure F8. Detail interpretation of seismic Line GeoB08-240 across Site U1479.
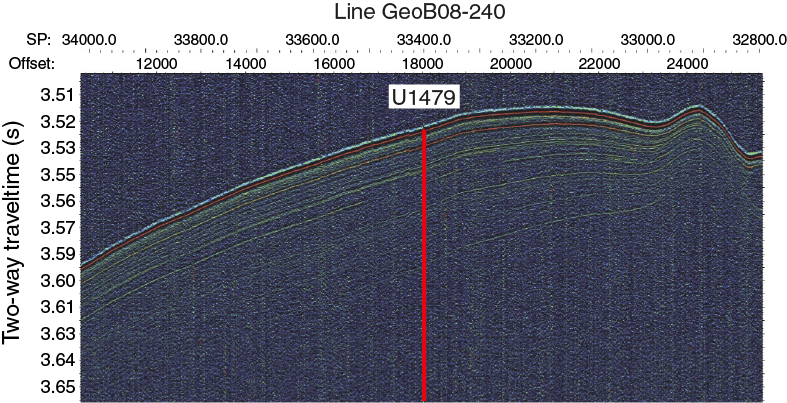
Figure F9. Parasound profile along seismic Line GeoB08-240 across Site U1479.
Site U1479 was occupied on 24 March 2016. Nine holes were drilled and cored using the advanced piston corer (APC), achieving a depth of 300.7 m drilling depth below seafloor (DSF) in Hole U1479B. The total cored interval at Site U1479 was 975.3 m, and total recovery was 963.21 m (99%).
Operations
Transit to Site U1479
After a 1196 nmi transit from Site U1478, the vessel arrived at Site U1479 (proposed Site CAPE-01C) at 0342 h on 24 March 2016. The thrusters lowered at 0414 h, and a positioning beacon was deployed at 0609 h. The vessel stabilized over the site coordinates at 0624 h, starting the site and Hole U1479A.
Site U1479
Site U1479 consisted of 9 holes, ranging in depth from 1.0 to 300.7 m DSF (Table T1). Overall, 105 cores were recorded for the site. A total of 963.21 m of core over a 975.3 m interval was recovered using the APC system (99% core recovery). Seven intervals were advanced without coring over 175.7 m. The total time spent at Site U1479 was 6.0 days.
Table T1. Site U1479 core summary. Download table in .csv format. View PDF table.
Hole U1479A
The APC/extended core barrel bottom-hole assembly and drill string were made up and deployed to 2610 mbsl. Hole U1479A was spudded at 1150 h on 24 March 2016 and recovered 1.0 m of sediment. The seafloor was measured at 2618.5 mbsl. The science team decided that a longer, more pristine mudline core was desired, and Hole U1479A was abandoned.
Hole U1479B
The bit was lowered 5 m to 2615 mbsl, and Hole U1479B was spudded at 1255 h on 24 March. A water depth of 2618.3 mbsl was calculated based on recovery from Core 361-U1479B-1H. APC coring recovered Cores 1H through 32H (0–300.7 m DSF). A total of 296.73 m of sediment was recovered in Hole U1479B over a 300.7 m cored interval (99%). After completing coring operations in Hole U1479B, the drill string was pulled out of the hole, and the bit cleared the seafloor at 1920 h on 25 March. Sea conditions affected the core quality and recovery in the upper 82.5 m of the hole.
Hole U1479C
The vessel was offset 20 m north of Hole U1479B, and a water depth of 2618.3 mbsl was assumed. Hole U1479C began at 2100 h on 25 March with a 1.0 m washed interval to offset coring gaps. Cores 361-U1479C-2H through 32H (1.0–295.5 m DSF) were retrieved using the APC system. A total of 303.69 m of sediment was recovered over a 294.5 m cored interval (103%). After completing coring operations in Hole U1479C, the drill string was pulled out of the hole, with the bit clearing the seafloor at 0250 h on 27 March.
Hole U1479D
The vessel was offset 20 m east of Hole U1479B, and Hole U1479D was spudded at 0450 h on 27 March with the bit at 2615.1 mbsl. Cores 361-U1479D-1H through 3H (0–25.4 m DSF) were retrieved and followed by a 2.0 m washed interval to offset coring gaps for stratigraphic correlation. Cores 5H through 12H (27.4–103.4 m DSF) were recovered. After retrieving Core 12H, the drill string was pulled from the hole because of deteriorating sea conditions. The bit cleared the seafloor at 1510 h on 27 March, ending Hole U1479D. A total of 102.15 m of sediment was taken over a 101.4 m cored interval (101%).
Hole U1479E
After waiting on weather for 12 h, the vessel was offset 20 m south of Hole U1479B. Hole U1479E was spudded at 0325 h on 28 March using an estimated seafloor depth of 2615.1 mbsl. Hole U1479E was drilled without recovery from 0 to 90 m DSF. The APC system was used on Cores 361-U1479E-2H through 8H (90.0–156.5 m DSF) followed by a 2.0 m drilled interval, employed to offset coring gaps for stratigraphic correlation. Cores 10H through 12H (158.5–187.0 m DSF) were recovered. Interval 361-U1479E-133 was drilled without recovery over 42.0 m. Cores 14H through 18H were taken from 229.0 to 276.5 m DSF. After reaching total depth, the drill string was pulled from the hole with the bit clearing the seafloor at 2335 h on 28 March. A total of 15 APC cores recovered 148.17 m of sediment over a 142.5 m cored interval (104%). Three drilled intervals spanning 134.0 m were recorded for the hole.
Hole U1479F
The vessel was offset 20 m west of Hole U1479B. Hole U1479F was spudded at 0125 h on 29 March. Core 361-U1479F-1H did not recover a mudline and instead had a full core barrel. Hole U1479F was abandoned for a second mudline attempt. Core 1H recovered 9.5 m of sediment with 100% core recovery.
Hole U1479G
The drill string was pulled up 3.0 m, and Hole U1479G was spudded at 0225 h on 29 March. Core 361-U1479G-1H recovered 9.29 m of sediment, including the mudline. After calculating the seafloor at 2612.5 mbsl, the decision was made to core another mudline and then continue to core down.
Hole U1479H
The drill string was pulled up 4.0 m, and Hole U1479H was spudded at 0325 h on 29 March. Core 361-U1479H-1H recovered a 5.57 m mudline. Cores 2H through 5H were taken from 5.6 to 43.6 m DSF followed by a 4.0 m interval that was advanced without recovery to offset coring gaps for stratigraphic correlation. Cores 7H through 10H (47.6–85.6 m DSF) were retrieved with poor APC recovery (75%). While taking Cores 7H and 9H, the flap-style core catcher failed to close and several meters of core was lost. Because of this, a critical stratigraphic interval was not cored, and the science leadership decided to terminate the hole. The drill string was pulled out of the hole, with the bit clearing the seafloor at 1130 h on 29 March, ending Hole U1479H.
A total of 9 APC cores recovered 70.75 m of core over an 81.6 m cored interval (87%). APC cores were not oriented and used nonmagnetic core barrels.
Hole U1479I
Hole U1479I was spudded at 1200 h on 29 March, and Core 361-U1479I-1H recovered a 6.3 m mudline core. The hole was advanced without recovery to 41.0 m DSF. The flapper-style core catcher failed to close while taking Core 3H, and only 2.35 m was recovered. Core 4H recovered a full core barrel, but Core 5H misfired when the shear pins on the core barrel sheared early because of rough sea conditions. The decision was made to stop coring operations until weather conditions improved. The drill string was pulled from the hole, and the bit cleared the seafloor at 1820 h on 29 March. Four APC cores recovered 21.79 m of sediment over a 34.8 m cored interval (63% core recovery). One drilled interval of 34.7 m was recorded. The APC cores were taken using unoriented nonmagnetic core barrels.
The vessel spent the remaining operational time waiting on weather. At 0400 h on 30 March the drill pipe was tripped, and the bit cleared the rig floor at 1215 h. The positioning beacon was recovered at 0754 h. The rig floor was secured for transit at 1335 h, the thrusters were raised at 1415 h, and the vessel was under way to Cape Town, South Africa, at 1436 h, ending Hole U1479I and Site U1479.
Sedimentology
Drilling at Site U1479 recovered a total of ~963.08 m of sediment from nine holes (Figures F10, F11; also see Operations). Hole U1479A was cored to 1.01 m coring depth below seafloor (CSF-A), Hole U1479B to 300.98 m CSF-A, Hole U1479C to 296.03 m CSF-A, Hole U1479D to 103.22 m CSF-A, Hole U1479E to 276.87 m CSF-A, Hole U1479F to 9.50 m CSF-A, Hole U1479G to 9.29 m CSF-A, Hole U1479H to 86.08 m CSF-A, and U1479I to 63.60 m CSF-A. The APC system was applied in all holes. Seven intervals covering 177.27 m in length were advanced without coring: one interval in Hole U1479C (0–1.00 m CSF-A), one interval in Hole U1479D (24.68–27.40 m CSF-A), three intervals in Hole U1479E (0–90.00, 157.03–158.50, and 187.56–229.00 m CSF-A), one interval in Hole U1479H (41.65–47.60 m CSF-A), and one interval in Hole U1479I (6.31–41 m CSF-A). Visual description of all cores was performed and recorded using the shipboard lithostratigraphic DESClogik program, which involves visual assessment of average grain size, sediment color, sedimentary structures, and bioturbation intensity. Disturbances induced by drilling were also described. Lithologic characteristics were further determined using smear slide analyses, and a total of 474 shipboard samples were collected from the working halves of the cores for paleontological, physical properties, paleomagnetic, and geochemical analyses (Table T2).
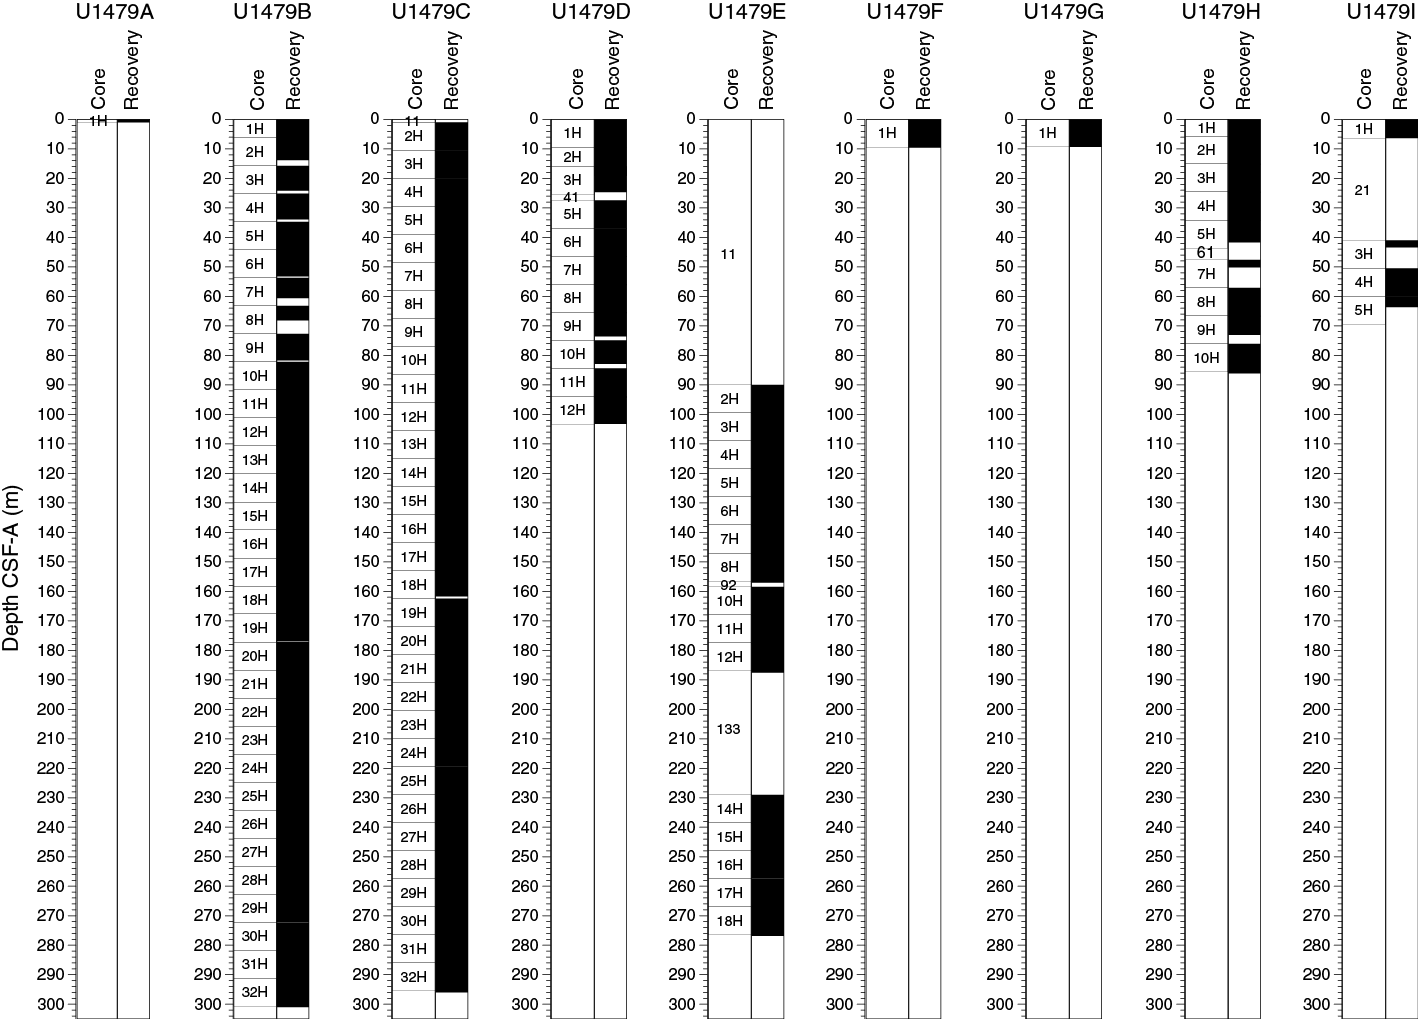
Figure F10. Core recovery, Holes U1479A–U1479I.
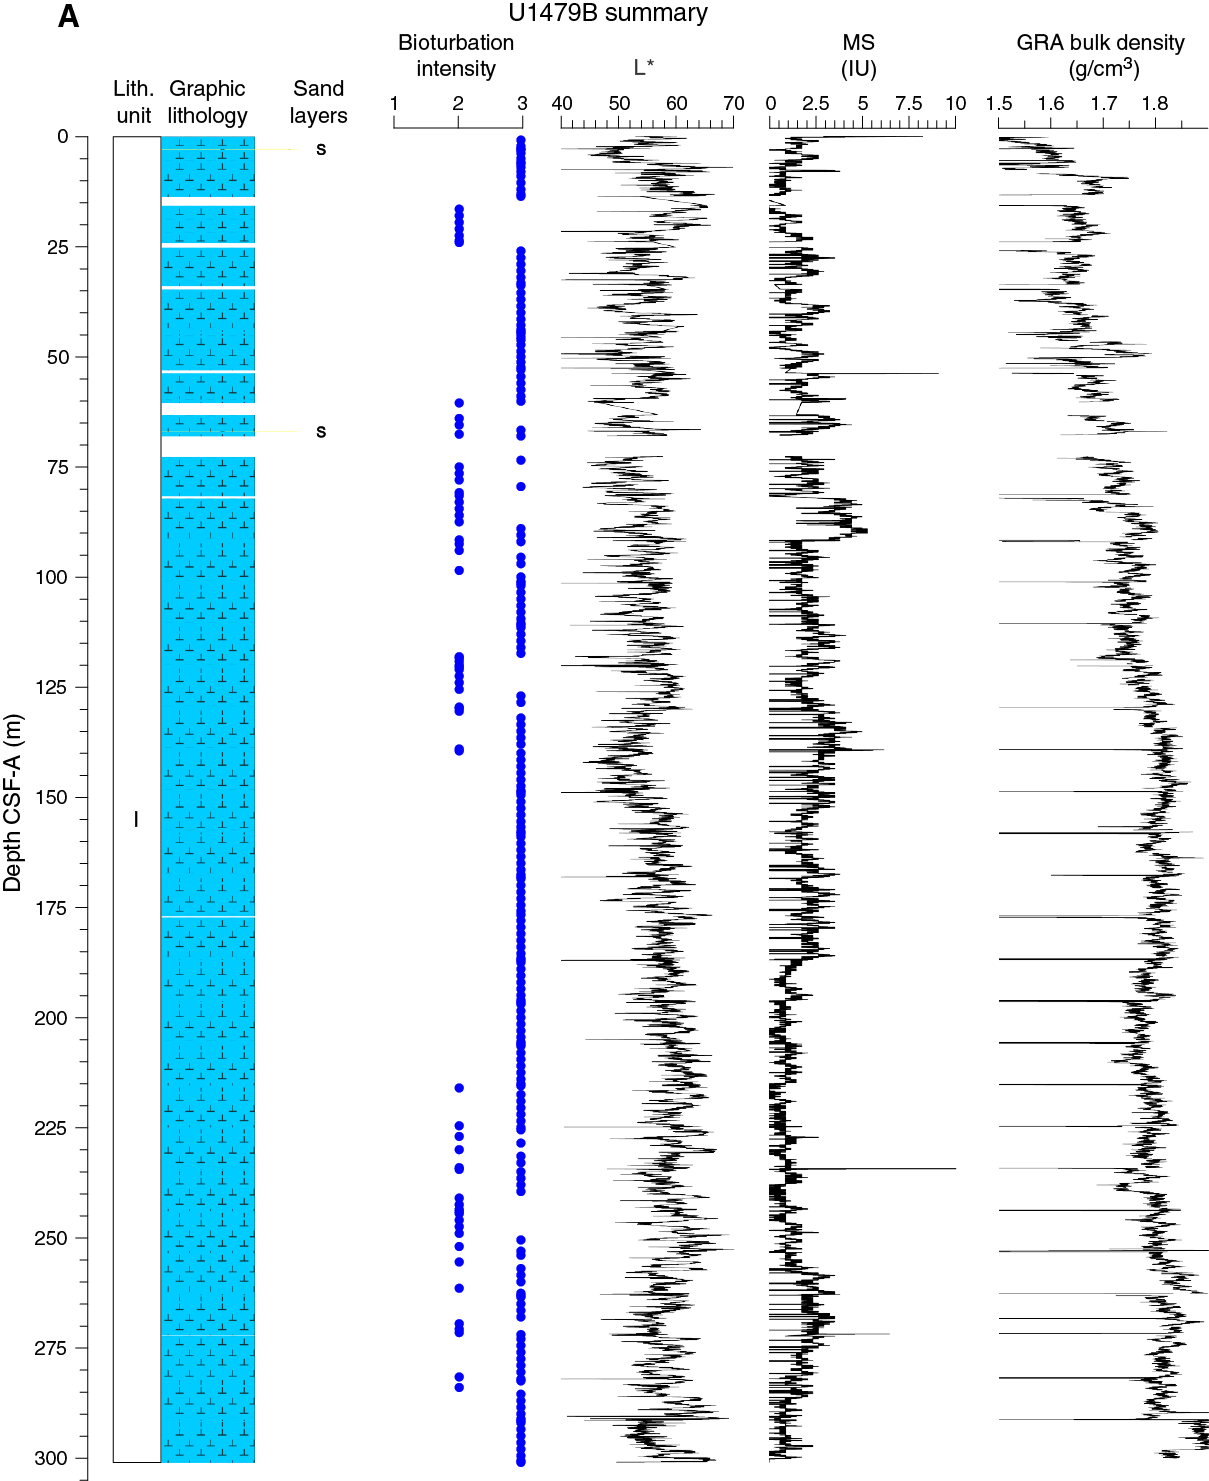
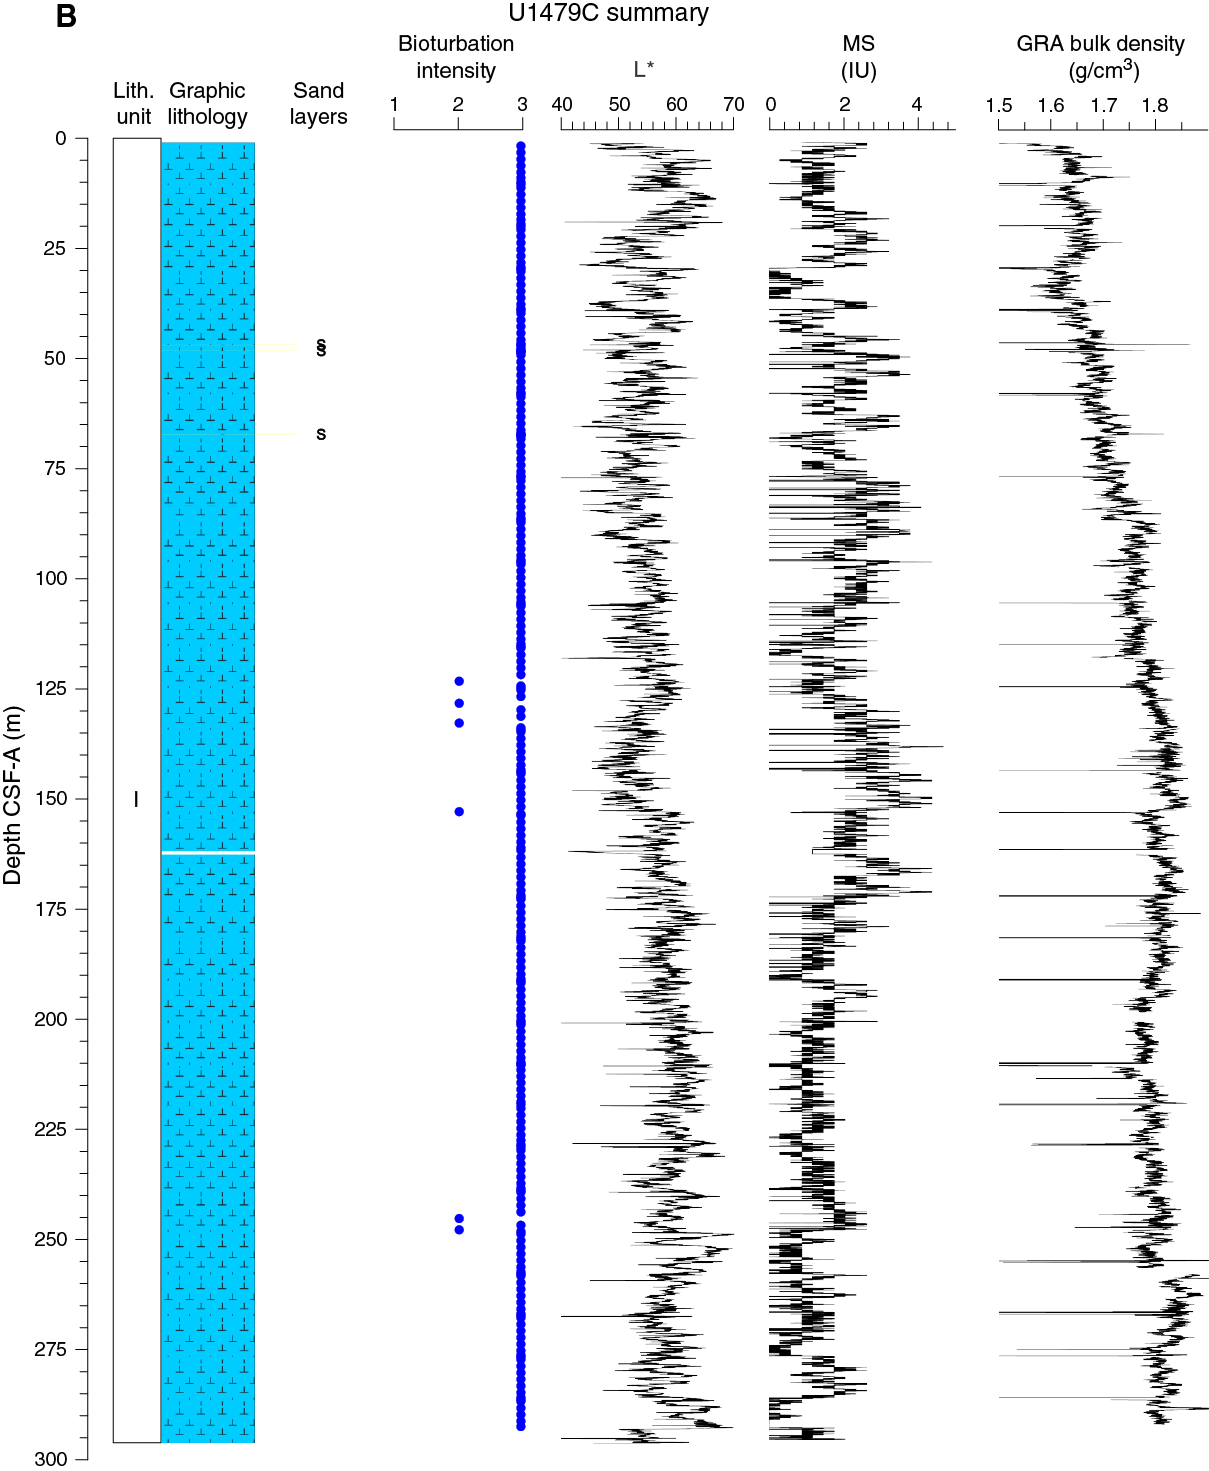
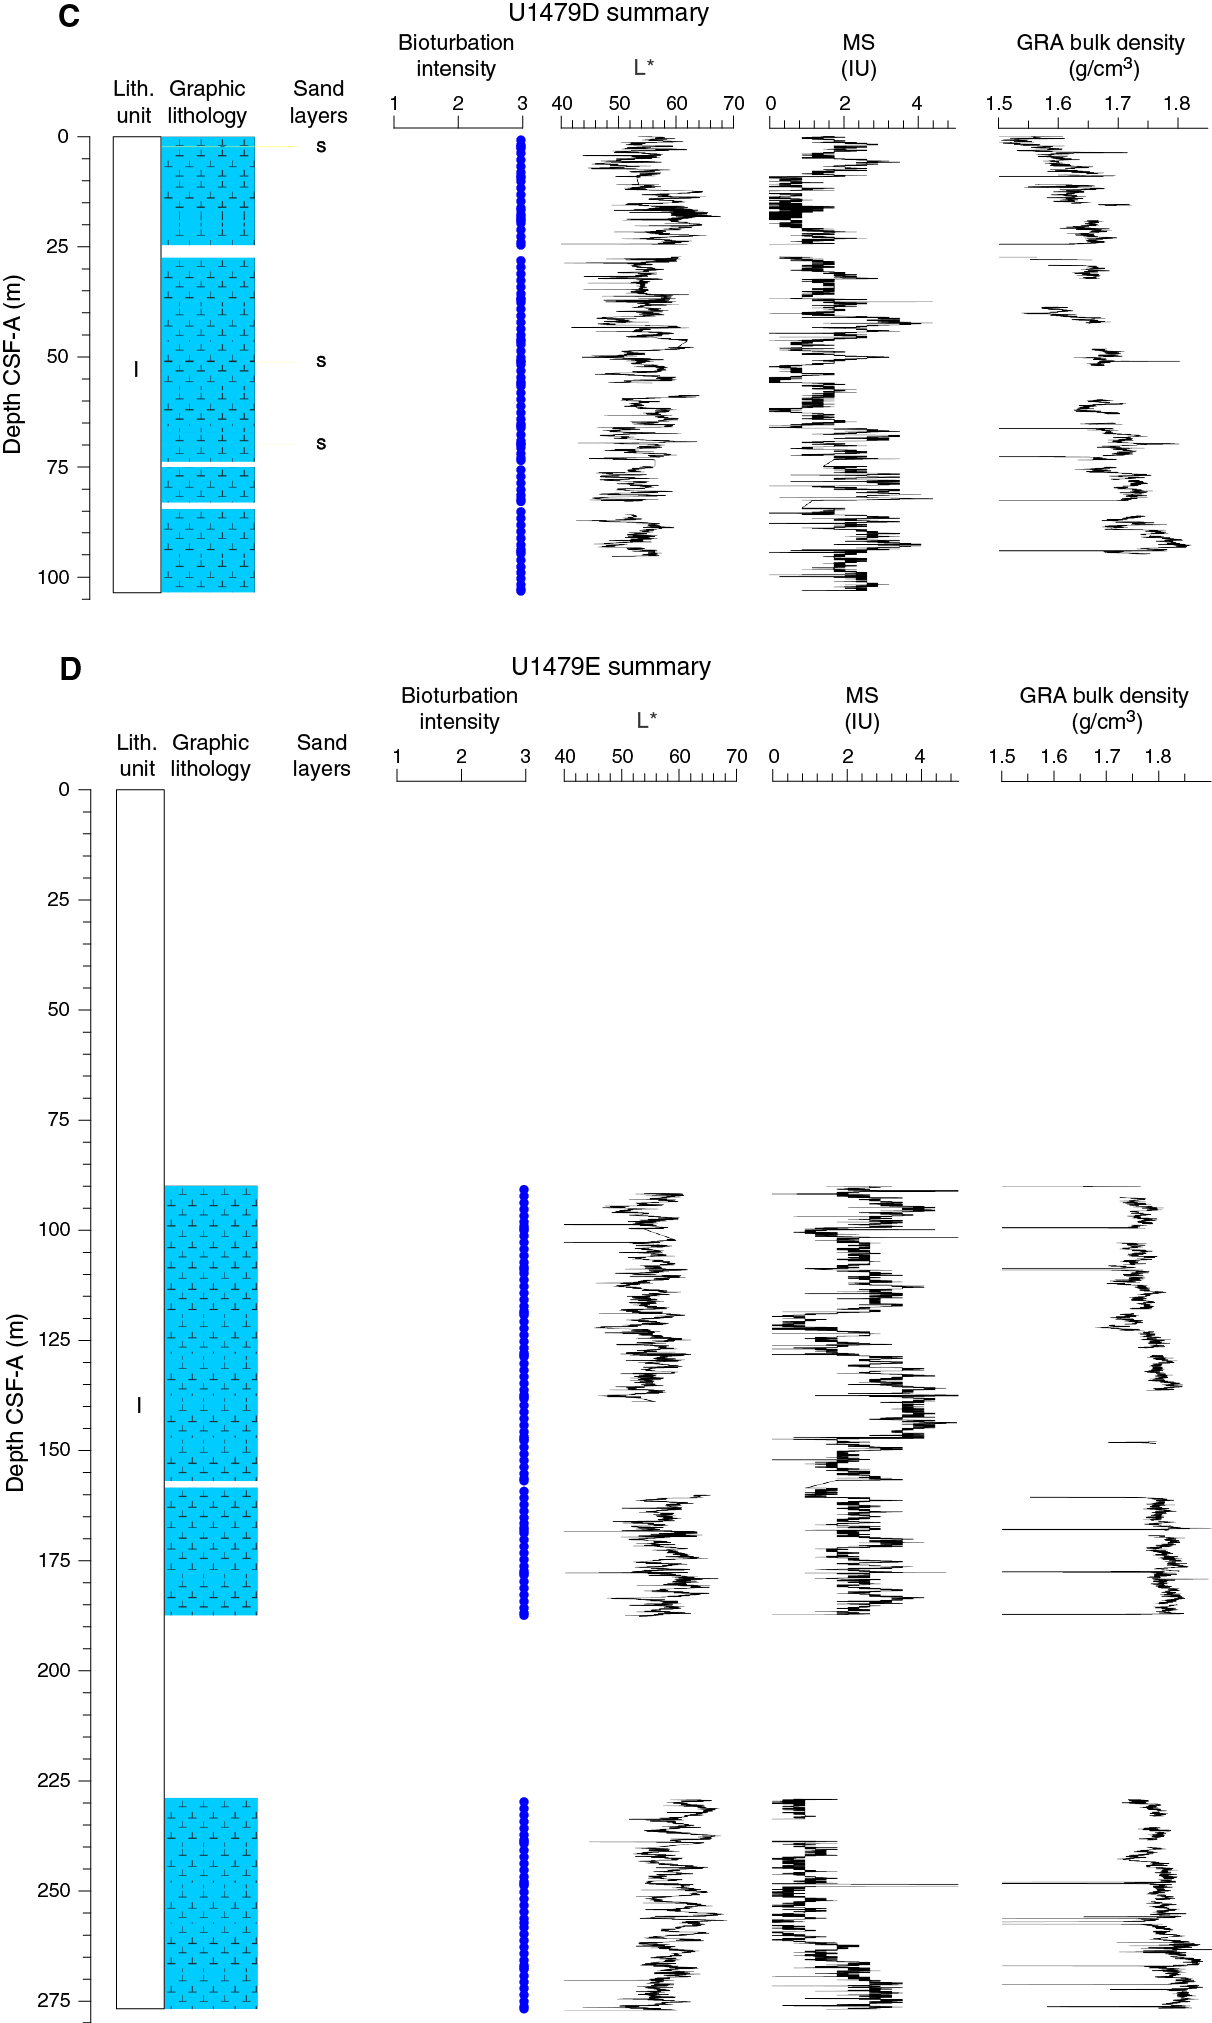
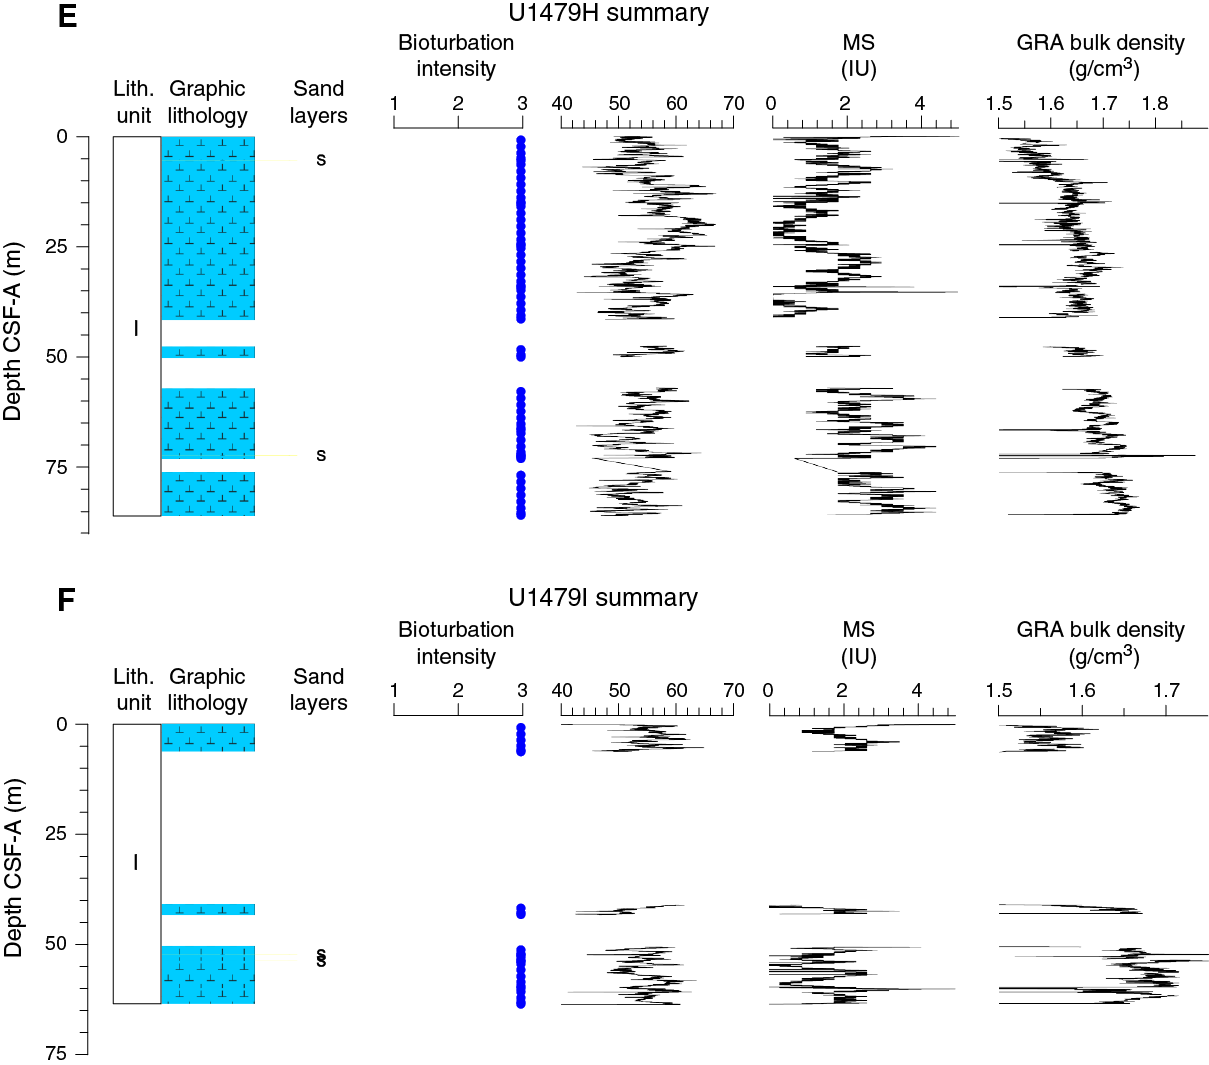
Figure F11. Lithostratigraphic summary with selected physical properties and geochemical data.
Table T2. Overview of shipboard sampling with number of samples taken, Holes U1479A–U1479D. Download table in .csv format.
Lithostratigraphic unit description
Unit I
- Intervals: 361-U1479A-1H-1, 0 cm, through 1H-CC, 14.5 cm; 361-U1479B-1H-1, 0 cm, through 32H-CC, 6.5 cm; 361-U1479C-1H-1, 0 cm, through 32H-CC, 60 cm; 361-U1479D-1H-1, 0 cm, through 12H-CC, 13 cm; 361-U1479E-1H-1, 0 cm, through 18H-CC, 25 cm; 361-U1479F-1H-1, 0 cm, through 1H-CC, 13.5 cm; 361-U1479G-1H-1, 0 cm, through 1H-CC, 13 cm; 361-U1479H-1H-1, 0 cm, through 10H-CC, 33 cm; 361-U1479I-1H-1, 0 cm, through 5H-CC, 12.5 cm
- Depths: Hole U1479A = 0–1.01 m CSF-A; Hole U1479B = 0–300.98 m CSF-A; Hole U1479C = 0–296.03 m CSF-A; Hole U1479D = 0–103.22 m CSF-A; Hole U1479E = 0–276.87 m CSF-A; Hole U1479F = 0–9.50 m CSF-A; Hole U1479G = 0–9.29 m CSF-A; Hole U1479H = 0–86.08 m CSF-A; Hole U1479I = 0–63.60 m CSF-A
- Age: late Miocene to Holocene
Unit I is composed of light greenish gray (GLEY 1 7/10Y; 5Y 7/2), greenish gray (GLEY 1 6/10Y), and light olive-gray (5Y 6/2) nannofossil ooze with or without foraminifers (Figure F12).

Figure F12. Representative lithologies per interval, Site U1479.
Drilling disturbance
Different types of drilling disturbances are observed in the cores from Site U1479 (Figure F13). The uppermost part of the first sections of most cores from all holes is often soupy. Many cores in Holes U1479D and U1479E show intense flow-in disturbance. In addition, fragmented sediment and voids were also occasionally observed.
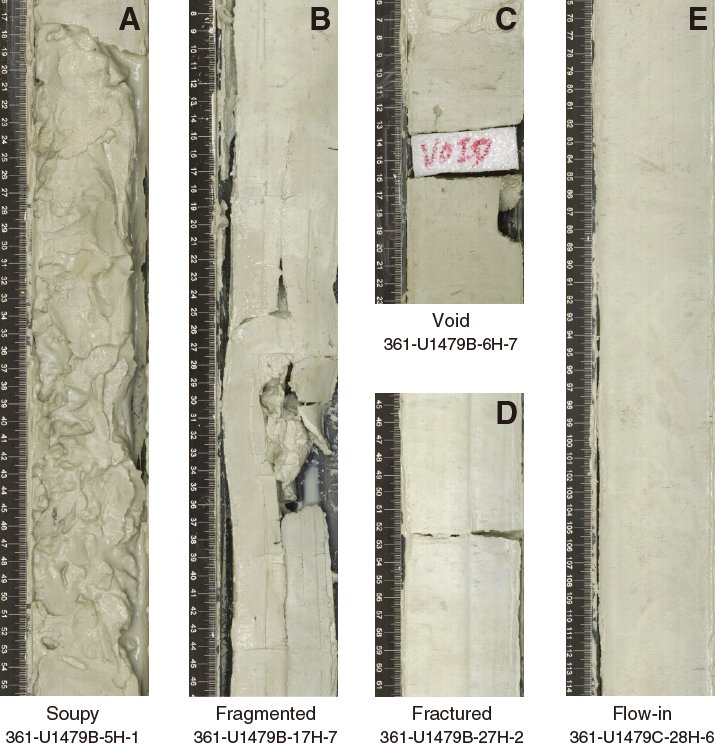
Figure F13. Sediment deformations and disturbances, Site U1479.
Lithologies and composition
Smear slide observations show that biogenic materials (82% ± 5% on average) are the principal component of the sediment (Table T3; Figure F14). The biogenic fraction is dominated by nannofossils (63% ± 9% on average) and foraminifers (11% ± 5%). The composition of the terrigenous component is dominated by quartz (8% ± 2% on average) and clay minerals (6% ± 5%) with common presence of pyrite and rarely glauconite. Sediment grain sizes consist of 70% (±9%) clay on average, 19% (±6%) silt, and 11% (±4%) sand.
Table T3. Sediment textures, compositions, and lithologic names determined by smear slide analysis, Holes U1479A–U1479C. Download table in .csv format.
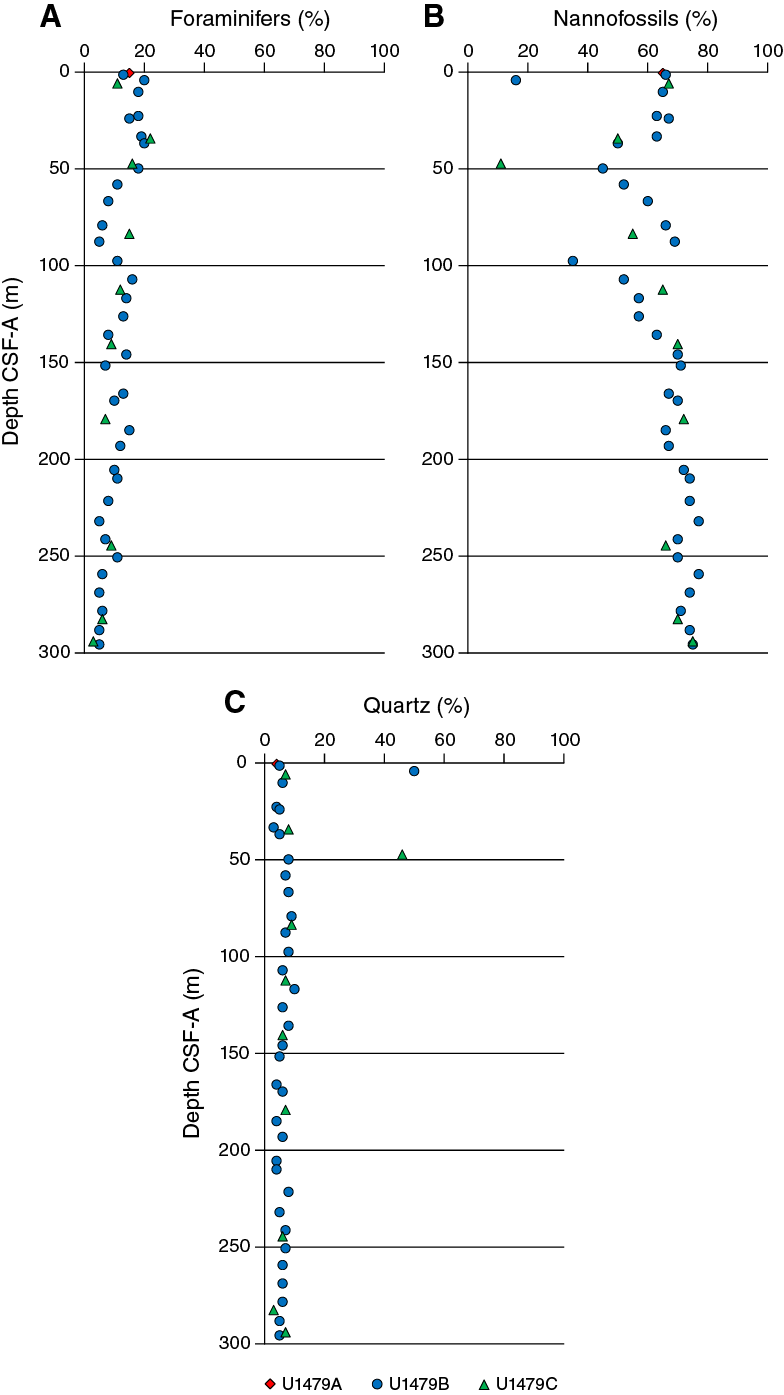
Figure F14. Major compositions of sediment determined by smear slide observation, Holes U1479A–U1479C.
The average abundance of total biogenic carbonate in the sediment of Hole U1479B was estimated at 74% ± 7% based on smear slides descriptions (Table T3). This result is in broad agreement with geochemical analyses (see Geochemistry), of ~67 wt% (range = 51–91 wt%) carbonate content (Figure F15).

Figure F15. CaCO3 content of discrete samples and biogenic carbonate estimated in smear slides, Hole U1479B.
Structures
No primary sedimentary structures were observed. Bioturbation is the only secondary sedimentary structure and is widespread throughout the sequence. The most common indicator of bioturbation is centimeter-scale diffuse mottling. Discrete ichnofossil burrows (Planolites) were commonly observed, which are often surrounded by thin darker bands. Bioturbation intensity ranges from moderate to strong (Figure F11).
Color
The color of the nannofossil ooze is greenish gray (GLEY 1 6/10Y) and light greenish gray (GLEY 1 7/10Y; 5Y 7/2) to light olive-gray (5Y 6/2).
Discussion
Site U1479 is located on the mid-to-lower western slope of the Agulhas Bank in Cape Basin at 2620 mbsl. The dominance of biogenic materials and moderate sedimentation rates are in accord with prevailing pelagic sedimentation in this area. The occurrence of intervals rich in sand-sized quartz and foraminifers further suggests the deposition associated with winnowing activity of currents, perhaps contourites and/or turbidites. The extensive bioturbation in the sediment at Site U1479 points to an oxygen-rich deep-sea environment throughout the sequence. This could be potentially attributed to the penetration and ventilation of deep water masses (presently interactions between NADW and Antarctic Bottom Water) (Gordon et al., 1987; Arhan et al., 2003; van Aken et al., 2004; Lutjeharms, 2006), although deep-water property changes might be expected at glacial–interglacial timescales. Pyrite forms when bacterial processes couple organic carbon oxidation with the reduction of sulfate. This reaction creates sulfide that can in turn react with dissolved or mineral iron to produce pyrite (Canfield and Raiswell, 1992; Schoonen, 2004). The presence of pyrite in Unit I points to presence of available iron in the sediment, probably associated with terrigenous dust and/or bottom- or surface-current supply, which would enhance early diagenesis processes at Site U1479.
Physical properties
Physical property measurements were completed on whole-round sections and section halves from cores collected from Holes U1479A–U1479I. Gamma ray attenuation (GRA) density, magnetic susceptibility (MS), P-wave velocity (VP), and natural gamma radiation (NGR) measurements were made on all whole-round sections using the Special Task Multisensor Logger (STMSL) and the Whole-Round Multisensor Logger (WRMSL). Scans with the Natural Gamma Radiation Logger (NGRL) were done for all cores in Holes U1479A–U1479C as well as a few cores in Hole U1479D–U1479I for stratigraphic correlation. In all cases, STMSL sampling resolution was set to 2.5 cm, WRMSL sampling resolution was set to 2.5 cm, and NGRL sampling resolution was set to 10 cm. All sections were first logged using the STMSL without waiting for thermal equilibration, generating a set of GRA density and MS data that was used for stratigraphic correlation. Following thermal equilibration (after the temperature reached 19°C), the sections were logged using the WRMSL, generating VP and another set of GRA and magnetic susceptibility data and then logged using the NGRL.
Three samples per core were taken for moisture and density (MAD) measurements from the working-half sections of Hole U1479B. The samples were taken typically from Sections 2, 4, and 6 with few exceptions based on visual inspection. The MAD (index) properties determined on 91 samples from Hole U1479B include bulk density, dry density, grain density, porosity, void ratio, and water content. Spectral color reflectance and magnetic susceptibility were measured at a resolution of 4 cm on the archive-half sections using the Section Half Multisensor Logger (SHMSL). Red, green, and blue (RGB) were measured on the Section Half Imaging Logger (SHIL).
Diffuse reflectance spectrometry and digital color image
Spectral reflectance parameter L* (Figure F16) in Hole U1479B averages 57 ± 4. L* values are between 45 and 70 and exhibit cyclic variability throughout. These oscillations have wavelengths of 1 to 5 m. In general, the long-term trend as well as the cyclic behavior of L* are strongly anticorrelated to NGR, with lower L* values characterizing the more clay rich (high NGR count) intervals. Average color reflectance values for a* and b* are –0.7 ± 0.4 and 4.0 ± 1.5, respectively. Cyclic amplitude changes in a* also show a strong anticorrelation with NGR, whereas b* shows a much weaker correlation to NGR (Figure F17).
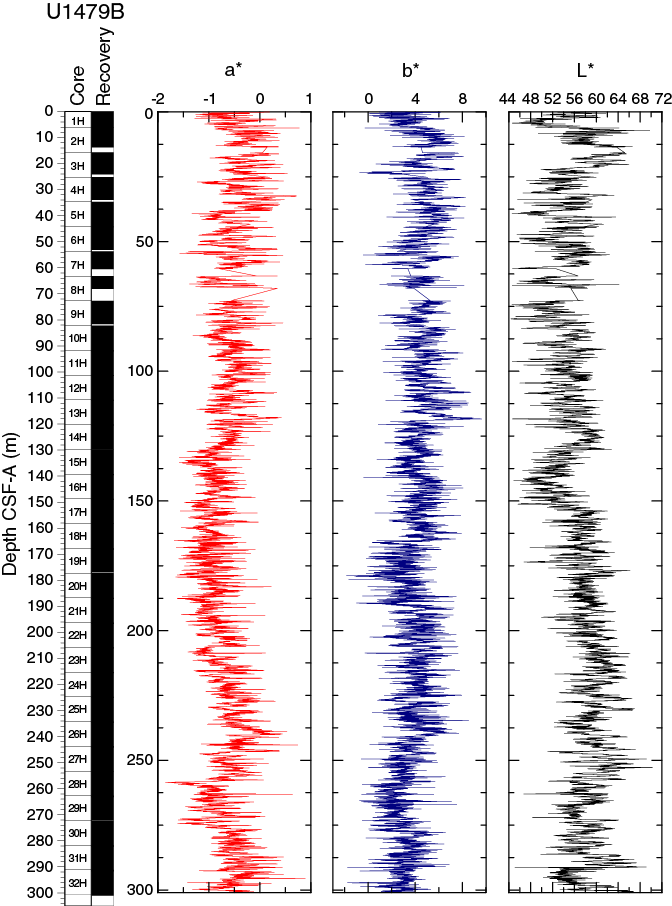
Figure F16. Color reflectance, Hole U1479B.
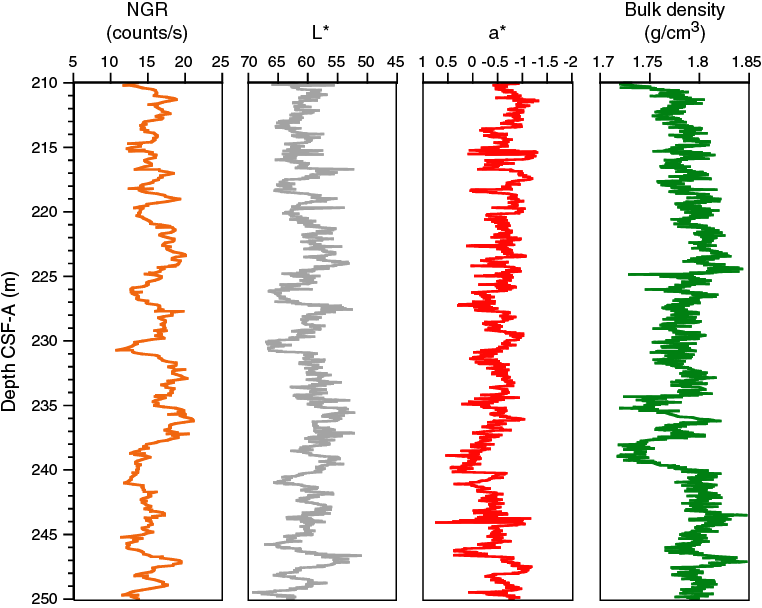
Figure F17. Comparison of cyclic changes in NGR, L*, a*, and bulk density between 210 and 250 m CSF-A, Hole U1479B.
RGB values obtained from the SHIL were measured on the moist surface of the archive halves of split cores. RGB data have average values of R = 109 ± 15, G = 109 ± 15, and B = 91 ± 15 (Figure F18) and show a cyclic pattern. RGB data broadly correspond with color reflectance parameter L* and are anticorrelated to NGR (Figure F19).
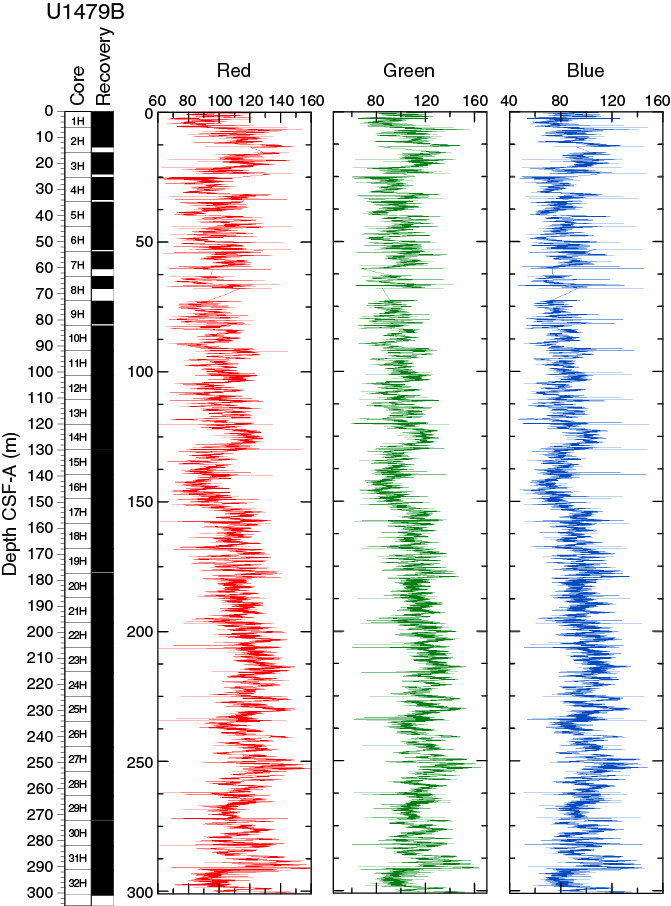
Figure F18. SHIL RGB color data, Hole U1479B.
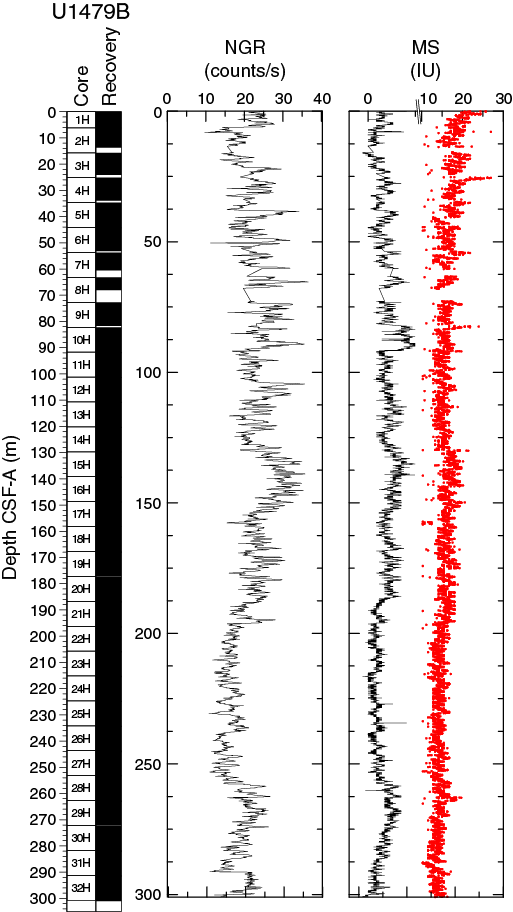
Figure F19. NGR and magnetic susceptibility, Hole U1479B.
Natural gamma radiation
The average NGR value in Hole U1479B is 21 ± 5 counts/s (Figure F19). From the seafloor to 140 m CSF-A, average NGR values gradually increase from 21 to 32 counts/s. Superimposed on this trend are cyclic amplitude changes of up to 18 counts/s. From 140 to 205 m CSF-A, NGR values decrease from 32 to 15 counts/s. Cyclic changes around this trend are variable in amplitude and frequency. From 205 to 255 m CSF-A, NGR fluctuates around an average of 16 ± 2 counts/s followed by an interval of higher values (21 ± 2 counts/s) between 255 and 274 m CSF-A. Below 274 m CSF-A, NGR decreases gradually again to 13 counts/s at 290 m CSF-A. A slumped interval (see Sedimentology) at the bottom of the hole (290–300 m CSF-A) has an average NGR of 21 ± 3 counts/s.
Magnetic susceptibility
Whole-round core (WRMSL) measurements of magnetic susceptibility in Hole U1479B (Figure F19) have a very low average of 1.7 ± 1.0 instrument units (IU; ~10–5 SI), indicating a low content of magnetic minerals throughout the hole. However, magnetic susceptibility and NGR correlate well, suggesting that the variability in both records is driven by the relative proportions of terrigenous and biogenic components. Point magnetic susceptibility (SHMSL) fluctuations track the magnetic susceptibility data from whole-round core measurements but with higher absolute IU values.
Compressional wave velocity
P-wave velocity data measured with the WRMSL (Figure F20) were cleaned of outliers caused by section breaks. Average velocities display a linear trend with increasing values from the seafloor (1490 m/s) to 135 m CSF-A (1550 m/s). Superimposed on this trend are cyclic variations with amplitude changes of up to 40 m/s. From 135 to 289 m CSF-A, the cyclic changes continue, and velocities fluctuate around an average of 1529 ± 11 m/s. At 289 m CSF-A, a step-like increase to significantly higher velocities (1580–1670 m/s) occurs in the slumped interval (see Sedimentology) in the lowermost part of Hole U1479B.
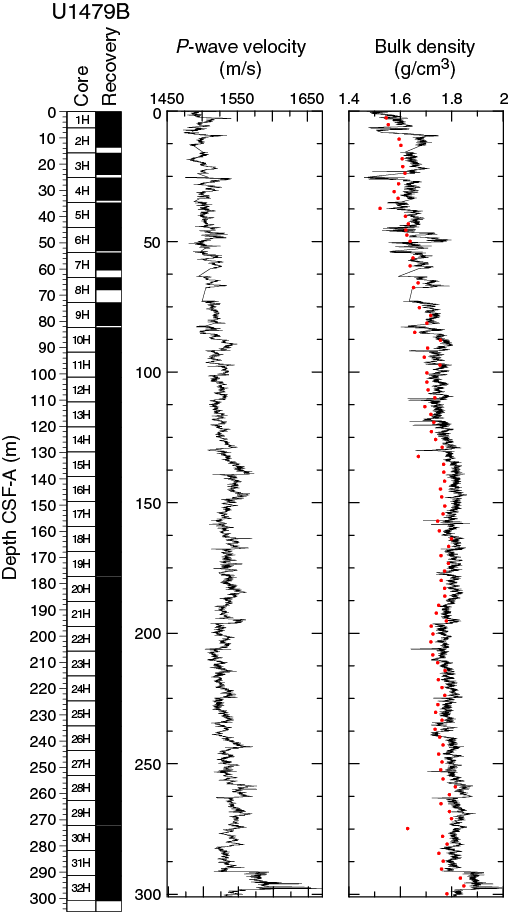
Figure F20. P-wave velocity and bulk density, Hole U1479B.
Moisture and density
Bulk density at Site U1479 was determined on whole-core sections using the STMSL and WRMSL (GRA density) and on discrete MAD samples. Changes in GRA and MAD bulk densities are well correlated, with good agreement in absolute values throughout Site U1479 (Figure F20). The GRA bulk density profile shows a linear increasing trend from the seafloor (1.49 g/cm3) to 135 m CSF-A (1.83 g/cm3). From 135 to 289 m CSF-A, density values fluctuate cyclically around an average of 1.80 ± 0.03 g/cm3. At 289 m CSF-A, densities suddenly significantly increase, jumping to ~2 g/cm3 in the lowermost part of Hole U1479B. Grain density is 2.74 ± 0.02 g/cm3 on average and varies between 2.69 and 2.8 g/cm3 (Figure F21).
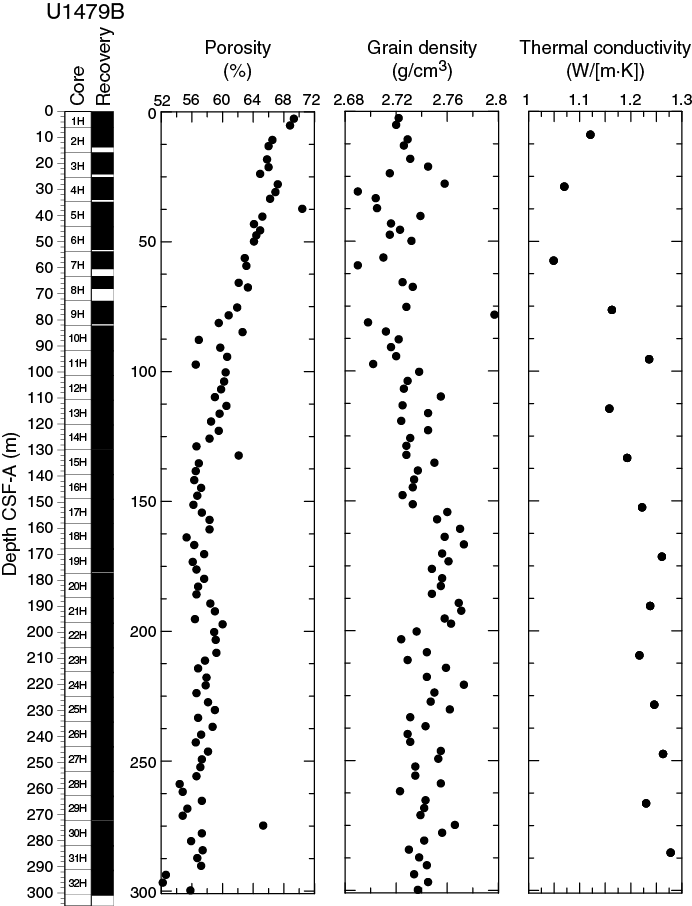
Figure F21. Porosity, grain density, and thermal conductivity, Hole U1479B.
The porosity values of Hole U1479A decrease downhole from 70.4% to 52.2%. This trend, resulting from sediment compaction, is inverse to the trend observed in GRA bulk density (Figure F20).
Thermal conductivity
Thermal conductivity measurements were performed on every other core from Hole U1479B using the full-space needle probe near the middle of the section measured (Figure F21). Overall, thermal conductivity values increase from 1.12 W/(m·K) at 9 m CSF-A to a maximum of 1.28 W/(m·K) at 285 m CSF-A. The average gradient of this trend is 0.0007 W/(m2·K). A minimum in thermal conductivity of 1.05 W/(m·K) was observed at 57 m CSF-A.
Summary
At Site U1479, the lithology is homogeneous and has been classified as one lithostratigraphic unit (see Sedimentology). All high-resolution physical property records derived by core logging show cyclic changes albeit with noticeable differences in pattern (Figure F17) that are likely related to the lithologic alternations of intervals with different proportions of terrigenous and biogenic components (see Sedimentology) and thus may reflect changes in ocean circulation and/or terrigenous supply. A slump (see Sedimentology) in the lowermost part of Site U1479 is characterized by distinctly different physical properties.
Micropaleontology
Site U1479 recovered a biostratigraphically continuous sequence between the Late Pleistocene and the late Miocene with a bottom-hole age of ~7 Ma. Calcareous nannofossils, planktonic foraminifers, and diatoms were analyzed in the mudline, in 32 core catcher samples, and in selected split-core section samples (101 for calcareous nannofossils and 96 for foraminifers) at Site U1479. Most sampling focused on Hole U1479B; however, the mudline was retrieved from Hole U1479H and six additional samples were taken from Hole U1479C to better refine the stratigraphy of the upper portion of Site U1479. The sequence is biostratigraphically complete at the biozone level for planktonic foraminifers and calcareous nannofossils. Diatoms provide additional biostratigraphic constraints in the Pleistocene and the early Pliocene. Calcareous microfossils are abundant and mostly well preserved throughout Site U1479 with the occurrence of tropical, subtropical convergence, and upwelling-associated species. Diatoms and planktonic foraminifer assemblages include Southern Ocean elements. The microfossil assemblage includes benthic foraminifers, radiolarians, ostracods, sponge spicules, and fish teeth.
The biostratigraphy at Site U1479 is shown in Figure F22 with microfossil datums reported in Tables T4, T5, and T6. Calcareous nannofossil occurrences are presented in Table T7, and planktonic foraminifer occurrences are shown in Table T8. Typical examples of calcareous nannofossils at Site U1479 are presented in Figure F23. Representative species of planktonic foraminifers at Site U1479 are shown in Figure F24. The age-depth plot including the biochronology and magnetostratigraphic datums is discussed in the U1479 Age model section and is shown in Figure F37.
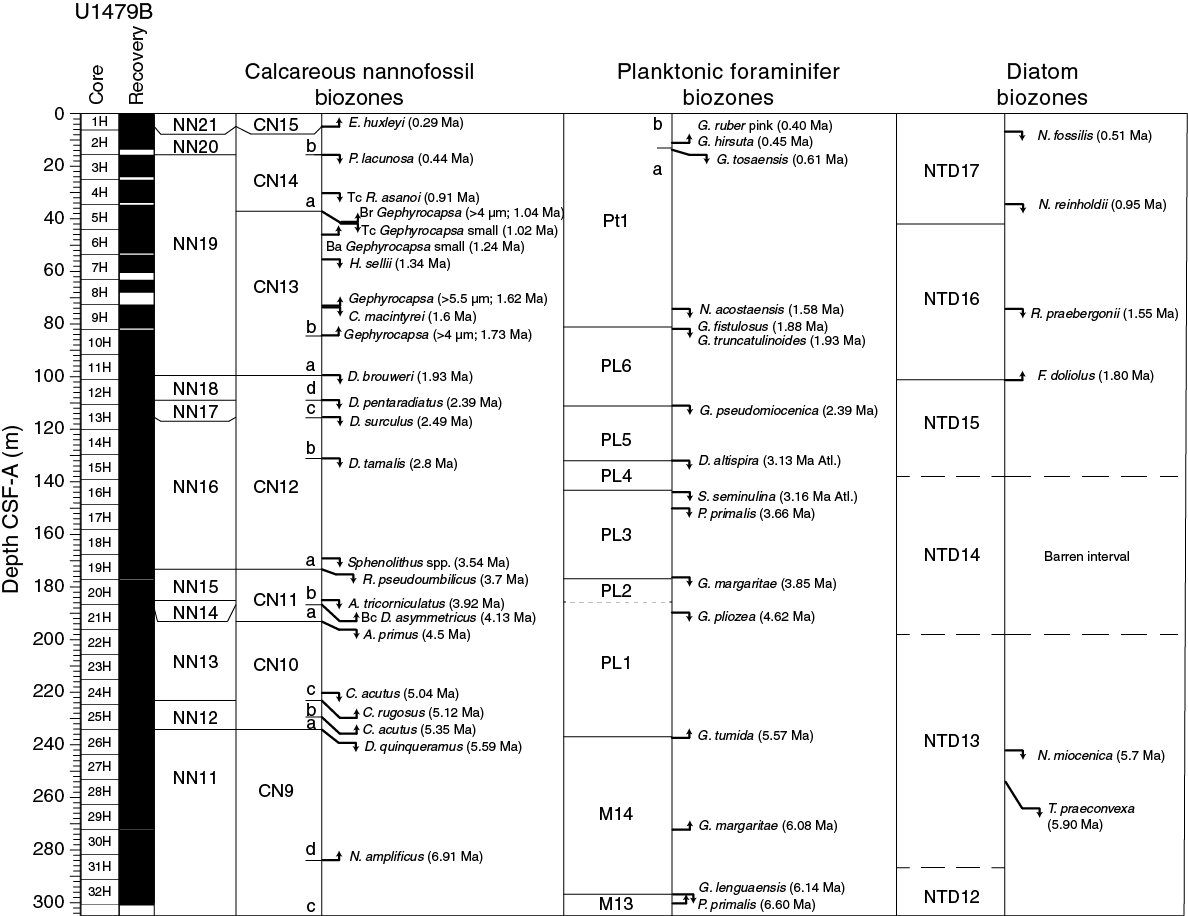
Figure F22. Biochronology at Site U1479 with the locations of significant planktonic foraminifer, calcareous nannofossil, and diatom events.
Table T4. Biostratigraphic planktonic foraminifer datums, Site U1479. Download table in .csv format.
Table T5. Biostratigraphic calcareous nannofossil datums, Site U1479. Download table in .csv format.
Table T6. Biostratigraphic diatom datums, Site U1479. Download table in .csv format.
Table T7. Calcareous nannofossil occurrence, Site U1479. Download table in .csv format.
Table T8. Planktonic foraminifer occurrence and abundance based on examination of the >150 µm fraction, Site U1479. Download table in .csv format.
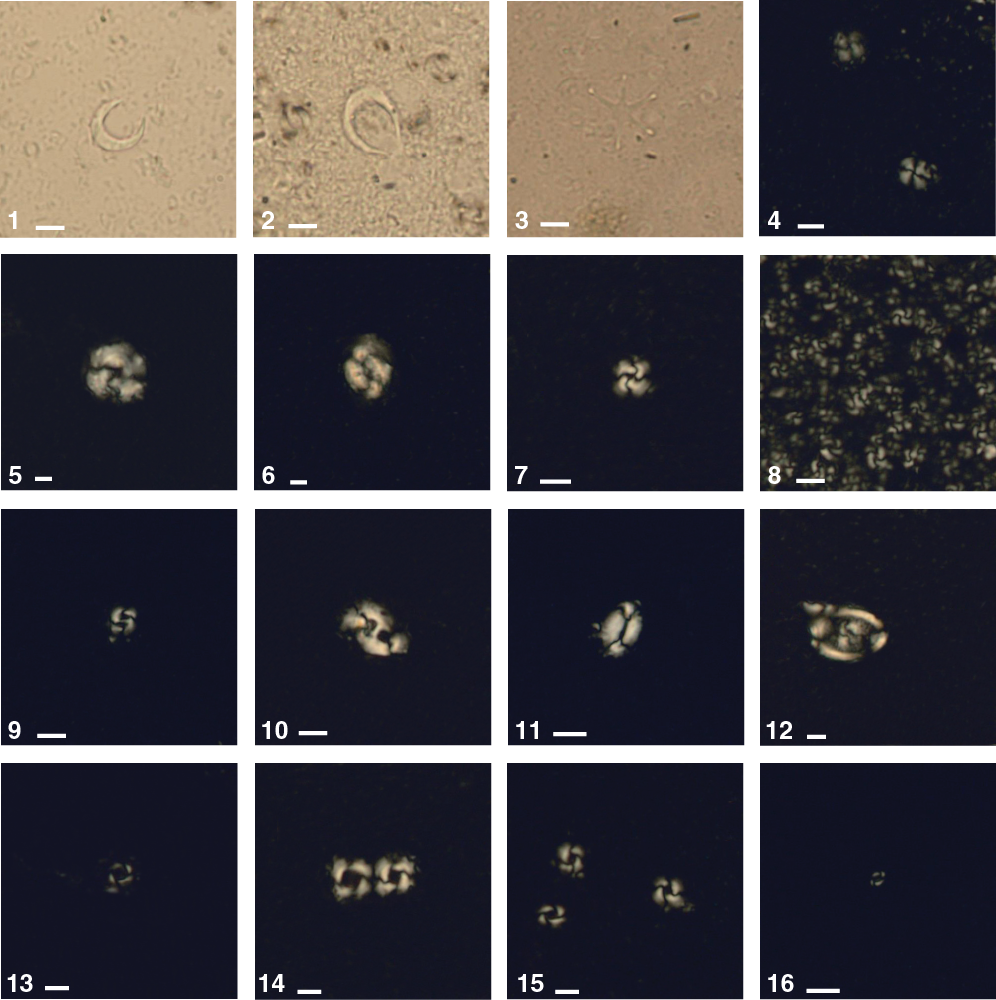
Figure F23. Calcareous nannofossils, Hole U1479B.

Figure F24. Representative foraminifers, Hole U1479B.
Calcareous nannofossils
Calcareous nannofossil assemblages were analyzed in the mudline of Hole U1479H, in 32 core catcher samples, and in 101 split-core section samples from Hole U1479B. The split-core section samples, analyzed only for marker species abundances, were selected based on the likelihood of the marker occurrence with particular attention to the top part of the hole. The core catcher investigations focused on calcareous nannofossil abundances of discrete taxa. A total of 24 nannofossil datums calibrated by Lourens et al. (2004) and Gradstein et al. (2012) were identified, assigning the Site U1479 sequence an age spanning the Late Pleistocene to the late Miocene. Based on occurrence and abundance, nannofossil datums are considered reliable unless otherwise stated. Fifty individual tropical, subtropical, and temperate species belonging to 22 genera were observed (for examples, see Figure F23). Calcareous nannofossil assemblages are abundant (>50% of sediment particles). Preservation varies between good and moderate. Reworking of species is generally low; however, the Late Pleistocene is characterized by more common occurrences of reworked specimens than in the rest of the sequence. Specimens of the Discoaster taxa tend to show broken arms, etching, and fragmentation, whereas individuals of the Ceratolithus taxa are rare and sparse. The assemblage is characterized by the occurrence of the temperate species Coccolithus pelagicus throughout the whole sequence. In detail, the abundance of C. pelagicus increases from Sample 361-U1479B-10H-CC (92.11 m CSF-A), between 1.62 and 1.93 Ma, and shows a high occurrence to the bottom of the hole.
The bases of Biozones NN21 and CN15 were observed in Sample 1H-4, 75 cm (4.90 m CSF-A), with the base occurrence of Emiliania huxleyi (0.29 Ma). The presence/absence of this species within the top of Hole U1479B was determined by analyzing the first core catcher and two split-core samples under the scanning electron microscope, which provides the appropriate magnification to reliably identify E. huxleyi. The top occurrence of Pseudoemiliania lacunosa (0.44 Ma) in Sample 3H-1, 75 cm (16.45 m CSF-A), defines the Biozone NN20/NN19 and Subzone CN14b/CN14a boundaries. Biozone NN19 and Subzone CN14a include the top common occurrence of Reticulofenestra asanoi (0.91 Ma) in Sample 4H-4, 75 cm (30.45 m CSF-A), and the top common occurrence of small Gephyrocapsa spp. (1.02 Ma) in Sample 5H-2, 75 cm (36.95 m CSF-A). Sample 5H-2, 75 cm (36.95 m CSF-A), is also characterized by the base reentrance of Gephyrocapsa spp. (>4 µm; 1.04 Ma), which marks the Subzone CN14a/CN13b boundary. Biozone NN19 and Subzone CN13b contain the base acme of small Gephyrocapsa spp. (<4 µm; 1.24 Ma) in Sample 5H-CC (44.41 m CSF-A), the top occurrence of Helicosphaera sellii (1.34 Ma) in Sample 7H-2, 75 cm (55.95 m CSF-A), the top occurrence of Calcidiscus macintyrei (1.6 Ma) in Sample 9H-1, 75 cm (73.45 m CSF-A), and the base occurrence of Gephyrocapsa spp. (>5.5 µm; 1.62 Ma) in Sample 9H-2, 75 cm (74.95 m CSF-A). The base occurrence of Gephyrocapsa spp. (>4 µm; 1.73 Ma) recognized in Sample 10H-2, 75 cm (84.45 m CSF-A), marks the Subzone CN13b/CN13a boundary. Sample 361-U1479B-11H-6, 75 cm (99.95 m CSF-A), defines the Biozone NN19/NN18 and Subzone CN13a/CN12d boundaries with the top occurrence of Discoaster brouweri (1.93 Ma). Finally, the tops of Biozone NN17 and Subzone CN12c were determined in Sample 12H-6, 75 cm (109.45 m CSF-A) based on the top occurrence of Discoaster pentaradiatus (2.39 Ma). The Pleistocene sequence is also characterized by the presence of Braarudosphaera bigelowii, Calcidiscus leptoporus, Discosphaera tubifera, Florisphaera profunda, Helicosphaera carteri, Helicosphaera inversa, Gephyrocapsa caribbeanica, Gephyrocapsa oceanica, Pontosphaera japonica, Pontosphaera multipora, and Syracosphaera pulchra.
Around the Pliocene/Pleistocene boundary, the top occurrence of Discoaster surculus (2.49 Ma) in Sample 13H-3, 75 cm (114.45 m CSF-A), defines the Biozone NN17/NN16 and Subzone CN12c/CN12b boundaries, and the top occurrence of Discoaster tamalis (2.8 Ma) in Sample 15H-2, 75 cm (131.95 m CSF-A), marks the Subzone CN12b/CN12a boundary. The top occurrence of Sphenolithus spp. (3.54 Ma) in Sample 18H-CC (168.23 m CSF-A) is assigned to Subzone CN12a. The transition to Biozone NN15 and Subzone CN11b is delineated by the top occurrence of Reticulofenestra pseudoumbilicus (3.7 Ma) in Sample 19H-4, 75 cm (172.95 m CSF-A). Sample 20H-6, 75 cm (185.45 m CSF-A), contains the top occurrence of Amaurolithus tricorniculatus (3.92 Ma), which marks the upper boundary of Biozone NN14 within Subzone CN11b. The base common occurrence of Discoaster asymmetricus (4.13 Ma) occurs in Sample 21H-1, 75 cm (187.45 m CSF-A), and marks the Biozone NN14/NN13 and Subzone CN11b/CN11a boundaries. The Subzone CN11a/CN10c boundary is marked by the top occurrence of Amaurolithus primus (4.5 Ma) in Sample 21H-5, 75 cm (193.45 m CSF-A). Biozone NN13 and Subzone CN10c are characterized by the top occurrence of Ceratolithus acutus (5.04 Ma) in Sample 24H-4, 75 cm (220.45 m CSF-A). The earliest Pliocene event at Site U1479 is the base occurrence of Ceratolithus rugosus (5.12 Ma) in Sample 24H-6, 75 cm (223.45 m CSF-A), which defines the Biozone NN13/NN12 and Subzone CN10c/CN10b boundaries. Besides the biozone markers, the Pliocene sequence includes other species from the Amaurolithus, Discoaster, Ceratolithus, and Reticulofenestra taxa.
The Miocene/Pliocene boundary sequence is marked by the base occurrence of C. acutus (5.35 Ma) in Sample 25H-4, 75 cm (229.95 m CSF-A), which is assigned to Biozone NN12 and delineates the Subzone CN10b/CN10a boundary. The transition to Biozone NN11 and Subzone CN9d is defined by the top occurrence of Discoaster quinqueramus (5.59 Ma) in Sample 25H-CC (234.59 m CSF-A). The oldest sediment is dated at ~7 Ma based on the base occurrence of Nicklithus amplificus (6.91 Ma) in Sample 31H-2, 75 cm (283.95 m CSF-A), which defines the Subzone CN9d/CN9c boundary. This last biostratigraphic datum has a lower quality score due to the scarcity of its occurrence.
Planktonic foraminifers
Planktonic foraminifers define a complete sequence of Pleistocene to Miocene datums between Subzone Pt1b and Biozone M13 (see Age model). Planktonic foraminifer faunas are dominated by species typical of the subtropical convergence and western boundary currents, although there are very small numbers of individuals representing species from subpolar waters or upwelling systems throughout the sequence. Foraminifers are mostly well preserved in Hole U1479B with the frequent occurrence of glassy and semi-translucent specimens to the bottom of Hole U1479B. Still, a subset of samples throughout the sequence have moderate preservation, reflecting extensive fragmentation in the >63 µm fraction, and sometimes chalky preservation. Reworking is low. Foraminifers are typically common in 10 cm3 samples taken in split sections, reflecting foraminifer abundances of ~5% or less in most sediment at the site.
Planktonic foraminifers were examined in core catcher samples in Hole U1479B and in alternating split core sections. The core catcher samples were all washed upon recovery, whereas split-core section samples were dried completely before processing and soaked in a dilute borax solution. This procedure made the samples easy to disaggregate and likely resulted in an improvement in foraminifer quality in the washed sand fraction compared to the core catcher samples. Despite the borax and drying treatment, some samples required two washing cycles to remove small sediment clumps. Examples of the major foraminifer taxa present at Site U1479 are illustrated in Figure F24. Stratigraphic ranges of species are shown in Table T8.
The Pleistocene Biozone Pt1 sequence (0–1.88 Ma) extends until Sample 361-U1479B-9H-CC (81.59 m CSF-A). Globigerinoides ruber (pink) has its base occurrence (0.4 Ma) in Sample 2H-5, 70–72 cm (11.90 m CSF-A), and was found together with the base occurrence of Globorotalia hirsuta (0.45 Ma). The top occurrence of Globorotalia tosaensis (0.61 Ma) is in Sample 2H-CC (13.70 m CSF-A) and marks the Subzone Pt1b/Pt1a boundary. Globorotalia tosaensis has fairly regular occurrence in Hole U1479B, suggesting that it is a reliable biozone marker. Specimens of G. tosaensis have angular peripheries near their extinction, requiring careful checking for the perforate rim that reliably distinguishes them from the full keel in Globorotalia truncatulinoides. Notably, specimens of G. tosaensis tend to develop more rounded chambers and lower spires in the older parts of their range in Hole U1479B and other Expedition 361 sites, making them resemble unkeeled examples of Globorotalia crassaformis. However, the presence of five chambers in the last whorl is a reliable characteristic of G. tosaensis compared to the four chambers in the final whorl of G. crassaformis.
We found the top occurrence of Neogloboquadrina acostaensis (1.58 Ma) in Sample 9H-1, 70–72 cm (73.40 m CSF-A). The top occurrence of Globoturborotalita apertura (1.64 Ma) is not well defined in Hole U1479B and occurs in Sample 11H-1, 70–72 cm (92.40 m CSF-A), well below its expected extinction datum. Globoturborotalita apertura has a well-defined range in the rest of the Pliocene, suggesting that its apparently premature disappearance is related to ecological exclusion. The biozone marker for the base of Subzone Pt1a, the top occurrence of Globigerinoides fistulosus (1.88 Ma), occurs in Sample 9H-CC (81.59 m CSF-A) together with the base occurrence of G. truncatulinoides (1.93 Ma). Notably, G. fistulosus is found in only two samples and is not a reliably determined datum. However, the base occurrence of G. truncatulinoides is defined by the typical occurrence of this species in the rest of its range and is likely a more reliable datum than that of G. fistulosus. Globigerinoides extremus was not sufficiently present in this section to count as a reliable datum. The base of Biozone PL6 is marked by the top occurrence of Globorotalia pseudomiocenica (2.39 Ma) in Sample 12H-CC (111.01 m CSF-A). Individual occurrences of G. pseudomiocenica were identified in three samples above this position. However, we did not consider these occurrences because they are present as single specimens well separated from the otherwise very regular range of the species below its datum. The top of Biozone PL5 is also approximated by the top occurrence of Globorotalia limbata (2.39 Ma) in Sample 13H-1, 70–72 cm (111.40 m CSF-A). The Pleistocene foraminifer assemblage is dominated by Globorotalia inflata, which typically constitutes 30%–50% of each sample. Common species of upwelling systems like Globigerina bulloides, Globigerina falconensis, Globigerina glutinata, and Neogloboquadrina dutertrei are also important constituents of the Pleistocene assemblage. The subpolar species Neogloboquadrina pachyderma (dextral) occurs in very high abundance in several samples of this interval, as well as the occasional presence of the polar variety of N. pachyderma (sinistral). Other minor components include the “Agulhas Leakage Fauna” (Peeters et al., 2004) of G. ruber, Globigerinoides sacculifer, Globigerinella siphonifera, G. crassaformis, Globorotalia menardii, Globorotalia scitula, and Pulleniatina obliquiloculata.
Biozone PL4 is recorded by the top occurrence of Dentoglobigerina altispira in Sample 15H-5, 70–72 cm (136.40 m CSF-A). Here we use its Atlantic Ocean calibrated datum at 3.13 Ma (Gradstein, 2012) because of the location of Site U1479. Dentoglobigerina altispira has a consistent occurrence without outliers from its top occurrence toward the bottom of the hole, which makes it one of the best-determined foraminifer markers for Site U1479. The top occurrence of D. altispira is followed closely by the top occurrence of Sphaeroidinellopsis seminulina (marker for the base of Biozone PL4) in Sample 16H-3, 70–72 cm (142.90 m CSF-A). The age of S. seminulina is calibrated in the Atlantic Ocean at 3.16 Ma (Gradstein et al., 2012). Biozone PL3 also includes the top occurrence of Pulleniatina primalis (3.66 Ma) in Sample 17H-1, 70–72 cm (149.40 m CSF-A), and top occurrence of Globorotalia margaritae (3.85 Ma; marking the base of Biozone PL3) in Sample 19H-CC (176.92 m CSF-A).
We were unable to distinguish Biozone PL2 and the top of Biozone PL1 because of the rare occurrences of the biozone marker Globoturborotalita nepenthes. The top occurrence of G. nepenthes occurs as a single specimen in Sample 24H-5, 70–72 cm (221.90 m CSF-A), and then is found in only two other samples in the hole. However, the upper part of Biozone PL1 is approximated by the top occurrence of Globorotalia pliozea (4.62 Ma) in Sample 21H-1, 70–72 cm (187.40 m CSF-A). This species is also a reliable marker for other Expedition 361 sites, but at Site U1479 G. pliozea is frequent to abundant in many samples, like other members of the subtropical convergence fauna (Figure F24). The base of Biozone PL1 is marked by the base occurrence of Globorotalia tumida (5.57 Ma) in Sample 26H-3, 70–72 cm (237.90 m CSF-A).
Below Biozone PL1, the final portion of Hole U1479B includes Miocene Biozones M14 and M13, recorded by the top occurrence of Globorotalia lenguaensis (6.14 Ma), the marker for the base of Biozone M14 in Sample 32H-5, 5–7 cm (297.25 m CSF-A). The bottom occurrence of G. margaritae (6.08 Ma) occurs above the recorded top occurrence of G. lenguaensis in Sample 29H-CC (272.08 m CSF-A) and is within the lower part of Biozone M14. Sample 32H-CC (300.98 m CSF-A) contains Pulleniatina primalis (6.60 Ma; but without either G. margaritae or G. lenguaensis), whose base occurrence marks the Biozone M13.We have no older calibrated markers below the top occurrence of P. primalis, although the abundance of Globorotalia conomiozea suggests that the bottom of Hole U1479B is younger than 7.1 Ma.
The Pliocene foraminifer assemblage is typified by regular occurrences of G. extremus, G. sacculifer, G. bulloides, G. falconensis, N. pachyderma (sinistral), G. apertura, N. dutertrei, and G. crassaformis. Species typical of the subtropical convergence are also common, including G. pliozea and G. conomiozea. Warm subtropical elements are also present, albeit in low numbers and include G. pseudomiocenica, G. limbata, G. menardii, S. seminulina, and Orbulina universa. The site also includes the distinct change-over from assemblages containing frequent to abundant G. crassaformis below Sample 23H-CC (215.60 m CSF-A) to assemblages dominated by G. inflata above this point.
Siliceous microfossils
Diatom biostratigraphy is based on the analysis of the mudline sample, 32 core catcher samples, and selected intervals in the split-core section (14 samples) in Hole U1479B. To enhance biostratigraphic resolution, split-core section samples made for nannofossil assessment were used to find diatom datums and abundances (Table T9). Siliceous microfossils are trace to few (~5%–10% of the sediment) in abundance and exhibit poor to moderate preservation. Although diatom sampling resolution was not as high as that for calcareous microfossils, results are in broad agreement with datums observed in the planktonic foraminifer and calcareous nannofossil reports. The assemblage at this site is a mix of Southern Ocean and subtropical species; however, the dominant signal throughout the core is from the subtropical diatoms. The presence of other siliceous microfossils such as sponge spicules, phytoliths, silicoflagellates, and radiolarians is noted here for postcruise studies.
Table T9. Diatom and other siliceous microfossil occurrences, Site U1479. Download table in .csv format.
Diatom Biozone NTD17 spans from the mudline sample to Sample 361-U1479B-4H-5, 75 cm (31.95 m CSF-A), which is marked by the top occurrence of Nitzschia reinholdii (0.95 Ma). Within this biozone, we also recognize the top occurrence of Nitzschia fossilis (0.51 Ma) in Sample 1H-CC (6.25 m CSF-A). This biozone consists of subtropical taxa such as Azpeitia africana, Azpeitia nodulifera, Azpeitia tabularis, Fragilariopsis doliolus, N. fossilis, Nitzschia marina, N. reinholdii, Rhizosolenia bergonii, Shionodiscus oestrupii, Thalassionema nitzschioides, Thalassionema spp., Thalassiothrix spp., and Triceratium cinnamomeum. Also present are Southern Ocean taxa such as Fragilariopsis kerguelensis and Thalassiosira lentiginosa.
Pleistocene diatom Biozone NTD16 is defined by the base occurrence of F. doliolus (~1.8 Ma), which extends through Sample 11H-CC (101.51 m CSF-A). Additionally, the top occurrence of Rhizosolenia praebergonii (~1.55 Ma), which occurs in Sample 9H-1, 75 cm (73.45 m CSF-A), provides more age constraints for Biozone NTD16. This biozone consists of subtropical taxa such as A. africana, A. nodulifera, F. doliolus, Hemidiscus cuneiformis, N. fossilis, N. marina, N. reinholdii, R. bergonii, R. praebergonii, S. oestrupii, Thalassionema spp., T. nitzschioides, and Thalassiothrix spp. Additionally, Southern Ocean diatoms are present and represented by F. kerguelensis.
The early Pleistocene through early Pliocene diatom Biozones NTD15 and NTD14 are not defined at this site as a result of an interval that is barren of diatoms from Sample 15H-CC (139.62 m CSF-A) through 21H-CC (196.73 m CSF-A). Below the barren interval, the early Pliocene–late Miocene is poorly preserved and has trace abundances of tropical diatoms such as Azpeitia spp., H. cuneiformis, Nitzschia spp., T. nitzschioides, Thalassionema spp., and Thalassiothrix spp.
The late Miocene Biozone NTD13 is represented by two bioevents in Samples 26H-5, 70–72 cm (240.95 m CSF-A), and 27H-CC (253.34 m CSF-A). The first event is the top occurrence of Nitzschia miocenica (~5.7 Ma) and the second event is the top occurrence of Thalassiosira praeconvexa (~5.9 Ma). These markers do not define datum boundaries but aid in biostratigraphy at the site. The Biozone NTD13 and NTD12 interval at this site has trace abundances of diatoms that are poorly preserved, making age characterization using diatoms after the top occurrence of T. praeconvexa problematic. The assemblage of this zone is consists of Azpeitia spp., H. cuneiformis, Nitzschia spp., T. nitzschioides, Thalassionema spp., T. praeconvexa, and Thalassiothrix spp.
Paleomagnetism
Sediment cores from Site U1479 were recovered from Holes U1479B to U1479I. Holes U1479B and U1479C and were cored to maximum depths of about 300 m CSF-A, whereas Holes U1479D, U1479E, U1479H, and U1479I were spot cored to fill core gaps. All cores of Holes U1479B and U1479C were oriented using the FlexIt core orientation tool; however, not all cores from Holes U1479D and U1479E could be oriented due to misfiring. Archive halves from Holes U1479B, U1479C, U1479D, U1479E, U1479H, and U1479I were analyzed for their natural remanent magnetization (NRM) and remanence after a demagnetization step of 20–25 mT. Additional discrete samples were taken from Hole U1479B (Table T10) for NRM and isothermal remanent magnetization (IRM) acquisition experiments.
Table T10. Analyzed discrete whole-round samples, Hole U1479B. Download table in .csv format.
Discrete sample measurements
Rock magnetic parameters indicate generally low concentrations of magnetic minerals. Saturation IRM (SIRM) maximum values are ~50 mA/m in depths shallower than 100 m CSF-A in Hole U1479B and then decrease downhole to 25 mA/m at 250 m CSF-A (Figure F25). Below 250 m CSF-A, SIRM increases again to slightly higher values. Hard IRM (HIRM) and magnetic susceptibility measured with the Whole-Round Multisensor Logger (WRMSL) show similar trends as SIRM. S-ratios average ~0.94 in the upper 120 m CSF-A and increase downhole, broadly coinciding with decreasing SIRM and HIRM, which characterizes a shift in the relative proportions of low- and high-coercivity magnetic minerals. This shift occurs within the likely sulfidic zone (sulfate is absent), where dissolved iron concentrations are low (Figure F25; also see Geochemistry), suggesting that the ferrimagnetic iron oxides readily dissolved and iron is likely bound as sulfides.
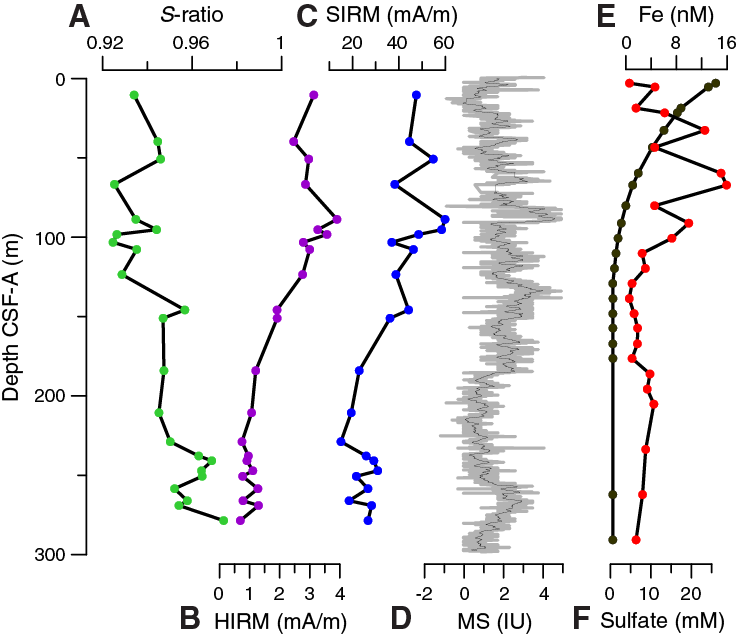
Figure F25. S-ratio, HIRM, and SIRM measured on discrete samples, Hole U1479B.
For discrete samples, NRM intensities are 10–5 to 10–4 A/m. The NRM of many samples is relatively weak, so intensities after demagnetization at fields higher than 15–25 mT do not exceed the background values of the spinner magnetometer, which are quite high due to noise of the shipboard environment.
For samples that have stronger intensities and show stable directions for at least two demagnetization steps, principal component analysis was performed using the DAIE workbook (Sagnotti, 2013) to detect the characteristic remanent magnetization (Figure F26). Samples from the upper part of the hole have inclinations of approximately –55°, as expected for normal polarity at the geographic location of Site U1479. The inclination and declination signals that were obtained from the discrete samples in Hole U1479B are in agreement with high-resolution downhole records (Figure F26).

Figure F26. Downhole inclination, corrected declination, and NRM intensity, Site U1479.
Archive-half measurements
All archive halves from Hole U1479B were analyzed for NRM, and intensities were measured after 15 and 25 mT demagnetization steps. Archive halves from Hole U1479C were analyzed for NRM, and intensities were measured after 25 mT demagnetization, whereas a lower demagnetization step of 20 mT was applied to Cores 361-U1479C-26H through 32H and all other cores at Site U1479. The 20–25 mT demagnetization steps appear to be sufficient to remove the overprint of the drill string on the inclination data. Sections with significant drilling disturbance such as soupy intervals and/or flow-in were mostly excluded from analysis. We only present paleomagnetic data for Holes U1479B and U1479C because they cover the whole stratigraphy recovered at Site U1479 (Figure F26). The NRM intensities of the archive-half magnetic measurements are generally in the order of 10–4 to 10–5 A/m. Although dissolution of magnetic minerals has affected the magnetic record (see above), the polarity signal is apparently preserved. Inclination data show distinct phases of normal and reversed polarity. Declination data that were corrected for core orientation show distinct intervals of normal (~180°) and reversed polarity, mirroring the pattern in inclination, particularly in Hole U1479C, where paleomagnetic data are less noisy compared to Hole U1479B.
Magnetostratigraphy
Because of coring gaps and drilled intervals that only covered certain parts of the complete stratigraphy, we assigned the phases of normal and reversed polarity to magnetic chrons on the basis of the spliced record (Table T11; Figure F27). We identified the bases of the Brunhes, Matuyama, Gauss, Gilbert, and C3An.1n (6.252 Ma) (sub)chrons. The noisy character of the record within the Gilbert Chron is likely due to short-term polarity reversals (~100 ky) that are not resolved in the weakly magnetic sediment at Site U1479, although further work on shore may allow refinement. The base of the Gilbert Chron and C3An.1n subchron are in agreement with age assignments from biostratigraphy.
Table T11. Polarity zone boundaries, Site U1479. Download table in .csv format.
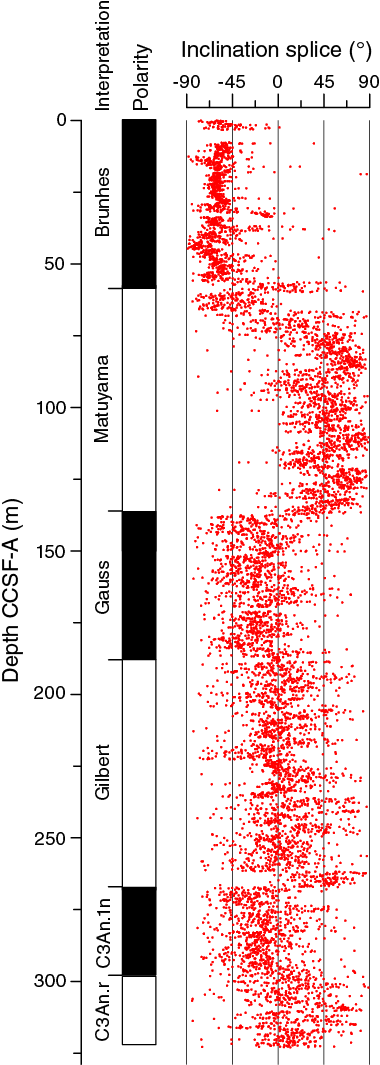
Figure F27. Spliced inclination record, Site U1479.
Stratigraphic correlation
Stratigraphic correlation of the holes at Site U1479 was, in varying respects, simultaneously complicated and straightforward. The difficulties were a product of both the sedimentology and the coring environment. For example, the generally high carbonate content of sediment at Site U1479 (see Geochemistry) resulted in very low magnetic susceptibility (see Physical properties), limiting the usefulness of this parameter for real-time correlation and avoidance of aligned gaps among holes. Furthermore, a convincing mudline could not be identified in Holes U1479B–U1479D, likely because of the soupiness of the uppermost sediment. As a result, Holes U1479F–U1479I were devoted to capturing a true mudline, and it was not until the last hole drilled (Hole U1479I) that the mudline anchor for the ultimate spliced record was obtained. Furthermore, adverse weather conditions resulted in several partial core recoveries in all the holes, as well as soupy top sections that were generally unusable for stratigraphy. In fact, Hole U1479D was abandoned after Core 361-U1479D-12H (102.8 m CSF-A) because the quality of recovery had diminished to an unacceptable level (see Operations). Hole U1479E started with a drilled interval of 90 m and was designed to supplement the lower section of Hole U1479B. However, because of weather-related time constraints, it was necessary to introduce a further drilled interval of 42 m between Cores 361-U1479E-12H and 14H in an attempt to recover material that might resolve an ambiguity (~248–256 m CSF-A) between Holes U1479B and U1479C. Finally, both Holes U1479H and U1479I were abandoned in consideration of deteriorating weather conditions.
On the other hand, the records of NGR and color (e.g., RGB green) display exceptionally clear variability in all undisturbed core sections; this clear expression made the alignment of cores relatively straightforward once all scanning was complete. Furthermore, comparatively constant offsets between cores in Holes U1479B and U1479C led to the development of a robust and nearly complete splice from the mudline (Hole U1479I) to the bottom of Hole U1479B (~300 m CSF-A). The generally clear stratigraphic relationship between Holes U1479B and U1479C only needed to be refined and supplemented in a few discrete intervals. Thus, despite the potential complicating circumstances, we can be relatively confident in the integrity of the ultimate spliced composite.
Compositing of holes
Compositing of sequences was accomplished primarily by correlating distinctive features in the color RGB green and NGR records (Figure F28). In general, this was a straightforward task once the ambiguities of the mudline were resolved. Also, intervals with potentially uncertain stratigraphy in the upper ~100 m of the section identified in Holes U1479B and U1479C were resolved through coring of subsequent holes. Thus, core offsets and an affine table (Table T12) could be constructed with considerable confidence to the bottom of Core 361-U1479C-27H at ~239 m CSF-A. Below this depth, dissimilarities in the NGR and color records in Holes U1479B, U1479C, and U1479E—in our view, most likely related to extreme stretching of the sequence in Core 361-U1479C-28H—prevent firm stratigraphic ties. Clear relationships resume below the base of Core 28H. We have made a best guess at the stratigraphic position of this core, but below this lone uncertain interval, the composite depth scale is effectively floating to a probably small, but uncertain extent.
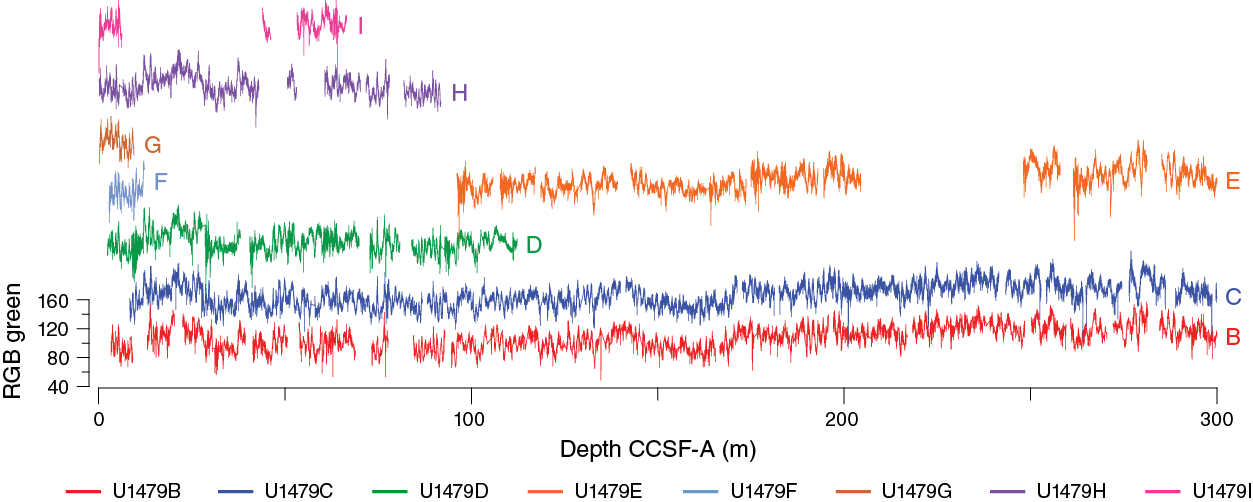
Figure F28. RGB green values, Site U1479.
Table T12. Affine table, Site U1479. Download table in .csv format.
Construction of the splice
Once the composite depth scale was created, select sequences from Holes U1479B–U1479E and U1479G–U1479I were spliced together to create the most complete and representative section possible (Figure F29; Table T13). Hole U1479I provided a mudline anchor for the top of the splice. From this point to the bottom of Hole U1479B, cores from most of the holes contributed to the construction of a continuous splice. Given the prevalence of weather-related coring disturbance, the selection of cores for inclusion in the splice relied on detailed scrutiny of visual core descriptions, and considerable care was taken to avoid intervals that were sampled for interstitial water samples (Hole U1479B). Below ~100 m core composite depth below seafloor (CCSF-A), the splice drew most heavily on the cores from Holes U1479B and U1479C, as they were the least disturbed. We have tentatively bridged the uncertain interval associated with Core 361-U1479C-28H because we are confident that the uncertainty may be resolved with additional stratigraphic analyses (e.g., shore-based analysis of foraminiferal oxygen isotopes). In any case, as with the composite depth scale the shipboard splice is currently floating below this point, despite its apparent continuity. Finally, the resulting splice was checked in all the variables that were used for correlation to ensure that there were no artificial gaps, jumps, or repeated sequences.
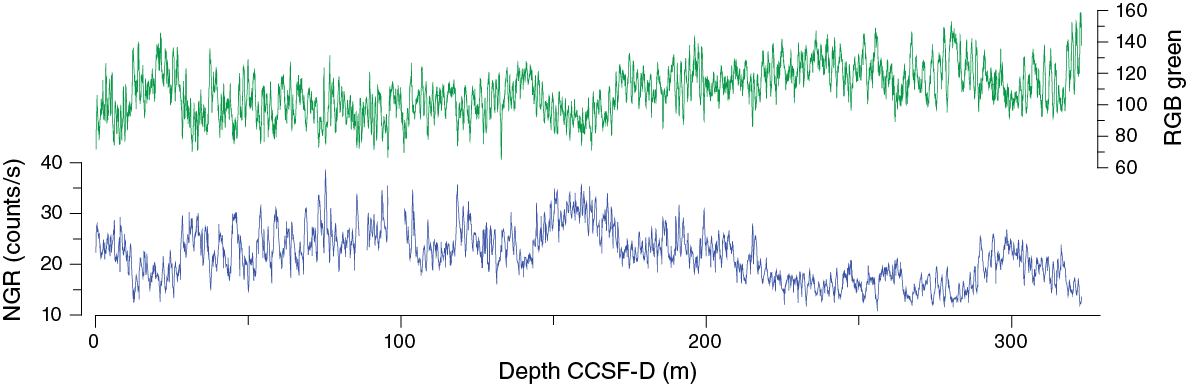
Figure F29. Composite spliced records of RGB green values and NGR, Site U1479.
Table T13. Splice interval table, Site U1479. Download table in .csv format.
Geochemistry
The chemical composition of headspace gases, interstitial water, and bulk sediments were investigated at Site U1479. Samples for shipboard analyses were taken from Hole U1479B. Downhole profiles of interstitial water chemistry largely reflect postdepositional microbially mediated reactions driven by the relatively modest deposition of organic carbon. Sedimentary carbonate contents range from 51 to 91 wt% with an average of 67 wt%.
Interstitial water was squeezed from 5 cm whole rounds at ~9.5 m resolution from 0 to 205.15 m CSF-A and 28.5 m resolution from 205.15 to 290.65 m CSF-A in Hole U1479B. A total of 25 samples were collected from Hole U1479B for shipboard analysis of interstitial water chemistry. Bulk sediment in Hole U1479B was measured for total organic carbon (TOC) and total inorganic carbon (TIC) content at variable resolution.
Sedimentary hydrocarbon gases
Headspace gas samples were collected from each core in Hole U1479B. A total of 33 samples were measured. In all samples, CH4 was the dominant hydrocarbon. CH4 concentrations varied between 2 and 50 ppm with distinct peaks at 100.7 and 281.2 m CSF-A. The two peaks are interrupted by background level concentrations between 205 and 243 m CSF-A (Figure F30).
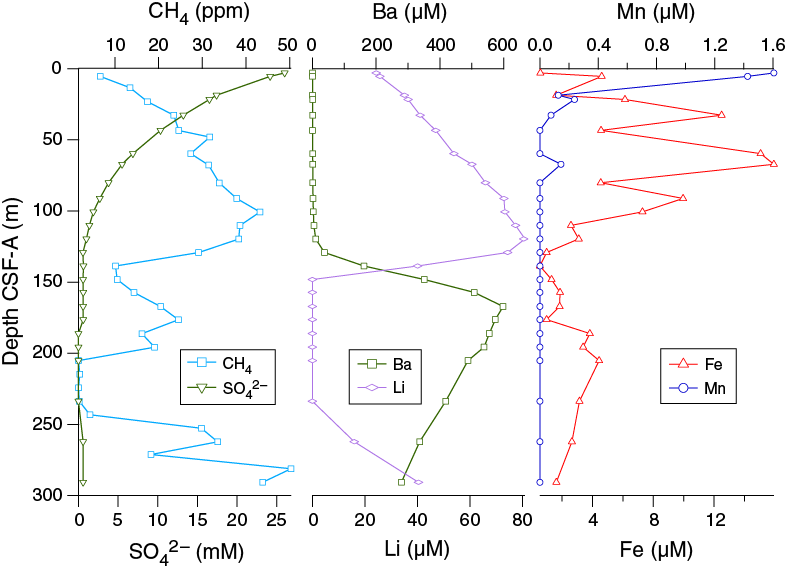
Figure F30. Concentration profiles, Hole U1479B.
Interstitial water chemistry
Salinity, chloride, sodium, magnesium, and potassium
Salinity, chloride, magnesium, and potassium all decrease downhole, whereas sodium is relatively constant at 471 ± 5 mM (Figure F31). Chloride concentrations are ~557 mM in the upper 32.65 m CSF-A, decrease downhole to a minimum of 538 mM at 205.15 m CSF-A, and then increase to 544 mM in the deepest sample at 290.65 m CSF-A. Magnesium concentrations decrease downhole from a maximum of 51.3 mM in the uppermost sample to a minimum of 30.1 mM in the deepest sample. Potassium concentrations are relatively constant at ~11 mM in the upper 43.37 m CSF-A but decrease downhole to a minimum of 8.7 mM at the bottom of Hole U1479B.
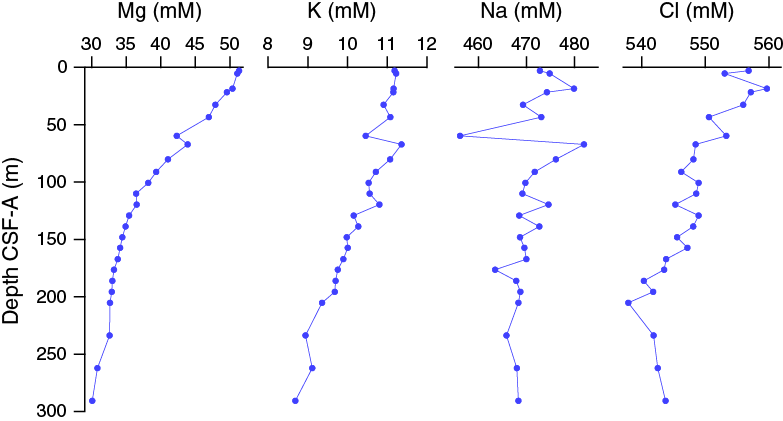
Figure F31. Dissolved magnesium, potassium, sodium, and chloride profiles, Hole U1479B.
Alkalinity, phosphate, and pH
Alkalinity in the uppermost sample (361-U1479B-1H-2, 145–150 cm) is 6.1 mM and increases downhole to 21.4 mM at 80.15 m CSF-A. Alkalinity is stable between 80.15 and 233.65 m CSF-A and then decreases to 18.5 mM at the bottom of the hole (Figure F32). Phosphate concentrations increase from 15.2 to 32.0 µM in the upper 32.65 m CSF-A and then decrease downhole to a minimum of 5.1 µM at the bottom of the hole, with a slight reversal around 150 m CSF-A. pH generally decreases downhole from a maximum of 7.27 in the uppermost sample to a minimum of 6.75 in the deepest sample.
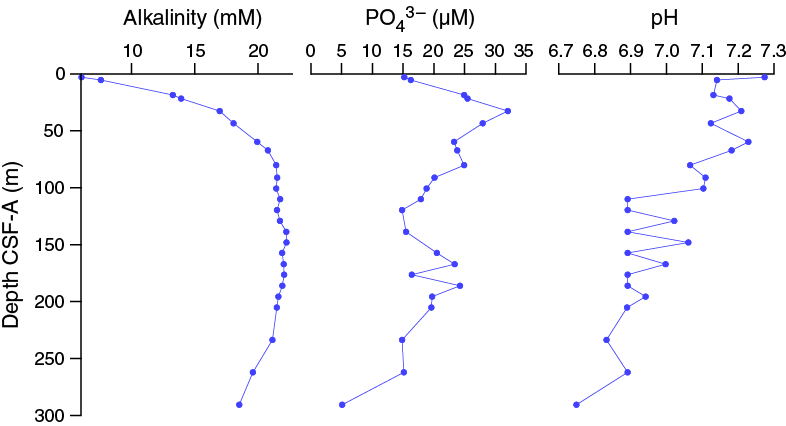
Figure F32. Alkalinity, dissolved phosphate, and pH profiles, Hole U1479B.
Iron and manganese
Dissolved iron concentrations are highly variable in the upper ~100 m CSF-A, ranging from 0.58 µM in the uppermost sample at 2.95 m CSF-A to 16 µM at 67.16 m CSF-A (Figures F30, F33). Below 100.65 m CSF-A, iron concentrations are consistently below 5 µM. Dissolved manganese concentrations are very low at this site, with a value of 1.6 µM in the uppermost sample at 2.95 m CSF-A and decreasing to below detection limit by 43.37 m CSF-A. The low and decreasing dissolved manganese concentrations with depth likely reflect its combination with HCO3– and formation of manganese carbonate minerals (Calvert and Pedersen, 1994). The low dissolved iron concentrations below ~100 m CSF-A most likely reflect the formation of iron sulfides. Abundant black sulfide streaks are apparent on the surface of the cores throughout, likely as a result of accelerated sulfate reduction within the lining of burrows from bioturbating organisms. The distinctive odor of hydrogen sulfide was observed during sampling.
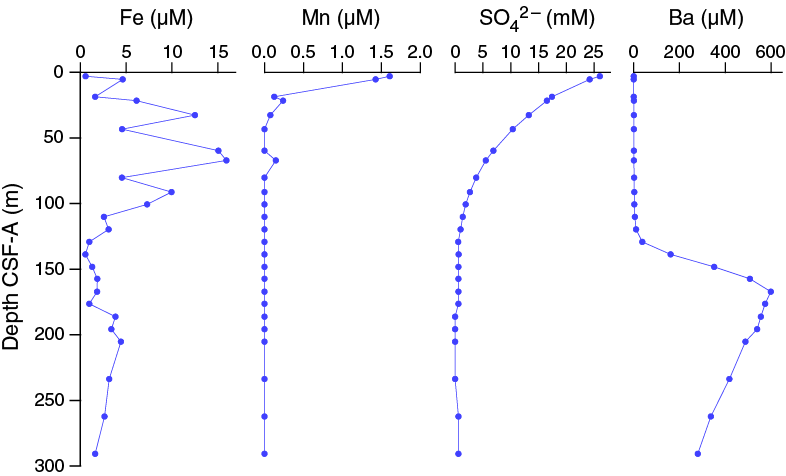
Figure F33. Dissolved iron, manganese, sulfate, and barium profiles, Hole U1479B.
Sulfate and barium
Sulfate concentrations are 26.0 mM in the first sample (361-U1479B-1H-2, 145–150 cm), near average seawater concentration, and decrease downhole to near-zero values by 129.15 m CSF-A (Figures F30, F33). This is likely the result of microbial sulfate reduction, in which sulfate is used as an electron receptor in the anaerobic oxidation of organic matter:
53 SO42– + (CH2O)106(NH3)16(H3PO4) → 39 CO2 + 67 HCO3– + 16 NH4+ + 53 HS– + 39 H2O + HPO42–.
In sediment where sulfate reduction is rapid and intense, barite (BaSO4) will dissolve. At Site U1479, barium concentrations are low in the uppermost ~120 m CSF-A and then increase sharply to a maximum of 598 μM at 167.13 m CSF-A (Figure F33). Below this, barium decreases downhole to 279 μM at 290.65 m CSF-A. The rise in barium concentrations coincides with the depth at which sulfate drops to zero, which is consistent with the mechanism described above.
Calcium and strontium
The dissolved calcium profile at Site U1479 is similar to that observed at the other sites. Dissolved calcium decreases from ~11 mM in the uppermost sediment, which is near average seawater values, to a minimum concentration of 4.1 mM at 59.65 m CSF-A and then increases downhole to ~9 mM in the lowermost ~60 m of Hole U1479B (Figure F34). Removal of dissolved calcium is likely due to the precipitation of calcium carbonate in the upper 60 m of Hole U1479B as a result of the high alkalinity. Below ~60 m CSF-A, the increase in dissolved calcium concentrations is likely caused by the dissolution of carbonates, although there is little measured change in calcium carbonate contents below this depth. Strontium concentrations increase with depth from 96 μM (2.95 m CSF-A) to a maximum concentration of 769 μM at the bottom of the hole.

Figure F34. Dissolved calcium and strontium profiles, Hole U1479B.
Silicon, lithium, and boron
Dissolved silicon concentrations in interstitial water generally increase downhole, with a minimum concentration of 680 μM at 2.95 m CSF-A. Dissolved silicon concentrations decrease in the interval between 129.15 and 148.15 m CSF-A and then increase downhole to a maximum of ~1110 μM in the deepest sample at 290.65 m CSF-A (Figure F35).
Lithium concentrations increase downhole in the upper ~120 m CSF-A, from 24 μM at 2.95 m CSF-A to 81 μM at 119.65 m CSF-A. Lithium concentrations drop to below detection limits in the 148.15–233.65 m CSF-A interval and then increase to 40 μM at the bottom of Hole U1479B (Figure F35). Lithium concentrations begin to decrease at the same depth at which barium concentrations begin to rise, and sulfate drops to zero, suggesting that lithium may be taken up by clay minerals possibly associated with sulfide formation (Figures F30, F33, F35).
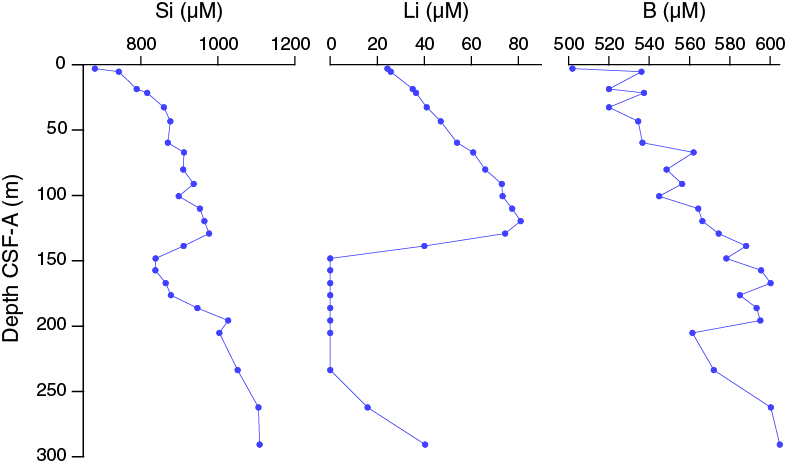
Figure F35. Dissolved silicon, lithium, and boron profiles, Hole U1479B.
Boron concentrations at Site U1479 are somewhat elevated above average seawater values and increase downhole from a minimum of 502 μM in the uppermost sample to a maximum of 605 in the deepest sample (Figure F35).
Bulk sediment geochemistry
Total organic carbon
Total organic carbon contents vary from ~0.15 to 1.93 wt% with an average of 0.62 wt% for all samples measured (Figure F36). A slightly higher TOC content occurs toward the top of the hole.
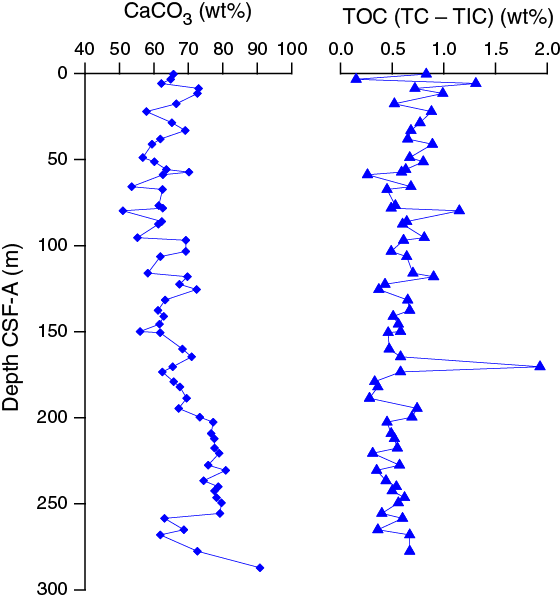
Figure F36. Calcium carbonate and TOC, Hole U1479B.
Calcium carbonate
Calcium carbonate contents range between 51 and 91 wt% with an average of ~67 wt% in Hole U1479B (Figure F36). The upper ~120 m CSF-A is characterized by what appears to be cyclic variability with amplitudes and periods of 10 wt% and 20 m, respectively. A longer term trend is also apparent, with carbonate contents decreasing downhole from ~0 to 80 m CSF-A and increasing from ~80 m CSF-A to the bottom of the hole. There is one exception to this trend; the interval from 258.5 to 277.5 m CSF-A is characterized by low CaCO3 contents compared to the other data below ~200 m CSF-A.
Redox processes
Site U1479 is dominated by moderate microbial diagenesis. Although sulfate reduction goes to completion, it proceeds at a relatively slow rate such that sulfate is completely consumed around 130 m CSF-A (Figure F30). Methane concentrations are also relatively moderate, although above background concentrations, throughout much of the section with co-occurrence of methane and sulfate in the upper 130 m CSF-A. This is unusual but not unknown in open ocean sediment (D’Hondt et al., 2002) and suggests that sulfate and CO2 reducers are relying on different substrates in the sediment column. The decrease in methane mid-column is tracked by an abrupt decrease in interstitial iron and lithium concentrations and mirrored by an increase in dissolved barium. For each of these constituents, this transition is more abrupt than the smooth concave-downward sulfate profile, suggestive of some depositional change between 100 and 150 m CSF-A.
Age model
A ~300 m long section of late Miocene to Late Pleistocene sediments was recovered from Hole U1479B. The age model is based on the biochronologies of calcareous nannofossils, planktonic foraminifers, and diatoms and magnetostratigraphy. Biostratigraphic sampling in Hole U1479B included 46 samples examined for diatoms, 134 samples examined for calcareous nannofossils, and 128 samples examined for foraminifers. Magnetostratigraphy is based on the assignment of phases of normal and reversed polarity to magnetic chrons from the spliced record of Site U1479. We report biostratigraphic events in Tables T4, T5, and T6, and magnetostratigraphic events are shown in Table T11. Major age-depth trends are illustrated in Figure F37.
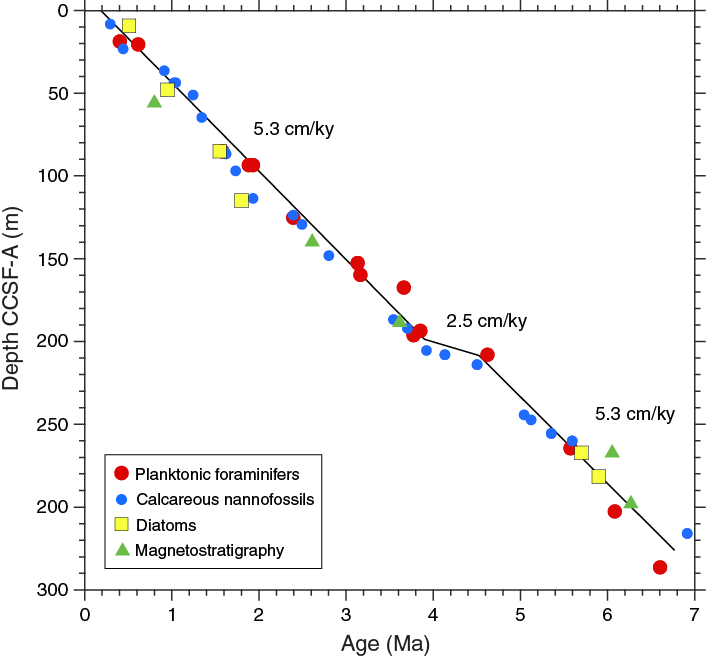
Figure F37. Age-depth relationships based on planktonic foraminifers, calcareous nannofossils, diatoms, and magnetostratigraphy, Hole U1479B.
Most chronostratigraphic markers agree throughout the hole with the exception of the Brunhes/Matuyama Chron boundary and the base of the Gilbert Chron (C3r). The core top in Hole U1479B is estimated to be ~200 ka by linear extrapolation of biostratigraphic datums. However, this core top age might not be representative of the other holes at Site U1479 because Hole U1479B did not show the characteristic brown surface sediment observed in other mudline samples recovered in Holes U1479H and U1479I. Indeed, stratigraphic correlation with Holes U1479H and U1479I places the core top of Hole U1479B at ~3.25 m CCSF-A, which is consistent with nearly linear sedimentation rates between a core top of modern age and ~205 m CCSF-A. We infer a sedimentation rate of 5.3 cm/ky in the upper 185 m CSF-A of Hole U1479B (205 m CCSF-A). An interval of reduced accumulation rates (~2.5 cm/ky on the CCSF-A scale) is supported by both calcareous nannofossil and planktonic foraminifer datums between 185 and 195 m CSF-A (205–215 m CCSF-A) corresponding to 3.95 to 4.5 Ma. Below this, sedimentation rates of 5.3 cm/ky are supported by all biostratigraphic datums and the identification of Chron C3An.1n.
Linear extrapolation of this sedimentation rate to the bottom of Hole U1479B suggests a bottom age of 7 Ma at 345 m CCSF-A (301 m CSF-A). Hole U1479B terminates in a slumped sequence in Core 361-U1479B-32H (291.2–300.7 m CSF-A) that contains sediment of late Miocene age. Sampling of fold axes (Samples 32H-4, 70–72 cm [296.42 m CSF-A], and 32H-5, 5–7 cm [297.27 m CSF-A]) and the core catcher for Core 32H (301.03 m CSF-A) reveals datums with ages of >6.14, <6.6, and <6.9 Ma, respectively.
References
Arhan, M., Mercier, H., and Park, Y.-H., 2003. On the deep water circulation of the eastern South Atlantic Ocean. Deep-Sea Research, Part I, 50(7):889–916. http://dx.doi.org/10.1016/S0967-0637(03)00072-4
Beal, L.M., De Ruijter, W.P.M., Biastoch, A., Zahn, R., and SCOR/WCRP/IAPSO Working Group 136, 2011. On the role of the Agulhas system in ocean circulation and climate. Nature, 472(7344):429–436. http://dx.doi.org/10.1038/nature09983
Boebel, O., Lutjeharms, J., Schmid, C., Zenk, W., Rossby, T., and Barron, C., 2003. The Cape Cauldron: a regime of turbulent inter-ocean exchange. Deep Sea Research, Part II: Topical Studies in Oceanography, 50(1):57–86. http://dx.doi.org/10.1016/S0967-0645(02)00379-X
Caley, T., Giraudeau, J., Malaizé, B., Rossignol, L., and Pierre, C., 2012. Agulhas leakage as a key process in the modes of Quaternary climate changes. Proceedings of the National Academy of Sciences of the United States of America, 109(18):6835–6839. http://dx.doi.org/10.1073/pnas.1115545109
Caley, T., Kim, J.-H., Malaizé, B., Giraudeau, J., Laepple, T., Caillon, N., Charlier, K., Rebaubier, H., Rossingol, L., Castañeda, I.S., Schouten, S., and Sinninghe Damsté, J.S., 2011. High-latitude obliquity forcing drives the Agulhas leakage. Climate of the Past Discussions, 7(3):2193–2215. http://dx.doi.org/10.5194/cpd-7-2193-2011
Caley, T., Peeters, F.J.C., Biastoch, A., Rossignol, L., van Sebille, E., Durgadoo, J., Malaizé, B., Giraudeau, J., Arthur, K., and Zahn, R., 2014. Quantitative estimate of the paleo-Agulhas leakage. Geophysical Research Letters, 41(4):1238–1246. http://dx.doi.org/10.1002/2014GL059278
Calvert, S.E., and Pedersen, T.F., 1994. Sedimentary geochemistry of manganese; implications for the environment of formation of manganiferous black shales. Economic Geology, 91(1):36–47. http://dx.doi.org/10.2113/gsecongeo.91.1.36
Canfield, D.E., and Raiswell, R., 1992. Pyrite formation and fossil preservation. In Allison, P.A., and Briggs, D.E.G. (Eds.), Topics in Geobiology (Volume 9): Taphonomy: Releasing the Data from the Fossil Record: New York (Plenum Press), 337–387.
de Ruijter, W.P.M., Biastoch, A., Drijfhout, S.S., Lutjeharms, J.R.E., Matano, R.P., Picheven, T., van Leeuwen, P.J., and Weijer, W., 1999. Indian-Atlantic interocean exchange: dynamics, estimations and impact. Journal of Geophysical Research: Oceans, 104(C9):20885–20910. http://dx.doi.org/10.1029/1998JC900099
D’Hondt, S., Rutherford, S., and Spivack., A.J., 2002. Metabolic activity of subsurface life in deep-sea sediments. Science, 295(5562):2067–2070. http://dx.doi.org/10.1126/science.1064878
Dickson, A.J., Leng, M.J., Maslin, M.A., Sloane, H.J., Green, J., Bendle, J.A., McClymont, E.L., and Pancost, R.D., 2010. Atlantic overturning circulation and Agulhas leakage influences on southeast Atlantic upper ocean hydrography during marine isotope Stage 11. Paleoceanography, 25(3):PA3208. http://dx.doi.org/10.1029/2009PA001830
Doglioli, A.M., Veneziani, M., Blanke, B., Speich, S., and Griffa, A., 2006. A Lagrangian analysis of the Indian-Atlantic interocean exchange in a regional model. Geophysical Research Letters, 33(14):L14611. http://dx.doi.org/10.1029/2006GL026498
Dyez, K.A., Zahn, R., and Hall, I.R., 2014. Multicentennial Agulhas leakage variability and links to North Atlantic climate during the past 80,000 years. Paleoceanography, 29(12):1238–1248. http://dx.doi.org/10.1002/2014PA002698
Gordon, A.L., 2003. Oceanography: the brawniest retroflection. Nature, 421(6926):904–905. http://dx.doi.org/10.1038/421904a
Gordon, A.L., Lutjeharms, J.R.E., and Gründlingh, M.L., 1987. Stratification and circulation at the Agulhas retroflection. Deep-Sea Research, Part A. Oceanographic Research Papers, 34(4):565–599. http://dx.doi.org/10.1016/0198-0149(87)90006-9
Gradstein, F.M., Ogg, J.G., Schmitz, M.D., and Ogg, G.M. (Eds.), 2012. The Geological Time Scale 2012: Amsterdam (Elsevier).
Hall, I.R., Hemming, S.R., LeVay, L.J., Barker, S., Berke, M.A., Brentegani, L., Caley, T., Cartagena-Sierra, A., Charles, C.D., Coenen, J.J., Crespin, J.G., Franzese, A.M., Gruetzner, J., Han, X., Hines, S.K.V., Jimenez Espejo, F.J., Just, J., Koutsodendris, A., Kubota, K., Lathika, N., Norris, R.D., Periera dos Santos, T., Robinson, R., Rolinson, J.M., Simon, M.H., Tangunan, D., van der Lubbe, J.J.L., Yamane, M., and Zhang, H., 2017. Expedition 363 summary. In Hall, I.R., Hemming, S.R., LeVay, L.J., and the Expedition 361 Scientists, South African Climates (Agulhas LGM Density Profile). Proceedings of the International Ocean Discovery Program, 361: College Station, TX (International Ocean Discovery Program). http://dx.doi.org/10.14379/iodp.proc.361.101.2017
Lourens, L., Hilgen, F., Shackleton, N.J., Laskar, J., and Wilson, D., 2004. The Neogene period. In Gradstein, F.M., Ogg, J.G., and Smith, A. (Eds.), A Geologic Time Scale 2004: Cambridge, United Kingdom (Cambridge University Press), 409–440. http://dx.doi.org/10.1017/CBO9780511536045.022
Lutjeharms, J.R.E., 2006. The Agulhas Current: Berlin (Springer-Verlag). http://dx.doi.org/10.1007/3-540-37212-1
Lutjeharms, J.R.E., Boebel, O., and Rossby, T., 1997. KAPEX: an international experiment to study deep water movement around southern Africa. South African Journal of Science, 93:377–381. http://hdl.handle.net/10520/AJA00382353_100
Marino, G., Zahn, R., Ziegler, M., Purcell, C., Knorr, G., Hall, I.R., Ziveri, P., and Elderfield, H., 2013. Agulhas salt-leakage oscillations during abrupt climate changes of the Late Pleistocene. Paleoceanography, 28(3):599–606. http://dx.doi.org/10.1002/palo.20038
Martin, A.K., 1981. The influence of the Agulhas Current on the physiographic development of the northernmost Natal Valley (S.W. Indian Ocean). Marine Geology, 39(3–4):259–276. http://dx.doi.org/10.1016/0025-3227(81)90075-X
Peeters, F.J.C., Acheson, R., Brummer, G.-J.A., de Ruijter, W.P.M., Schneider, R.R., Ganssen, G.M., Ufkes, E., and Kroon, D., 2004. Vigorous exchange between the Indian and Atlantic Oceans at the end of the past five glacial periods. Nature, 430(7000):661–665. http://dx.doi.org/10.1038/nature02785
Petrick, B.F., McClymont, E.L., Marret, F., and van der Meer, M.T.J., 2015. Changing surface water conditions for the last 500 ka in the southeast Atlantic: implications for variable influences of Agulhas leakage and Benguela upwelling. Paleoceanography, 30(9):1153–1167. http://dx.doi.org/10.1002/2015PA002787
Preu, B., Spieß, V., Schwenk, T., and Schneider, R., 2011. Evidence for current-controlled sedimentation along the southern Mozambique continental margin since early Miocene times. Geo-Marine Letters, 31(5–6):427–435. http://dx.doi.org/10.1007/s00367-011-0238-y
Quartly, G.D., and Srokosz, M.A., 1993. Seasonal variations in the region of the Agulhas Retroflection: studies with Geosat and FRAM. Journal of Physical Oceanography, 23:2107–2124. http://dx.doi.org/10.1175/1520-0485(1993)023<2107:SVITRO>2.0.CO;2
Rau, A., Rogers, J., and Chen, M.-T., 2006. Late Quaternary palaeoceanographic record in giant piston cores off South Africa, possibly including evidence of neotectonism. Quaternary International, 148(1):65–77. http://dx.doi.org/10.1016/j.quaint.2005.11.007
Rau, A.J., Rogers, J., Lutjeharms, J.R.E., Giraudeau, J., Lee-Thorp, J.A., Chen, M.-T., and Waelbroeck, C., 2002. A 450-kyr record of hydrological conditions on the western Agulhas Bank slope, south of Africa. Marine Geology, 180(1–4):183–201. http://dx.doi.org/10.1016/S0025-3227(01)00213-4
Reason, C.J.C., Landman, W., and Tennant, W., 2006. Seasonal to decadal prediction of southern African climate and its links with variability of the Atlantic Ocean. Bulletin of the American Meteorological Society, 87(7):941–955. http://dx.doi.org/10.1175/BAMS-87-7-941
Richardson, P.L., 2007. Agulhas leakage into the Atlantic estimated with subsurface floats and surface drifters. Deep Sea Research, Part I: Oceanographic Research Papers, 54(8):1361–1389. http://dx.doi.org/10.1016/j.dsr.2007.04.010
Sagnotti, L., 2013. Demagnetization Analysis in Excel (DAIE). An open source workbook in Excel for viewing and analyzing demagnetization data from paleomagnetic discrete samples and U-channels. Annals of Geophysics, 56(1). http://dx.doi.org/10.4401/ag-6282
Schoonen, M.A.A., 2004. Mechanisms of sedimentary pyrite formation. In Amend, J.P., Edwards, K.J., and Lyons, T.W. (Eds.), Sulfur Biogeochemistry: Past and Present. Special Paper - Geological Society of America, 379:117–134. http://dx.doi.org/10.1130/0-8137-2379-5.117
Schouten, M.W., de Ruijter, W.P.M., van Leeuwen, P.J., and Lutjeharms, J.R.E., 2000. Translation, decay and splitting of Agulhas rings in the southeastern Atlantic Ocean. Journal of Geophysical Research: Oceans, 105(C9):21,913–21,925. http://dx.doi.org/10.1029/1999JC000046
The Shipboard Scientific Party, 1978. Cape Basin continental rise—Sites 360 and 361. In Bolli, H.M., Ryan, W.B.F., et al., Initial Reports of the Deep Sea Drilling Project, 40: Washington, DC (U.S. Government Printing Office), 29–182. http://dx.doi.org/10.2973/dsdp.proc.40.102.1978
Valentine, H.R., Lutjeharms, J.R.E., and Brundrit, G.B., 1993. The water masses and volumetry of the southern Agulhas Current region. Deep Sea Research, Part I: Oceanographic Research Papers, 40(6):1285–1305. http://dx.doi.org/10.1016/0967-0637(93)90138-S
van Aken, H.M., van Veldhoven, A.K., Veth, C., de Ruijter, W.P.M., van Leeuwen, P.J., Drijfhout, S.S., Whittle, C.P., and Rouault, M., 2003. Observations of a young Agulhas ring, Astrid, during MARE in March 2000. Deep Sea Research, Part II: Topical Studies in Oceanography, 50(1):167–195. http://dx.doi.org/10.1016/S0967-0645(02)00383-1
van Aken, H.M., Ridderinkhof, H., and de Ruijter, W.P.M., 2004. North Atlantic Deep Water in the south-western Indian Ocean. Deep Sea Research Part I: Oceanographic Research Papers, 51(6):755–776. http://dx.doi.org/10.1016/j.dsr.2004.01.008
van Sebille, E., Johns, W.E., and Beal, L.M., 2012. Does the vorticity flux from Agulhas rings control the zonal pathway of NADW across the South Atlantic? Journal of Geophysical Research: Oceans, 117(C5):C05037. http://dx.doi.org/10.1029/2011JC007684
van Sebille, E., van Leeuwen, P.J., Biastoch, A., and de Ruijter, W.P.M., 2010. Flux comparison of Eulerian and Lagrangian estimates of Agulhas leakage: a case study using a numerical model. Deep Sea Research, Part I: Oceanographic Research Papers, 57(3):319–327. http://dx.doi.org/10.1016/j.dsr.2009.12.006
Whittle, C., Lutjeharms, J.R.E., Duncombe Rae, C.M., and Shillington, F.A., 2008. Interaction of Agulhas filaments with mesoscale turbulence: a case study. South African Journal of Science, 104(3–4):135–139. http://www.scielo.org.za/pdf/sajs/v104n3-4/a1210404.pdf
1 Hall, I.R., Hemming, S.R., LeVay, L.J., Barker, S., Berke, M.A., Brentegani, L., Caley, T., Cartagena-Sierra, A., Charles, C.D., Coenen, J.J., Crespin, J.G., Franzese, A.M., Gruetzner, J., Han, X., Hines, S.K.V., Jimenez Espejo, F.J., Just, J., Koutsodendris, A., Kubota, K., Lathika, N., Norris, R.D., Periera dos Santos, T., Robinson, R., Rolinson, J.M., Simon, M.H., Tangunan, D., van der Lubbe, J.J.L., Yamane, M., and Zhang, H., 2017. Site U1479. In Hall, I.R., Hemming, S.R., LeVay, L.J., and the Expedition 361 Scientists, South African Climates (Agulhas LGM Density Profile). Proceedings of the International Ocean Discovery Program, 361: College Station, TX (International Ocean Discovery Program). http://dx.doi.org/10.14379/iodp.proc.361.108.2017
2 Expedition 361 Scientists’ addresses.
This work is distributed under the Creative Commons Attribution 4.0 International (CC BY 4.0) license. 
- F1. Location map of Site U1479 with main surface currents in the southwest Indian Ocean.
- F2. Geomorphologic and oceanographic features around Site U1479.
- F3. Example sea-surface temperature for the Site U1479 area overlaid with geostrophic current vectors.
- F4. Temperature-salinity plot from an apparent dipole vortex in the southeastern Atlantic Ocean.
- F5. Seismic Line GeoB08-236 showing a long transect from the shelf downslope to approximate Site U1479 position.
- F6. Conrad seismic line across Deep Sea Drilling Project (DSDP) Site 360, Cape Basin, during Leg 40.
- F7. Bathymetry and parasound survey tracks, Site U1479.
- F8. Detail interpretation of seismic Line GeoB08-240 across Site U1479.
- F9. Parasound profile along seismic Line GeoB08-240 across Site U1479.
- F10. Core recovery, Holes U1479A–U1479I.
- F11. Lithostratigraphic summary with selected physical properties and geochemical data.
- F12. Representative lithologies per interval, Site U1479.
- F13. Sediment deformations and disturbances, Site U1479.
- F14. Major compositions of sediment determined by smear slide observation, Holes U1479A–U1479C.
- F15. CaCO3 content of discrete samples and biogenic carbonate estimated in smear slides, Hole U1479B.
- F16. Color reflectance, Hole U1479B.
- F17. Comparison of cyclic changes in NGR, L*, a*, and bulk density between 210 and 250 m CSF-A, Hole U1479B.
- F18. SHIL RGB color data, Hole U1479B.
- F19. NGR and magnetic susceptibility, Hole U1479B.
- F20. P-wave velocity and bulk density, Hole U1479B.
- F21. Porosity, grain density, and thermal conductivity, Hole U1479B.
- F22. Biochronology at Site U1479 with the locations of significant planktonic foraminifer, calcareous nannofossil, and diatom events.
- F23. Calcareous nannofossils, Hole U1479B.
- F24. Representative foraminifers, Hole U1479B.
- F25. S-ratio, HIRM, and SIRM measured on discrete samples, Hole U1479B.
- F26. Downhole inclination, corrected declination, and NRM intensity, Site U1479.
- F27. Spliced inclination record, Site U1479.
- F28. RGB green values, Site U1479.
- F29. Composite spliced records of RGB green values and NGR, Site U1479.
- F30. Concentration profiles, Hole U1479B.
- F31. Dissolved magnesium, potassium, sodium, and chloride profiles, Hole U1479B.
- F32. Alkalinity, dissolved phosphate, and pH profiles, Hole U1479B.
- F33. Dissolved iron, manganese, sulfate, and barium profiles, Hole U1479B.
- F34. Dissolved calcium and strontium profiles, Hole U1479B.
- F35. Dissolved silicon, lithium, and boron profiles, Hole U1479B.
- F36. Calcium carbonate and TOC, Hole U1479B.
- F37. Age-depth relationships based on planktonic foraminifers, calcareous nannofossils, diatoms, and magnetostratigraphy, Hole U1479B.
- T1. Site U1479 core summary.
- T2. Overview of shipboard sampling with number of samples taken, Holes U1479A–U1479D.
- T3. Sediment textures, compositions, and lithologic names determined by smear slide analysis, Holes U1479A–U1479C.
- T4. Biostratigraphic planktonic foraminifer datums, Site U1479.
- T5. Biostratigraphic calcareous nannofossil datums, Site U1479.
- T6. Biostratigraphic diatom datums, Site U1479.
- T7. Calcareous nannofossil occurrence, Site U1479.
- T8. Planktonic foraminifer occurrence and abundance based on examination of the >150 µm fraction, Site U1479.
- T9. Diatom and other siliceous microfossil occurrences, Site U1479.
- T10. Analyzed discrete whole-round samples, Hole U1479B.
- T11. Polarity zone boundaries, Site U1479.
- T12. Affine table, Site U1479.
- T13. Splice interval table, Site U1479.