McNeill, L.C., Dugan, B., Petronotis, K.E., and the Expedition 362 Scientists
Proceedings of the International Ocean Discovery Program Volume 362
publications.iodp.org

https://doi.org/10.14379/iodp.proc.362.203.2020
Data report: multiscale visualization of stylolites, deformations in chalk from Subunit IIIB, Site U1480, IODP Expedition 362, Sumatra subduction zone1
Julien Moreau,2, 3 Toms Buls,3 and Nicolas Thibault3
Keywords: International Ocean Discovery Program, JOIDES Resolution, Expedition 362, Sumatra Subduction Zone, Site U1480, chalk, diagenesis, stylolite, deformation bands
MS 362-203: Received 26 June 2019 · Accepted 9 January 2020 · Published 7 April 2020
Abstract
Chalk samples from International Ocean Discovery Program (IODP) Expedition 362 Sumatra subduction zone were analyzed based on core photographs and photomicrographs. Stylolite distribution, micritic cement distribution, volume changes, and their relation with fractures are documented to illustrate diagenesis of the chalk at Site U1480.
Introduction
The physical and chemical properties of chalk make it challenging to study with seismic imaging, sedimentology, diagenesis, or structural analyses. Before drilling International Ocean Discovery Program (IODP) Site U1480 in the Sumatra subduction zone (Figure F1), Expedition 362 scientists expected a couple of hundred meters of chalk at 1 km burial depth. Previously, a “pure” chalk diagenetic sequence was established at 500–1000 m paleoburial depth (Maastrichtian of Denmark; Moreau et al., 2016). This paper would have constituted a follow-up at deeper burial depths. However, chalk at Site U1480 is restricted to 15 relatively thin intervals within clay-dominated Subunit IIIB (1314–1327 meters below seafloor [mbsf]; Figure F2) (McNeill et al., 2017). We analyzed three samples at macroscopic to microscopic scale to illustrate diagenetic features of the sampled chalk intervals.
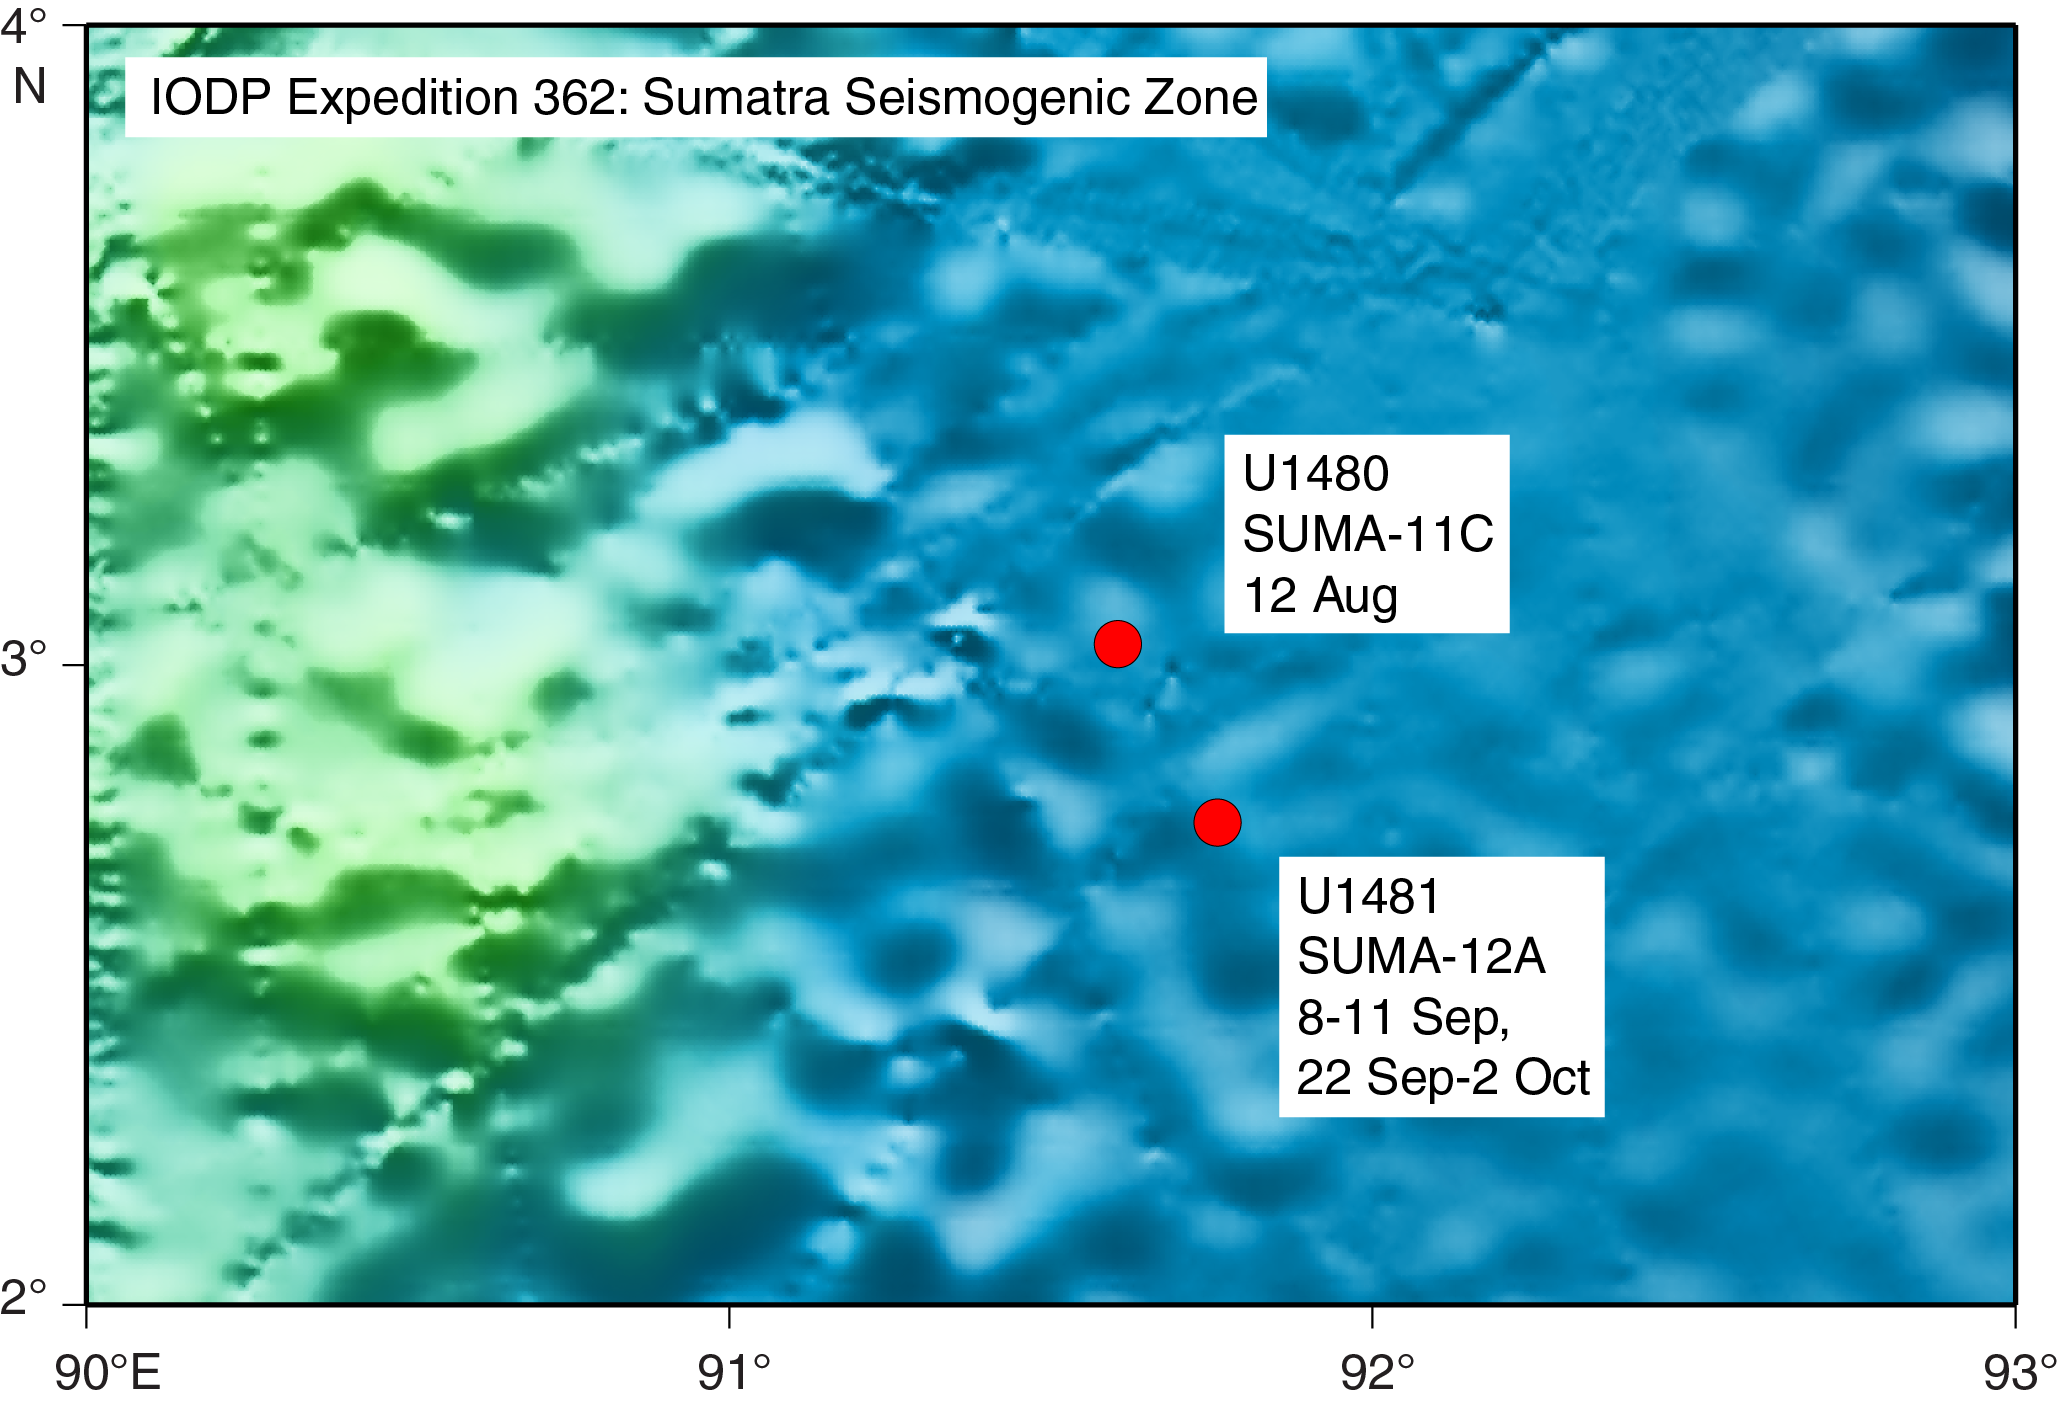
Figure F1. Map of drilling sites from Expedition 362.

Figure F2. Positions of Samples A, B, and C.
Methods and materials
Three thin sections were prepared with blue-dye epoxy to image porosity in Samples 362-U1480G-60R-6, 95–97 cm (Sample A), 60R-6, 106–109 cm (Sample B), and 61R-6, 128–131 (Sample C) (Figure F3). They were analyzed for relations between stylolites, calcareous bioclasts, and fractures. The areas surrounding the samples were analyzed from the core photographs (Figure F4). The cores were drawn to highlight diagenetic features and measure cumulative thickness of the stylolite over 10 cm of core (Figure F5). The initial thickness of the stylolite dissolved interval was estimated using a conservative value of 10 for the compaction ratio (Ricken, 1992). The thin sections were scanned at high resolution (Figure F3). A photomosaic was made from 201 photomicrographs at magnification 25× (10 × 2.5) taken on Sample A, stitched with Hugin Software (Figure F6).
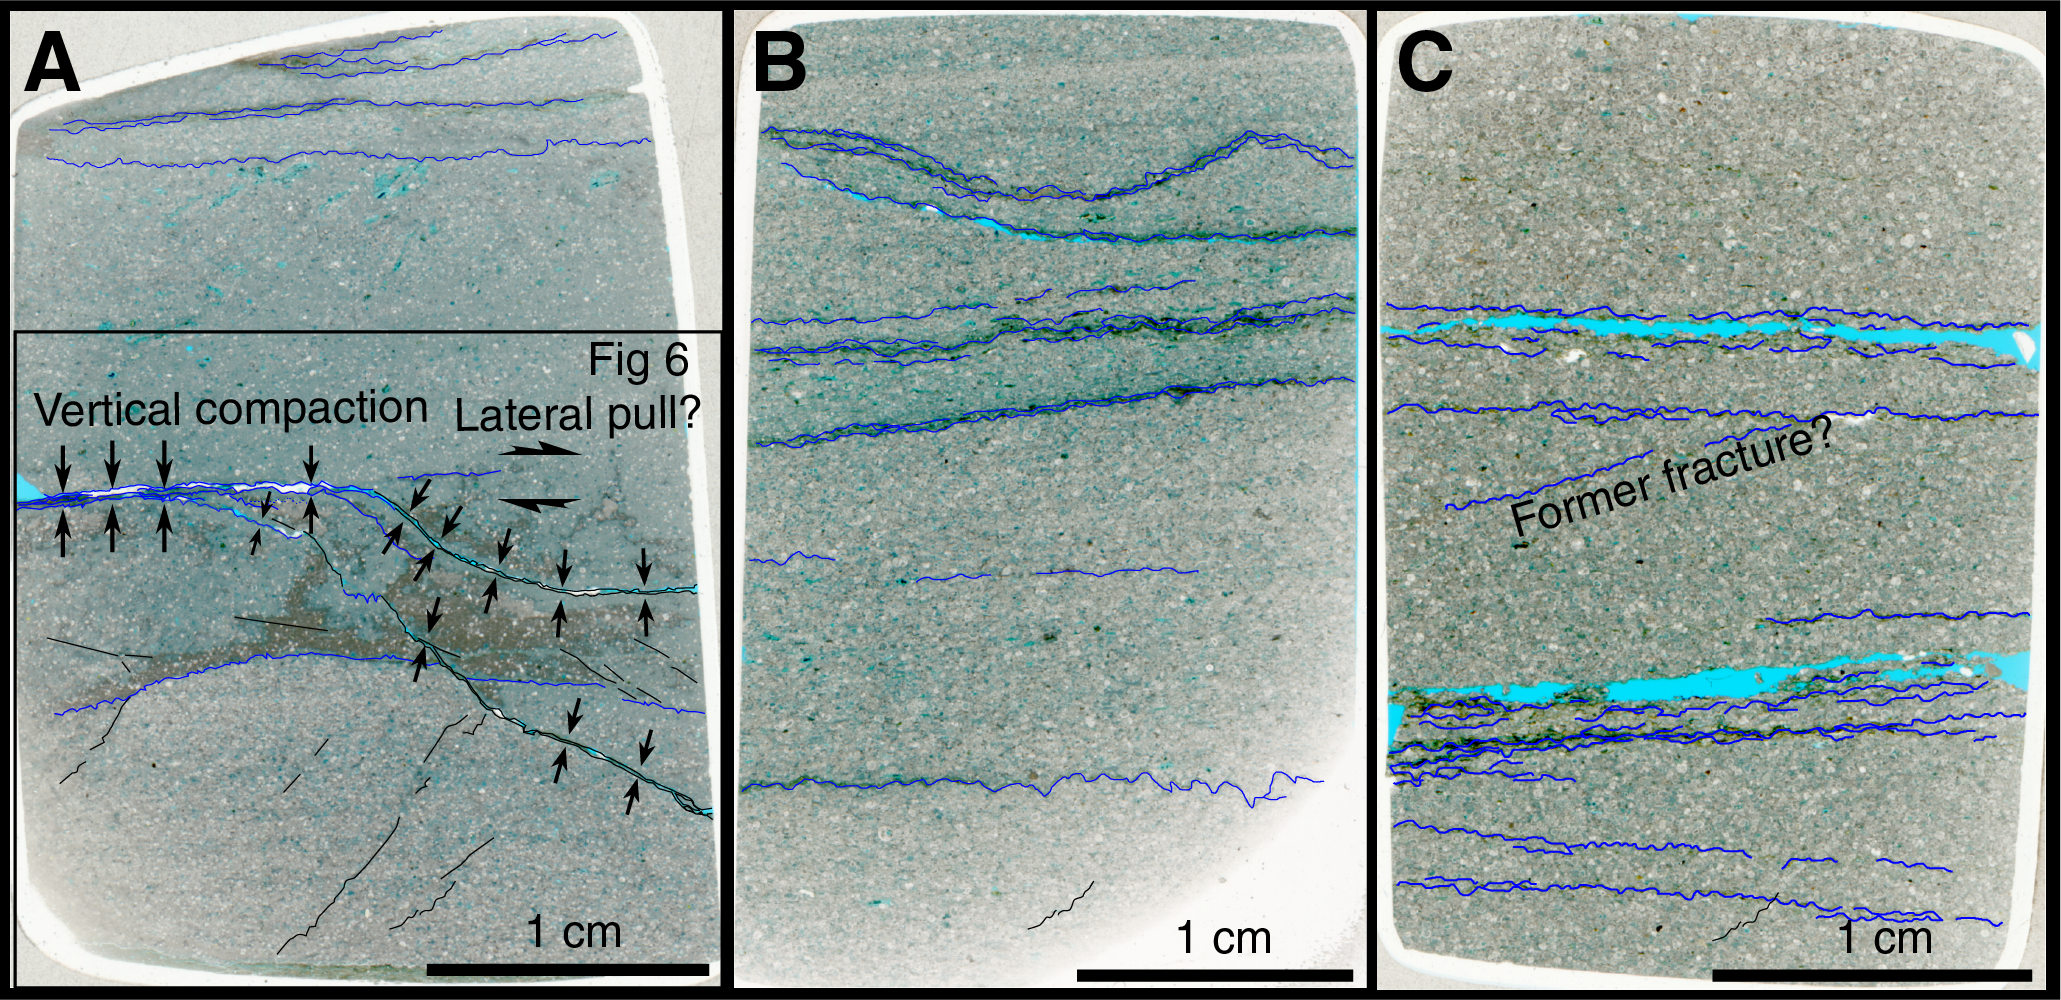
Figure F3. Stylolites, seam dissolution, fractures, and potential stress areas in thin section.
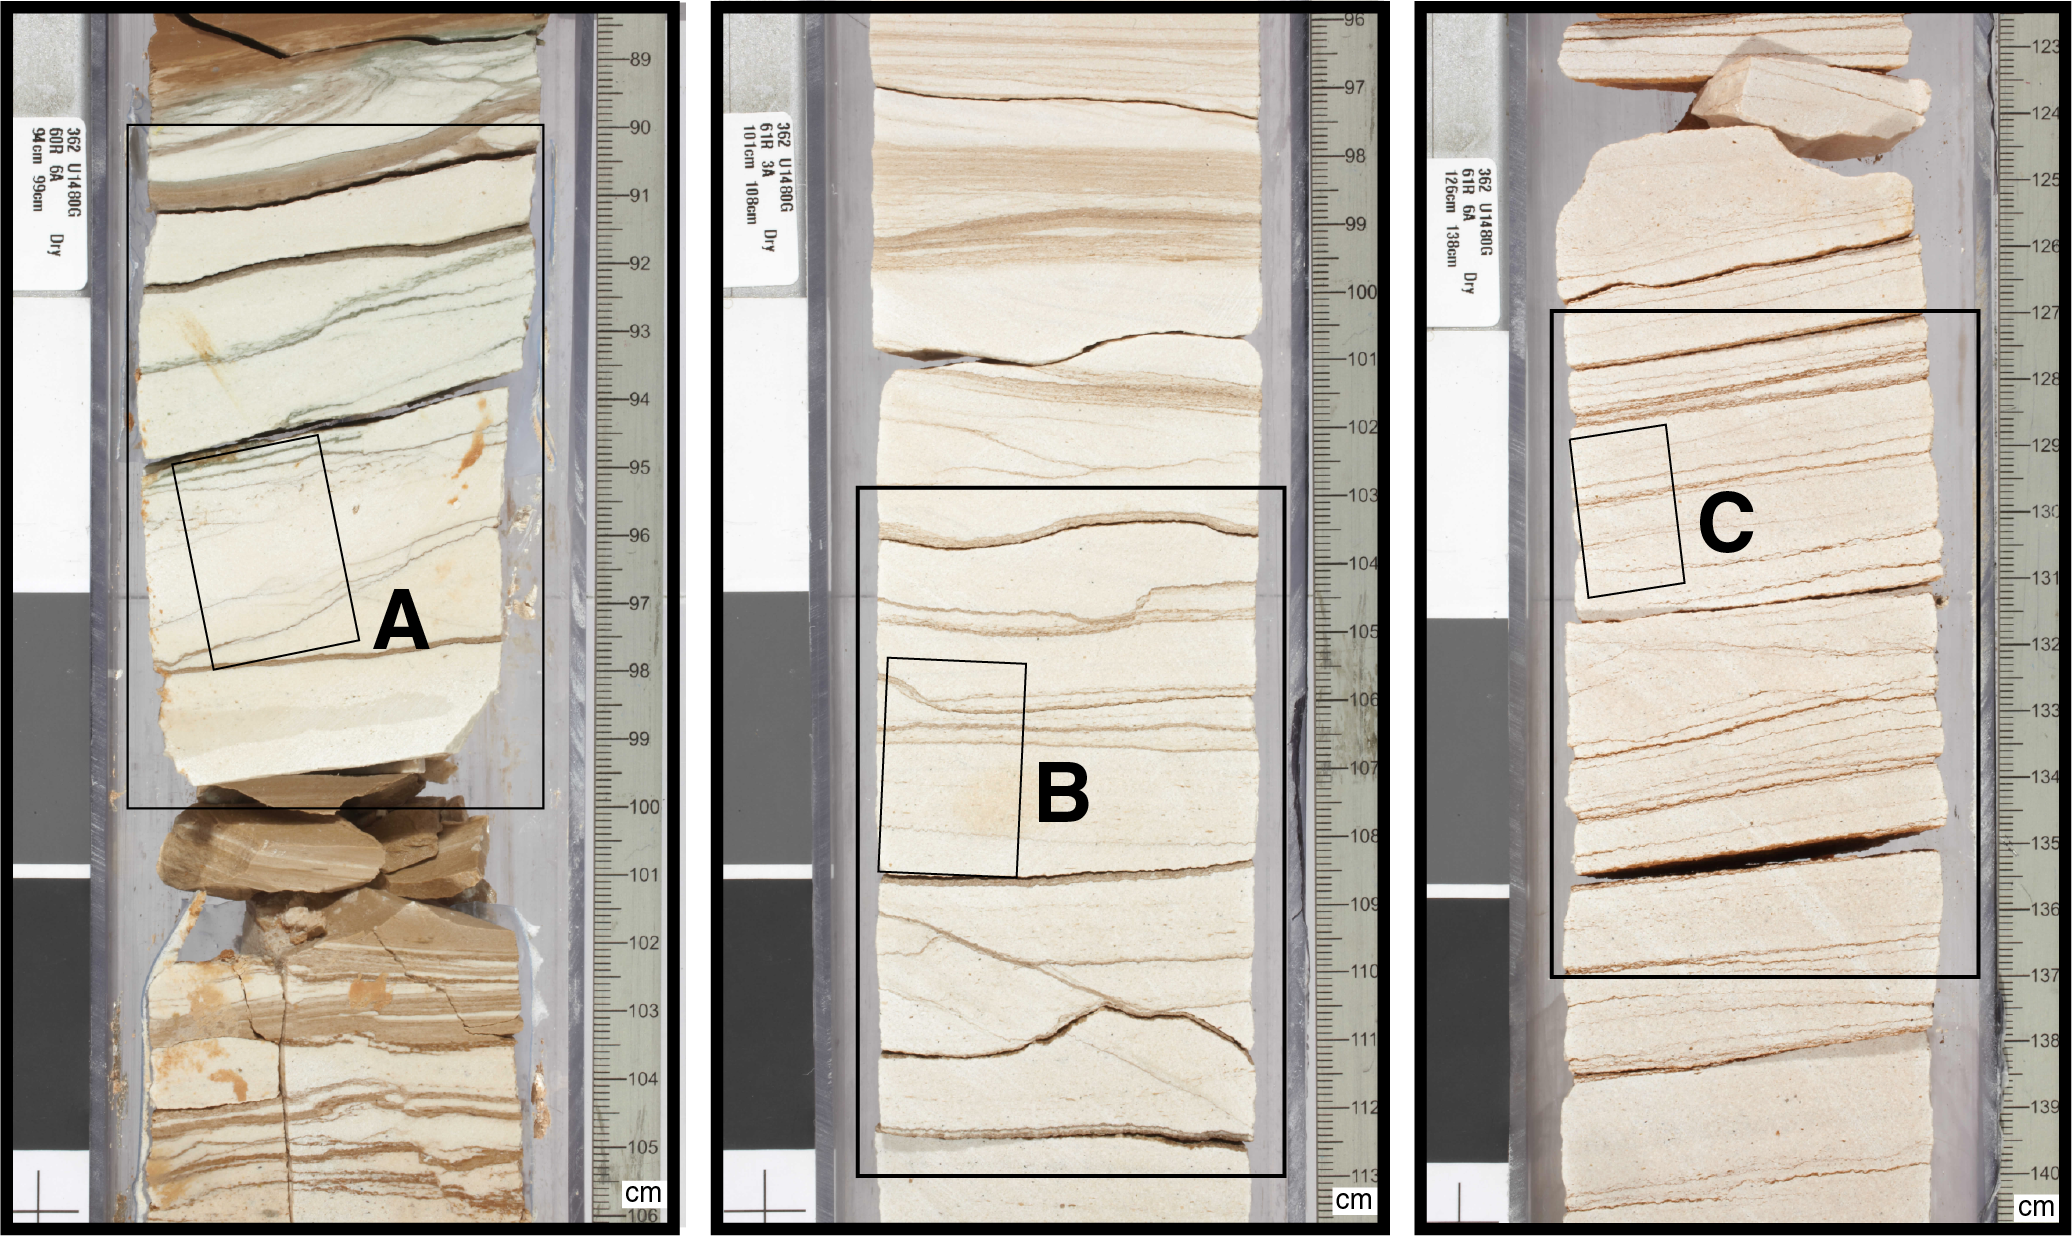
Figure F4. Areas surrounding the samples.
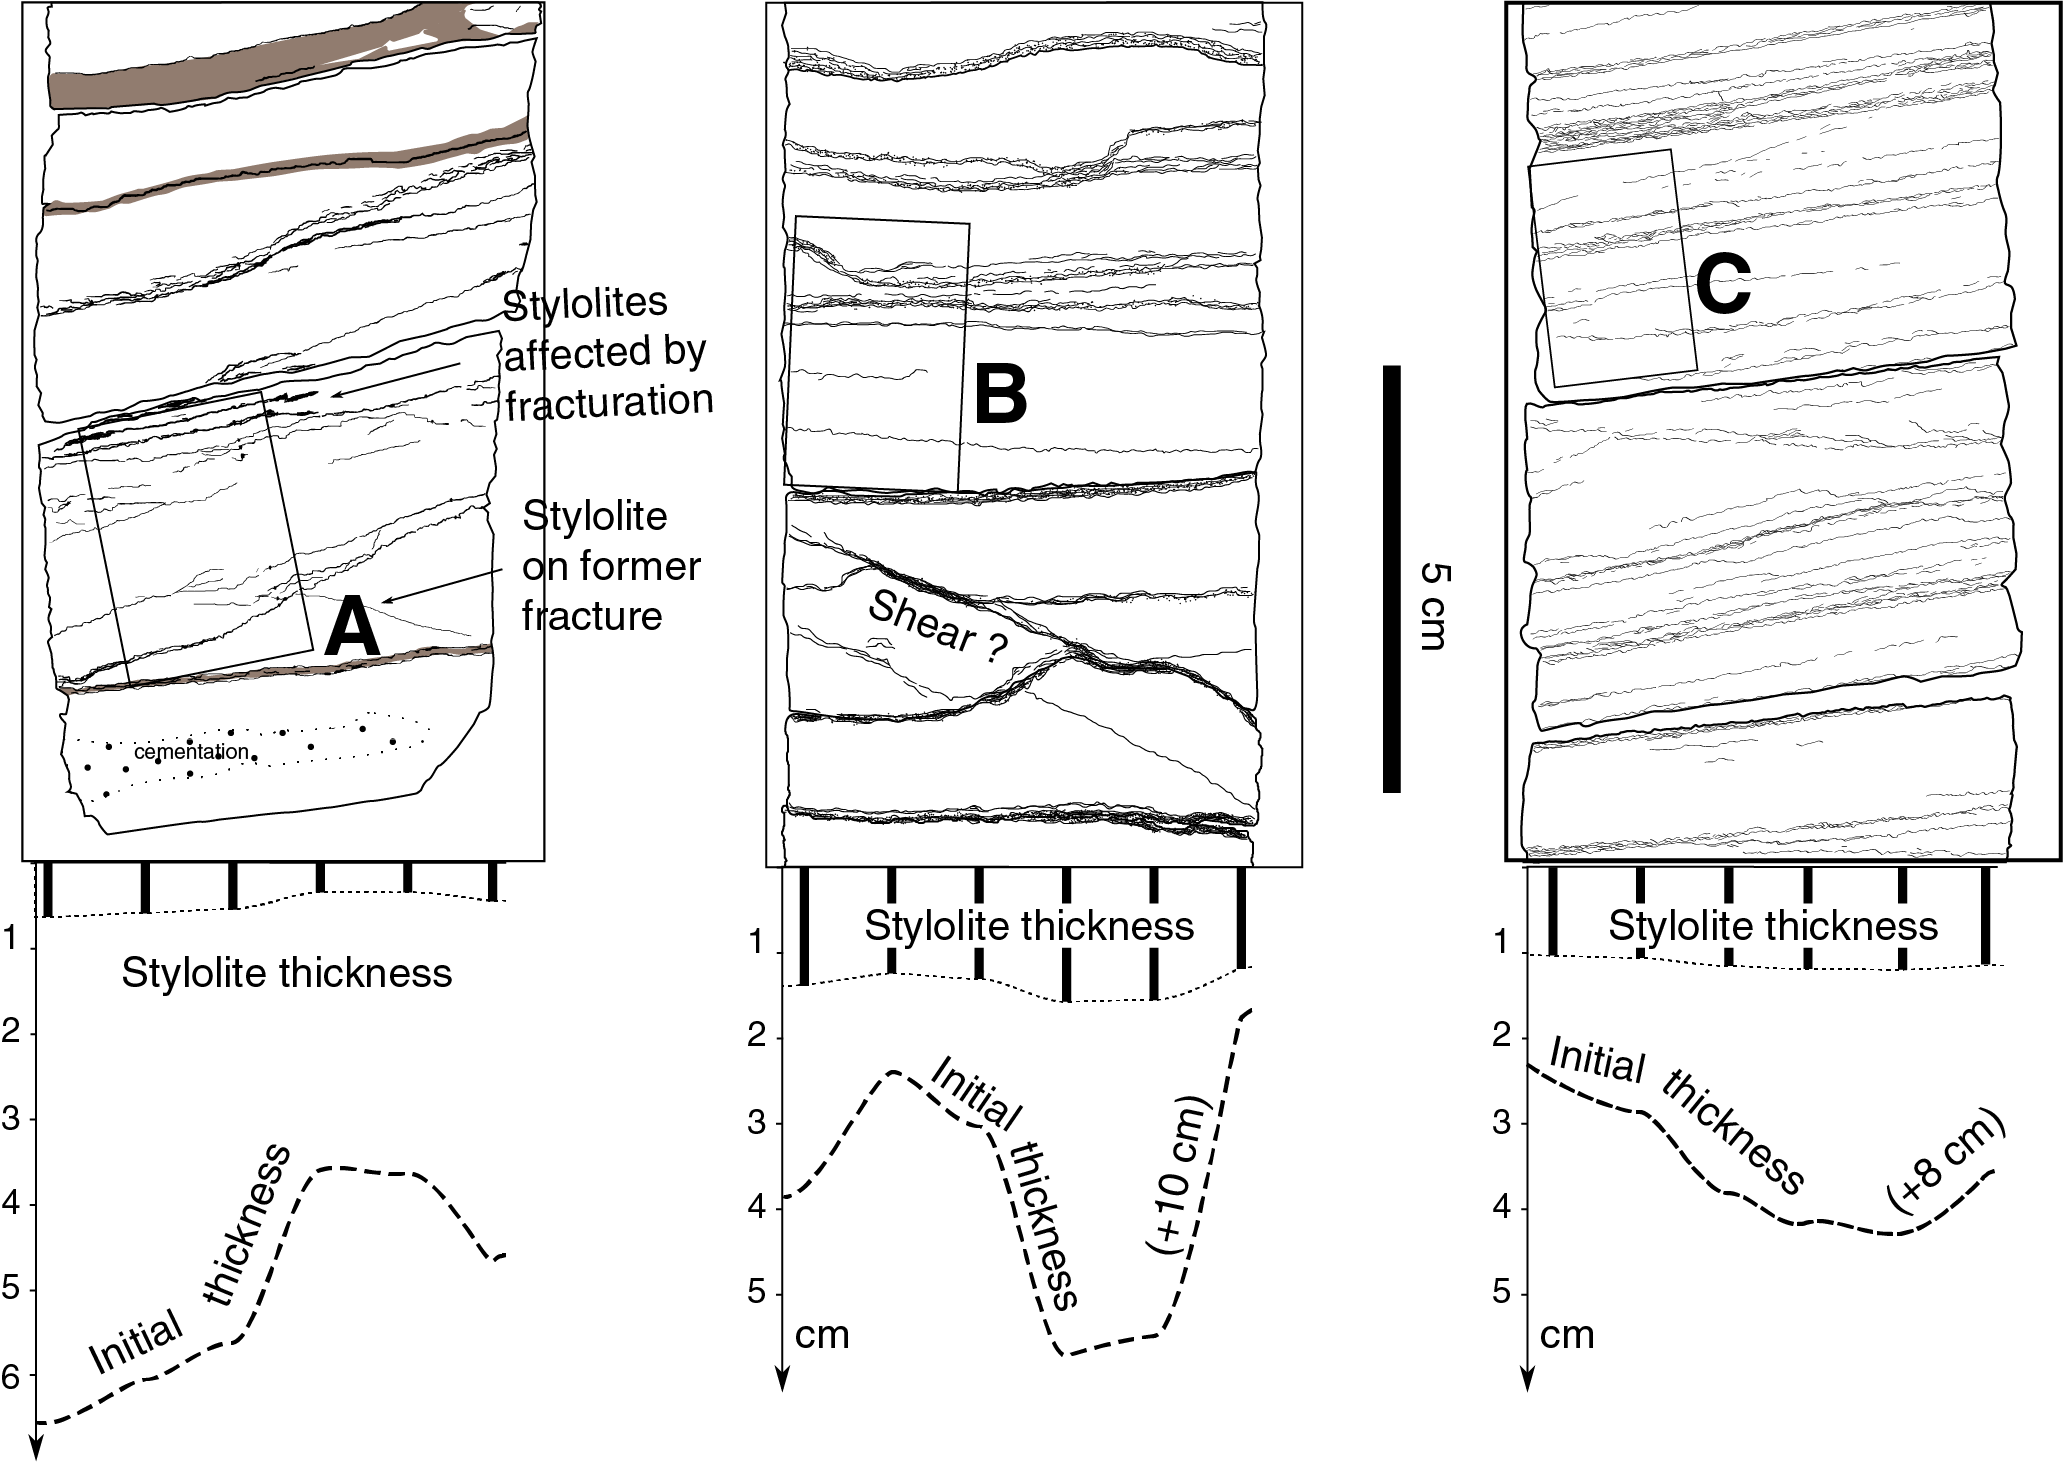
Figure F5. Macroscopic diagenetic features.
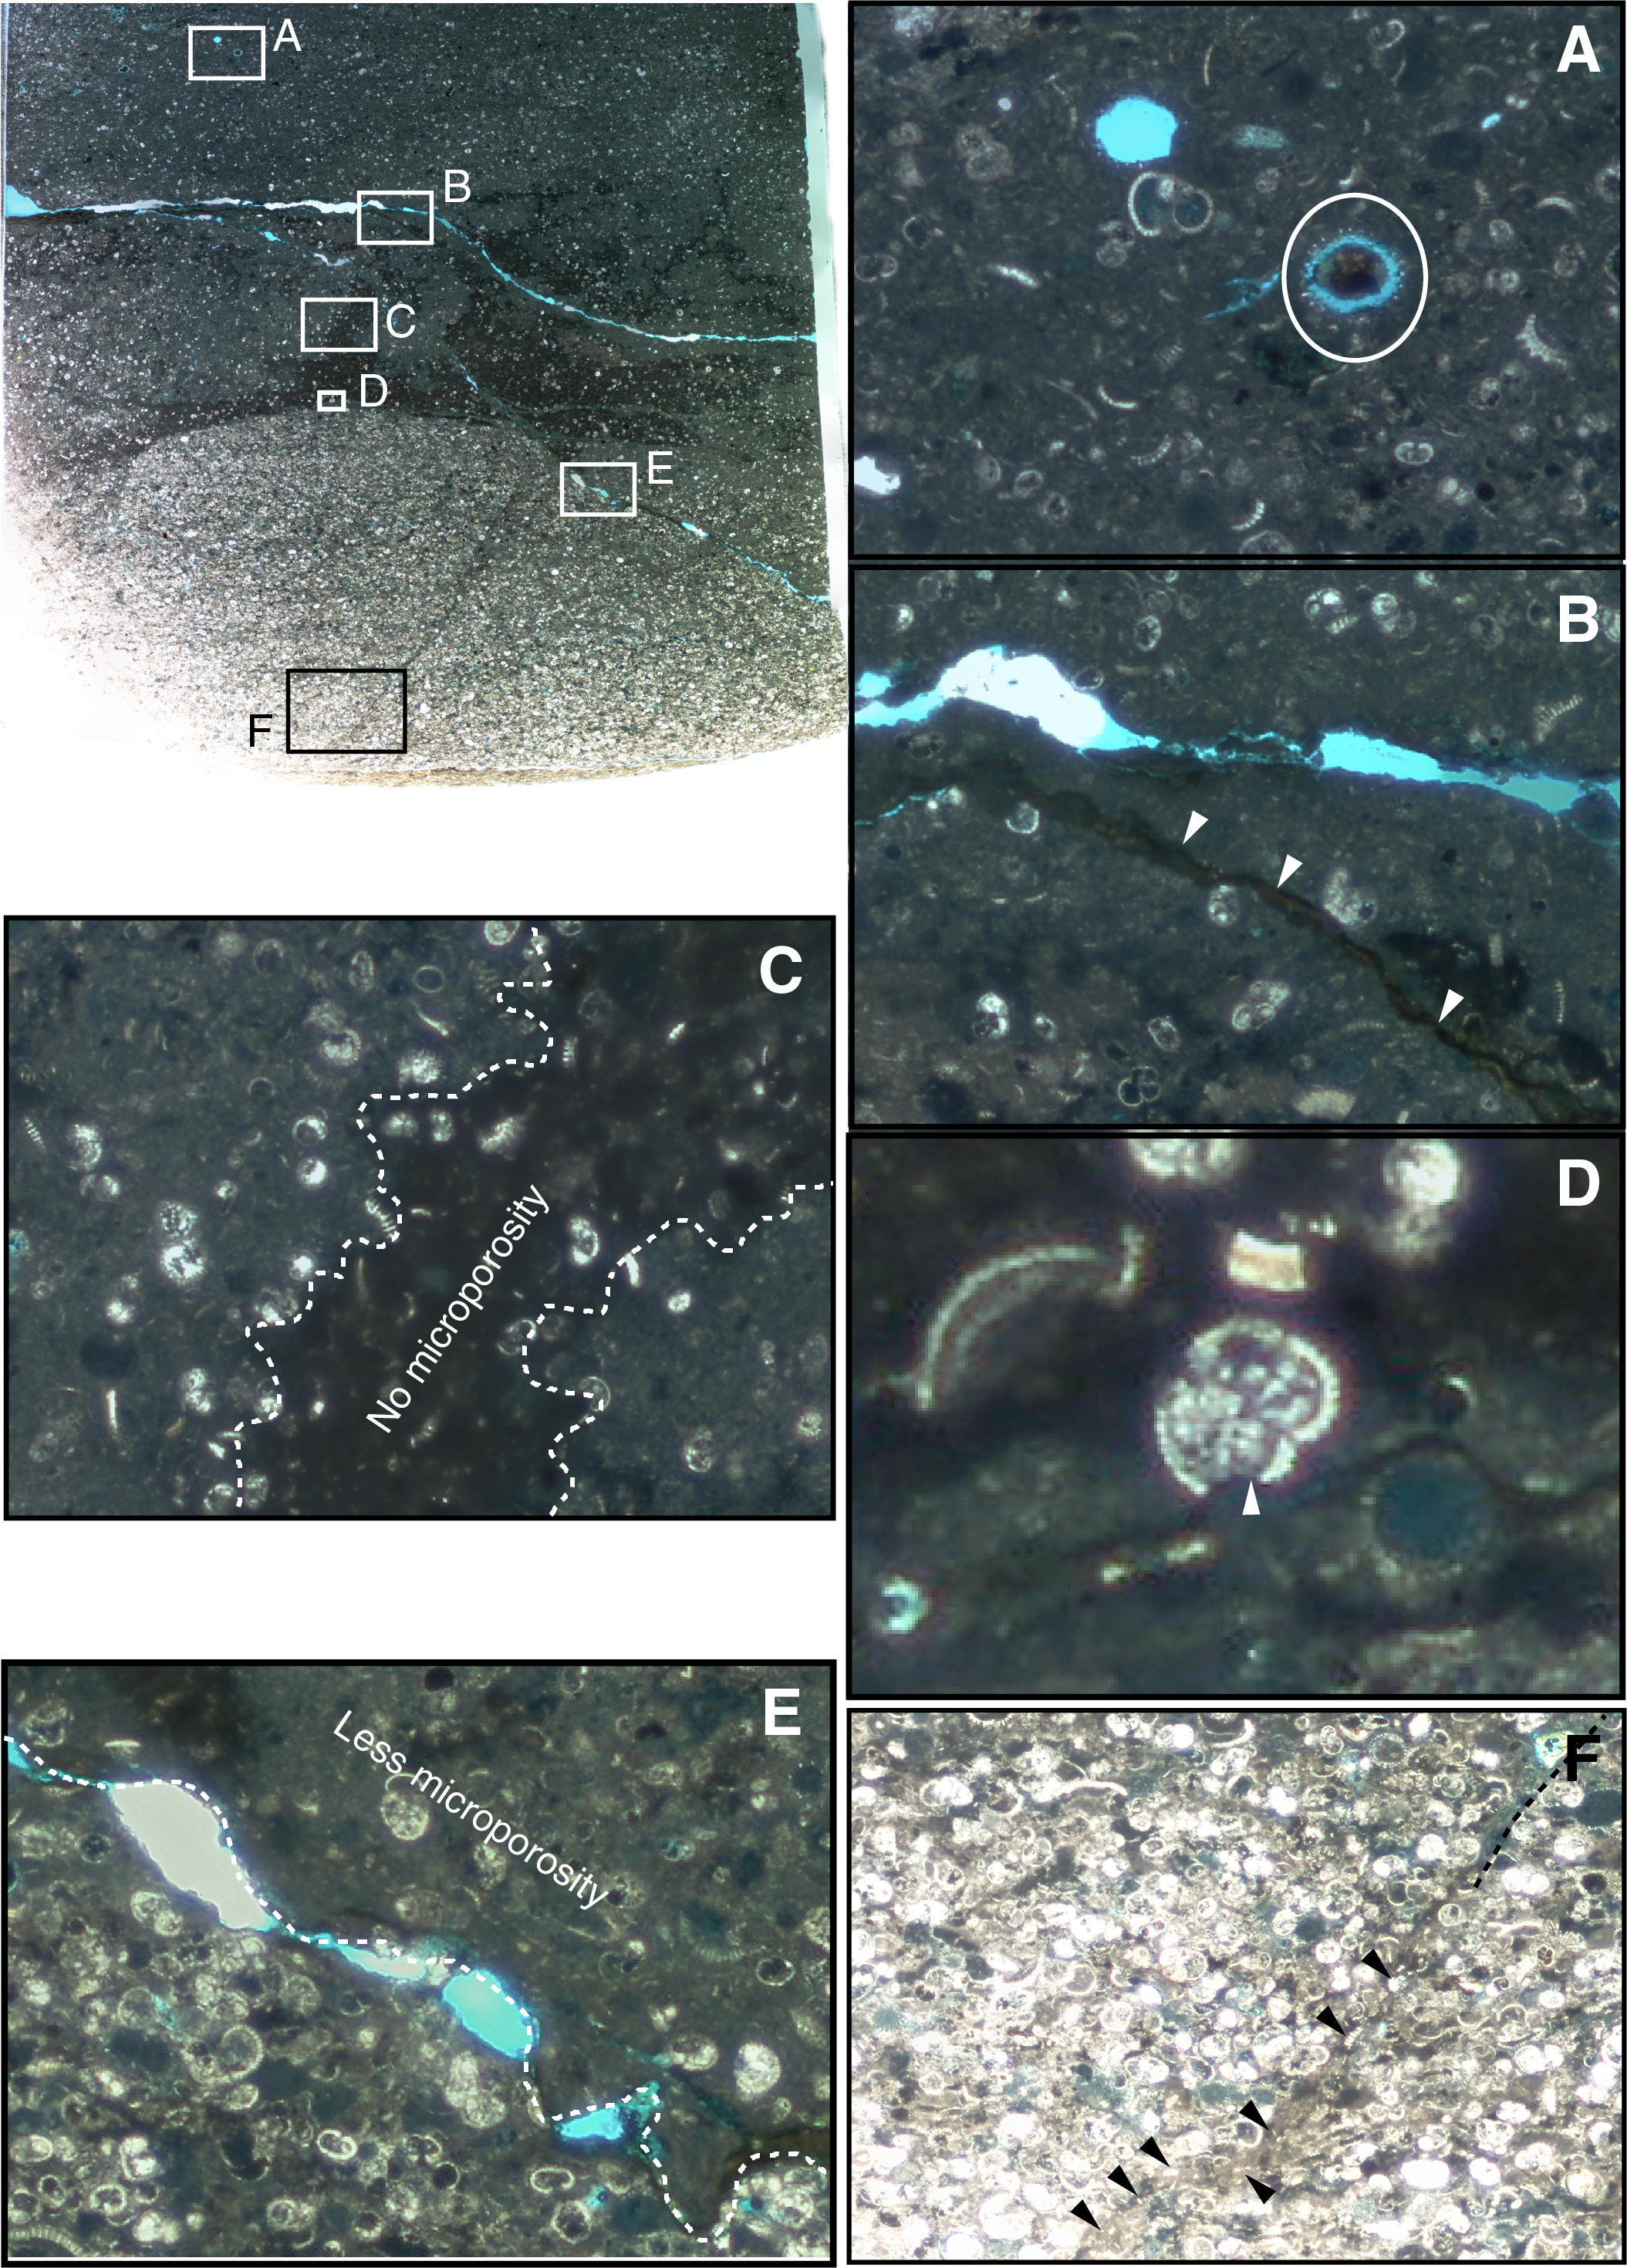
Figure F6. Photomosaic of interesting diagenetic features.
Results
At the scale of Subunit IIIB, observation of Cores 60R and 61R highlights alternations between brown ash-derived clays and white chalk (Figure F2). Numerous stylolites can be observed in the chalk intervals (Figures F3, F4, F5, F6). Most stylolites are parallel to what appears to be a slightly tilted stratigraphic plane. Some of these stylolites seem offset or terminated by fractures (Figures F4, F5). Some tilted stylolites might have been associated with rock strain or slip along fractures (Figures F3, F5). Measurement of the horizontal variation of stylolite thickness highlights intense and heterogeneous volume changes associated with the stylolite development at small scale (10 cm of core; Figure F2). Thin section scans highlight local dissolution differences within the chalk. Figure F3 shows a stylolite complex merging laterally that could be interpreted as a shear structure, dissolution pulling on the left side of the whole rock, potentially fracturing it. In Figure F6, the thin section of the photomosaic illustrates a complex diagenetic history of dissolution and reprecipitation, mainly in the form of micritic cement. Ghosts of dissolved bioclasts are visible in places (Figure F6A). The diagenetic sequence is obscured, but when the pore space is full of micritic cement, no fracture is observed (or observable); only stylolites underlined by insoluble clays and or organic matter seem to affect the fully micritic parts (Figure F6B). The intensity of micritic recrystallization is variable with some fully crystallized and some with microporosity (Figure F6C). Stylolites can locally affect bioclasts and dissolve them (Figure F6D). In addition, the stylolites can compartmentalize the chalk regarding the micritization (Figure F6E). Observed fractures have mostly been obscured by micritic reprecipitation. Some grain alignments along the fracture may suggest pore collapse along a joint plane (deformation band) (dashed line, Figure F6F). However, some fractures show microbrecciation of the bioclasts, indicating local slip (arrows, Figure F6F).
Acknowledgments
The authors would like to acknowledge the receipt of samples from the International Ocean Discovery Program (IODP). Sample preparation was realized thanks to the personal funding of Nicolas Thibault, and microscope pictures were realized by Tom Buls at the University of Copenhagen. The manuscript and figures are the work of the authors.
References
McNeill, L.C., Dugan, B., Petronotis, K.E., Backman, J., Bourlange, S., Chemale, F., Chen, W., Colson, T.A., Frederik, M.C.G., Guèrin, G., Hamahashi, M., Henstock, T., House, B.M., Hüpers, A., Jeppson, T.N., Kachovich, S., Kenigsberg, A.R., Kuranaga, M., Kutterolf, S., Milliken, K.L., Mitchison, F.L., Mukoyoshi, H., Nair, N., Owari, S., Pickering, K.T., Pouderoux, H.F.A., Yehua, S., Song, I., Torres, M.E., Vannucchi, P., Vrolijk, P.J., Yang, T., and Zhao, X., 2017. Expedition 362 summary. In McNeill, L.C., Dugan, B., Petronotis, K.E., and the Expedition 362 Scientists, Sumatra Subduction Zone. Proceedings of the International Ocean Discovery Program, 362: College Station, TX (International Ocean Discovery Program). https://doi.org/10.14379/iodp.proc.362.101.2017
Moreau, J., Boussaha, M., Nielsen, L., Thibault, N., Ullmann, C.V., and Stemmerik, L., 2016. Early diagenetic evolution of chalk in eastern Denmark. The Depositional Record, 2(2):154–172. https://doi.org/10.1002/dep2.19
Ricken, W., 1992. A volume and mass approach to carbonate diagenesis: the role of compaction and cementation. In Wolf, K.H., and Chilingarian, G.V. (Eds.), Developments in Sedimentology, 47:291–315. https://doi.org/10.1016/S0070-4571(08)70568-5
1 Moreau, J., Buls, T., and Thibault, N., 2020. Data report: multiscale visualization of stylolites, deformations in chalk from Subunit IIIB, Site U1480, IODP Expedition 362, Sumatra subduction zone. In McNeill, L.C., Dugan, B., Petronotis, K.E., and the Expedition 362 Scientists, 2017. Sumatra Subduction Zone. Proceedings of the International Ocean Discovery Program, 362: College Station, TX (International Ocean Discovery Program). https://doi.org/10.14379/iodp.proc.362.203.2020
2 The NW-Edge, Breadalbane, Durness, United Kingdom. julien.moreau@nw-edge.org
3 Faculty of Science, IGN, University of Copenhagen, Denmark.
This work is distributed under the Creative Commons Attribution 4.0 International (CC BY 4.0) license. 