McNeill, L.C., Dugan, B., Petronotis, K.E., and the Expedition 362 Scientists
Proceedings of the International Ocean Discovery Program Volume 362
publications.iodp.org

https://doi.org/10.14379/iodp.proc.362.204.2020
Data report: clay mineral assemblages in hemipelagic sediments entering the Sumatra subduction zone, IODP Sites U1480 and U1481, Expedition 3621
Karissa Rosenberger,2 Michael B. Underwood,2 Peter Vrolijk,2 and Samuel Haines3
Keywords: International Ocean Discovery Program, IODP, JOIDES Resolution, Expedition 362, Sumatra Subduction Zone, Site U1480, Site U1481, Sunda-Sumatra subduction zone, X-ray diffraction, clay mineral assemblages, illite polytypes, illite crystallinity, illite-mica bo, smectite
MS 362-204: Received 17 February 2020 · Accepted 19 May 2020 · Published 13 July 2020
Abstract
This report documents the results of X-ray diffraction analyses of 132 mud and mudstone samples collected offshore Sumatra during International Ocean Discovery Program Expedition 362. The clay-size mineral assemblage consists of smectite, illite, chlorite, kaolinite, and quartz. The relative abundance of smectite at Site U1480 decreases downsection from a mean value of 33 wt% in Unit I to a mean of 19 wt% in Unit II; illite increases from a mean of 49 wt% to a mean of 59 wt%. Smectite in Unit III increases to a mean of 73 wt%, and illite decreases to a mean of 19 wt%. Mean values are subordinate (<16 wt%) for undifferentiated chlorite + kaolinite and <7 wt% for quartz in all units. A significant compositional discrepancy occurs between Subunit IIIA at Site U1480 (mean smectite = 64 wt%) and Unit III at Site U1481 (mean smectite = 36 wt%). At Site U1480, the expandability of illite/smectite mixed-layer clays increases downsection, which is opposite to the trend expected with burial diagenesis. The maximum value is 88% within smectite-rich samples from Unit III. Values of the illite crystallinity index are between 0.42Δ°2θ and 0.76Δ°2θ, with most data straddling the generic boundary between advanced diagenesis and anchimetamorphism. Illite (060) reflections yield bo values of 8.988 to 9.000, which are indicative of low phengite contents. Smectite (060) reflections display peak apex positions of 61.998°–61.798°2θ, which are consistent with the mineral structure of montmorillonite. The detrital illite fraction contains 46%–60% 2M1 polytype, and the remainder is 1M/1Md.
Introduction
International Ocean Discovery Program (IODP) Expedition 362 focused on recovering the sedimentary section that will be subducted to seismogenic depths in the northern Sumatran subduction zone, which is part of the 5000 km long Sunda subduction zone system (Figure F1). Regionally, the input materials of this subduction zone are composed largely of trench-wedge and Bengal-Nicobar Fan sediments with a total thickness of 4–5 km (McNeill et al., 2017b). Beneath the fan sediments is a basal pelagic interval that overlies the basaltic crust of the subducting oceanic plate (Figure F2). Two sites (U1480 and U1481) were drilled, cored, and logged about 250 km southwest of the subduction front (Figure F1).
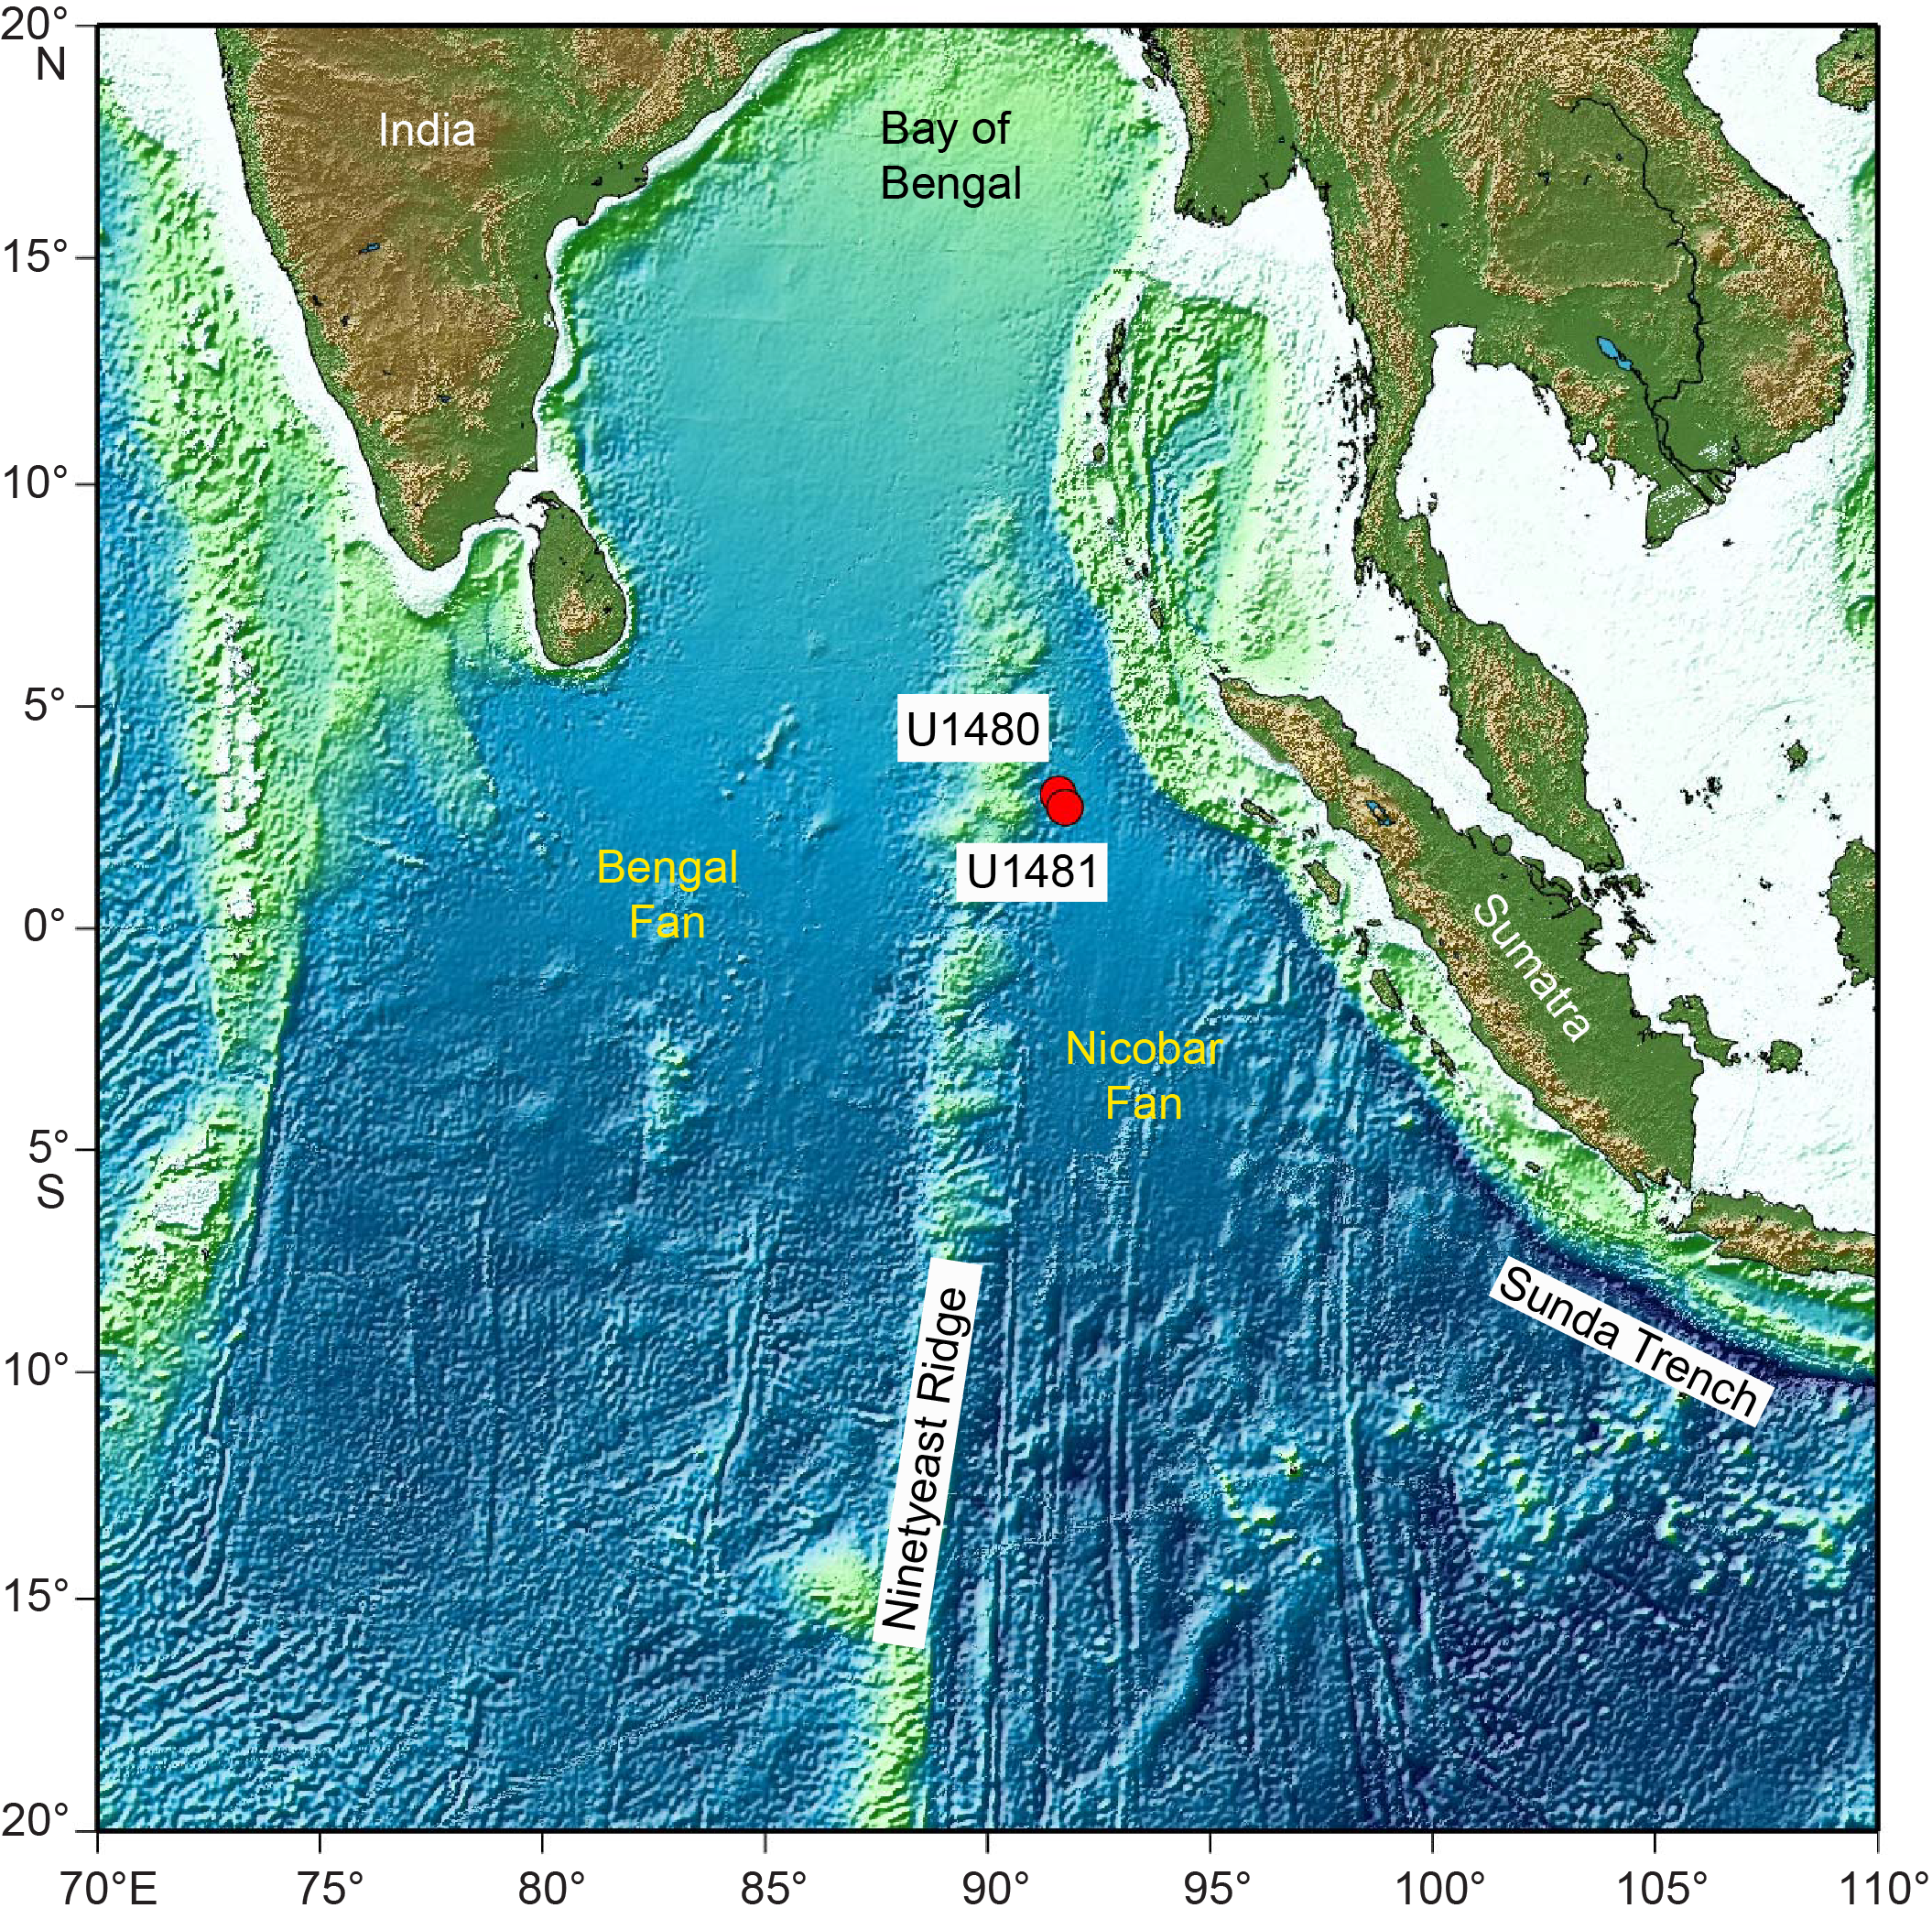
Figure F1. Eastern Indian Ocean.

Figure F2. Seismic reflection profiles.
The primary drilling objective for Site U1480 was to recover a complete section of the incoming sedimentary section and uppermost basaltic basement (McNeill et al., 2017b). Six lithologic units were identified based on major changes in grain size, bed thickness, and composition (McNeill et al., 2017a; McNeill et al., 2017b). Unit I (0–26.42 meters below seafloor [mbsf]) is early Pleistocene to Holocene in age and composed of calcareous clay with interbeds of fine-grained sand, silty clay, and minor volcanic ash. Unit II (26.42–1250.35 mbsf) is late Pliocene to early Miocene in age and contains thin to medium beds of sandy silt and fine-grained sand (turbidites) that transition downsection into claystone, silty claystone, and muddy sandstone. Unit III (1250.35–1327.23 mbsf) is late Paleocene to late Miocene in age and contains claystone and tuffaceous silty claystone. Unit IV (1327.23–1349.80 mbsf) is Late Cretaceous to late Paleocene in age and contains basalt, tuffaceous and volcaniclastic sandstone, and volcaniclastic breccia. Unit V (1349.80–1415.35 mbsf) is Late Cretaceous in age and contains calcareous claystone, chalk, and intercalated basalt intrusions. Unit VI (1415.35–1431.63 mbsf) is also late Cretaceous in age but composed entirely of basalt, which was interpreted to be the top of igneous oceanic crust (McNeill et al., 2017a; McNeill et al., 2017b).
At Site U1481, the primary drilling objective was to core and log the deeper part of the stratigraphic section because it contains intervals that may become the plate boundary décollement farther landward (McNeill et al., 2017b). Two lithologic units (McNeill et al., 2017a; McNeill et al., 2017b) were correlated with Units II and III at Site U1480 on the basis of age and lithology. Unit II (1149.70–1360.12 mbsf) is late Miocene in age and contains claystone, silty claystone, and muddy sandstone. Unit III (1360.12–1498.72 mbsf) is early to late Miocene in age and consists of claystone (McNeill et al., 2017a; McNeill et al., 2017b).
This report summarizes the results of X-ray diffraction (XRD) analyses of clay-size fractions from 132 core samples extracted from Sites U1480 and U1481. Samples were preferentially collected from clay-rich intervals of the cores rather than interbeds of turbidites. Most sample intervals in the split cores were positioned immediately adjacent to whole-round specimens that were extracted for studies of interstitial water geochemistry and frictional-hydrogeologic properties, and clay XRD specimens were co-located in "clusters" together with discrete specimens for bulk powder XRD, carbon-carbonate, grain-size analysis, and moisture and density; additional samples were taken to document significant local lithology changes (e.g., transition from coarser grained to finer grained intervals, decrease in carbonate content, or change in color) to ensure both "representative" and end-member clay mineral compositions. Our primary objective is to document changes in proportions of smectite, illite, chlorite + kaolinite, and quartz in mud and mudstone specimens relative to depth below seafloor and lithostratigraphy. Such information can be used to infer how paleoclimate, detrital provenance, and first-order patterns of sediment dispersal may have changed over time (e.g., Biscaye, 1965; Petschick et al., 1996; Thiry, 2000; Gingele et al., 2001; Phillips et al., 2014). Such information is relevant to the objectives of Expedition 362 because large variations in the proportions of clay minerals may have significant effects on frictional properties and dehydration reactions as sedimentary strata enter the deeper subduction zone (e.g., Geersen et al., 2013; Hüpers et al., 2017).
In addition to the basic mineral assemblages, we made measurements intended to probe clay provenance and thermal maturity state, including evidence of the extent of smectite-to-illite diagenesis, identification of specific varieties of smectite (dioctahedral versus trioctahedral), measurement and computation of bo values for the detrital illite assemblage, and determination of proportions of 1M/1Md versus 2M1 polytypes in the detrital illite-mica assemblages. In the context of our study, proportions of 2M1 versus 1M/1Md polytypes yield information about the generic environmental conditions during illite formation in the prospective detrital source areas (e.g., Frey et al., 1983; Paudel and Arita, 2006). The 2M1 polytype is thought to form at temperatures above 280°C (e.g., Srodon and Eberl, 1984), whereas 1M/1Md polytypes form below approximately 200°C (e.g., Velde, 1965). Illite-mica bo values (phengite content) likewise provide information about the pressure conditions detrital source rocks were exposed to during their histories of advanced diagenesis and metamorphism (e.g., Sassi and Scolari, 1974; Padan et al., 1982).
Methods
Sample preparation
Isolation of clay-size fractions for XRD analyses started with air-drying and gentle hand crushing of the mud(stone) with a ceramic mortar and pestle, after which specimens were immersed in 3% H2O2 for at least 24 h to digest organic matter. After adding ~250 mL of Na-hexametaphosphate solution (concentration of 4 g/1000 mL of distilled H2O), beakers were placed into an ultrasonic bath for 5 min to promote disaggregation and deflocculation. These steps were repeated until disaggregation was complete. Washing consisted of two passes through a centrifuge (8000 rpm for 20 min) with resuspension in distilled deionized water after each pass. After transferring suspended sediment to a 125 mL plastic bottle, the samples were resuspended by vigorous shaking and a 2 min application of an ultrasonic cell probe. The clay-size splits (<2 µm equivalent settling diameter) were separated by centrifugation (1000 rpm for 3.6 min). Preparation of oriented clay aggregates followed the filter-peel method (Moore and Reynolds, 1989b) using 0.45 µm filter membranes. Samples were then placed in a closed vapor chamber for 48 h at room temperature to saturate the aggregates with ethylene glycol. This step is necessary to expand the interlayer site of smectite and minimize interference between the smectite (001) and chlorite (001) peaks (Figure F3).

Figure F3. X-ray diffractograms for typical sample.
Based on initial XRD results, representative illite- and smectite-rich samples were chosen from throughout the sedimentary section and among the lithostratigraphic units to evaluate illite polytypes and bo values, as well as the specific varieties of dioctahedral versus trioctahedral smectite based on (060) reflections. The preparation of each clay-size powder began with overnight freezing of residual slurry containing the <2 µm clay-size fraction. The frozen samples were placed in a freeze dryer for a minimum of 24 h. The dried samples were hand crushed using a ceramic mortar and pestle, and the powders were transferred into small metal inserts in front-loaded sample holders. Sample volume was too small to achieve optimal random particle orientation in the powders using such methods as spray drying (e.g., Hillier, 2000). Rather than attempting truly quantitative analyses, the objective was to provide a preliminary screening and reveal whether or not large differences exist in the illite polytypes, phengite contents, and smectite populations.
X-ray diffraction
All samples were analyzed at the New Mexico Bureau of Geology and Mineral Resources using a Panalytical X'Pert Pro diffractometer with a Cu anode. Routine scans of oriented clay aggregates were run at generator settings of 45 kV and 40 mA. The continuous scans cover an angular range of 2°–28°2θ with a scan step time of 1.6 s, step size of 0.01°2θ, and a rotating sample holder. Slits were 0.5° (divergence) and 0.1 mm (receiving). MacDiff software (version 4.2.5) was used to establish a baseline of intensity, smooth counts, correct peak positions offset by misalignment of the detector (using the quartz [100] peak at 20.95°2θ; d-value = 4.24 Å), and calculate integrated peak areas (total counts). This program also calculates peak width at half height.
Most of the glycol-saturated samples that we analyzed display weak but resolvable chlorite (001) peaks and stronger composite peaks from the chlorite (002) and kaolinite (001) reflections (Figure F3). To confirm proportions of chlorite in computed values of undifferentiated chlorite + kaolinite, 16 slides from a broad range of stratigraphic intervals were scanned a second time after heating in a muffle furnace at 550°C for 1 h. The heated slides were scanned over an angular range of 2°–28°2θ with a scan step time of 1.6 s and a step size of 0.01°2θ. Slits were 0.5° (divergence) and 0.1 mm (receiving). Figure F3 shows three X-ray diffractograms that demonstrate the effects of glycol saturation and heating the clay slide. Heating to 550°C causes kaolinite to decompose, whereas chlorite remains intact. The repetition of scans allows determination of whether chlorite or kaolinite is the dominant mineral. Additionally, exposure to these temperatures causes the smectite (001) structure to collapse to ~10 Å, which adds counts to the illite (001) peak (Figure F3).
Illite-rich powders were scanned from 15° to 40°2θ at 0.5°/min with a step size of 0.05°2θ to identify proportions of illite-mica polytypes. Figure F4 show a representative diffractogram with identification of diagnostic peaks, including such nonclay minerals as plagioclase. Illite- and smectite-rich powders were scanned from 59° to 63°2θ at 0.5°/min with a step size of 0.05°2θ to record the angular position and d-value of the (060) reflections. Representative examples of the resulting diffractograms are shown in Figure F5.

Figure F4. Peaks used to identify illite polytypes.
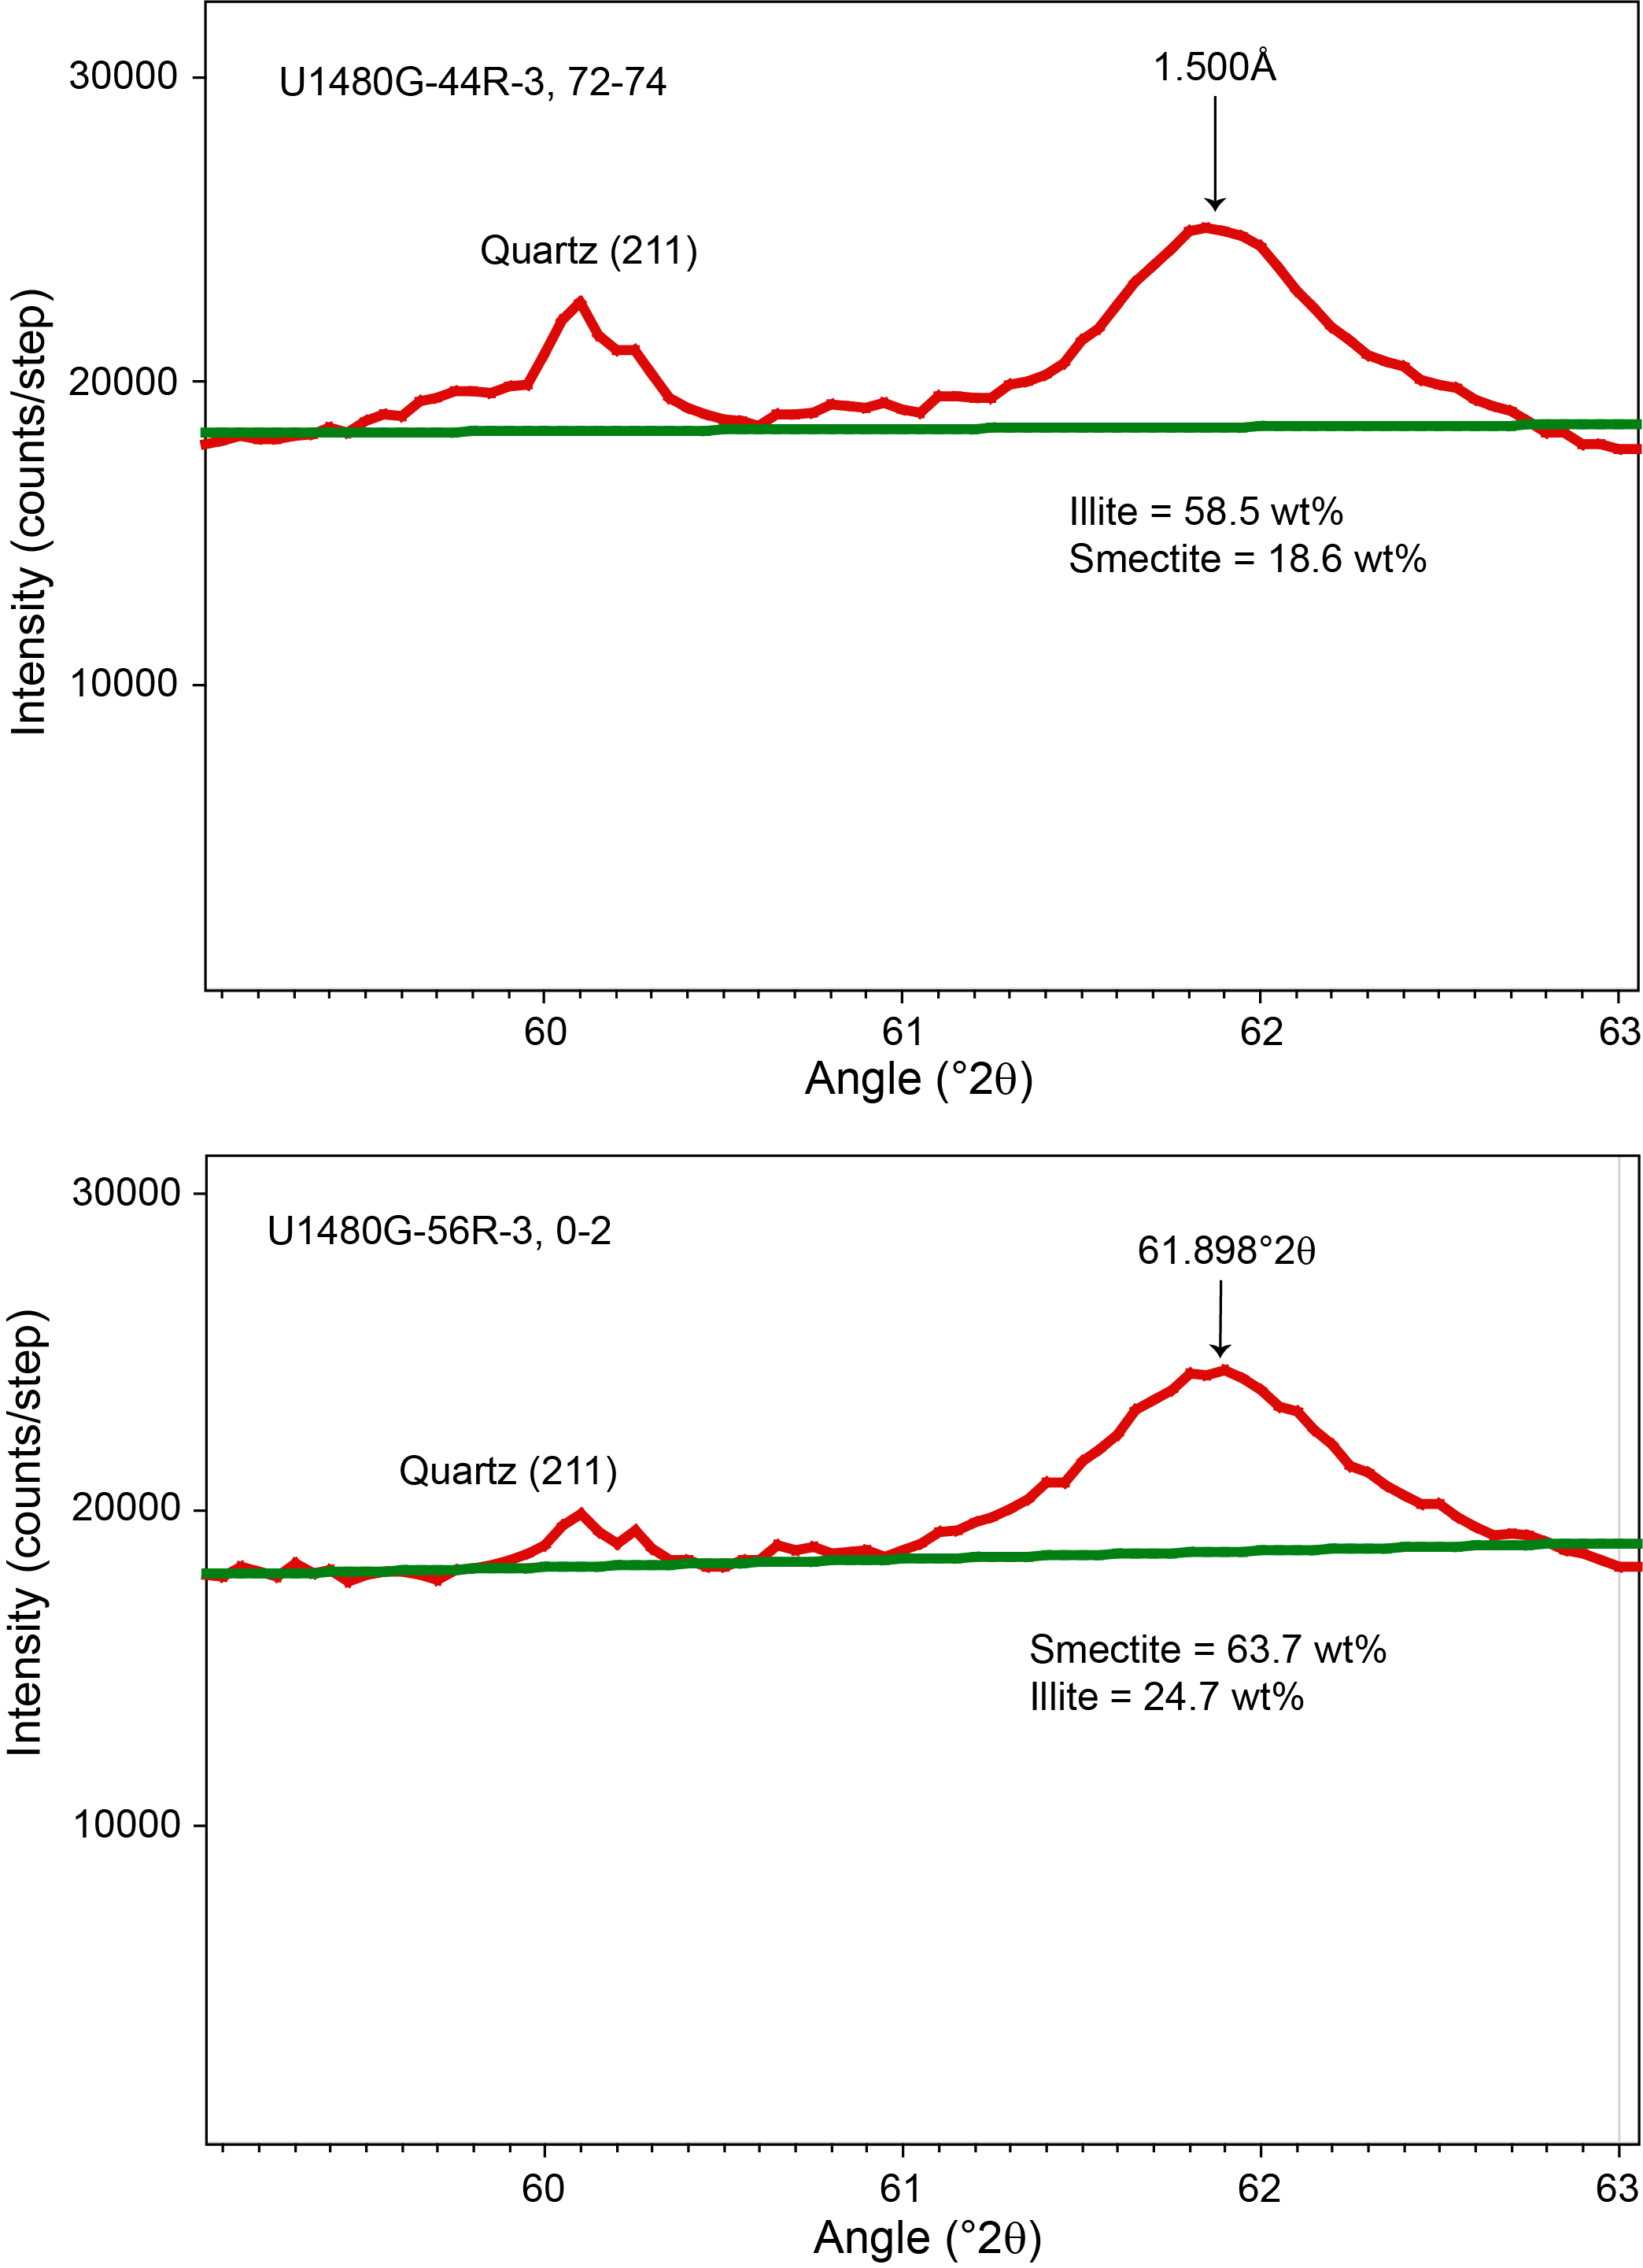
Figure F5. Illite- and smectite-rich powders.
Calculations of mineral abundance
Figure F6 shows four X-ray diffractograms covering a representative compositional range for samples from Expedition 362 with identification of characteristics peaks for quantitative analysis of the clay mineral assemblages. We utilized three computational approaches using values of integrated peak area: (1) Biscaye (1965) weighting factors (1× smectite, 4× illite, and 2× undifferentiated chlorite + kaolinite), (2) singular value decomposition (SVD) normalization factors (see Fisher and Underwood [1995] for comprehensive description), and (3) regression equations that relate weight percent to peak area (Figure F7). To calibrate, standard clay-size mineral mixtures were analyzed by Underwood et al. (2020), where smectite + illite + undifferentiated (chlorite + kaolinite) + quartz = 100%. As evaluated in detail by Underwood et al. (2020), the computations using Biscaye (1965) weighting factors result in the largest errors of accuracy, with systematic underestimates of illite abundance and overestimates of chlorite + kaolinite abundance. The average values of absolute error (true weight percent − computed weight percent) using SVD normalization factors (Table T1) are 6.2 wt% for smectite, 3.3 wt% for illite, and 5.9 wt% for undifferentiated chlorite + kaolinite. Average errors using regression equations (Figure F7) are the smallest: 3.9 wt% for smectite, 3.0 wt% for illite, and 5.1 wt% for chlorite + kaolinite (Underwood et al., 2020). Histograms of the error distributions reinforce the notion that Biscaye (1965) weighting factors result in both larger and systematic inaccuracies, and results using regression equations are closer to a Gaussian fit. Thus, throughout this report, our plots and comparisons of clay mineral abundance are based on computations using the regression equations. If stratigraphic variations are less than these average errors, we regard the differences as geologically insignificant.
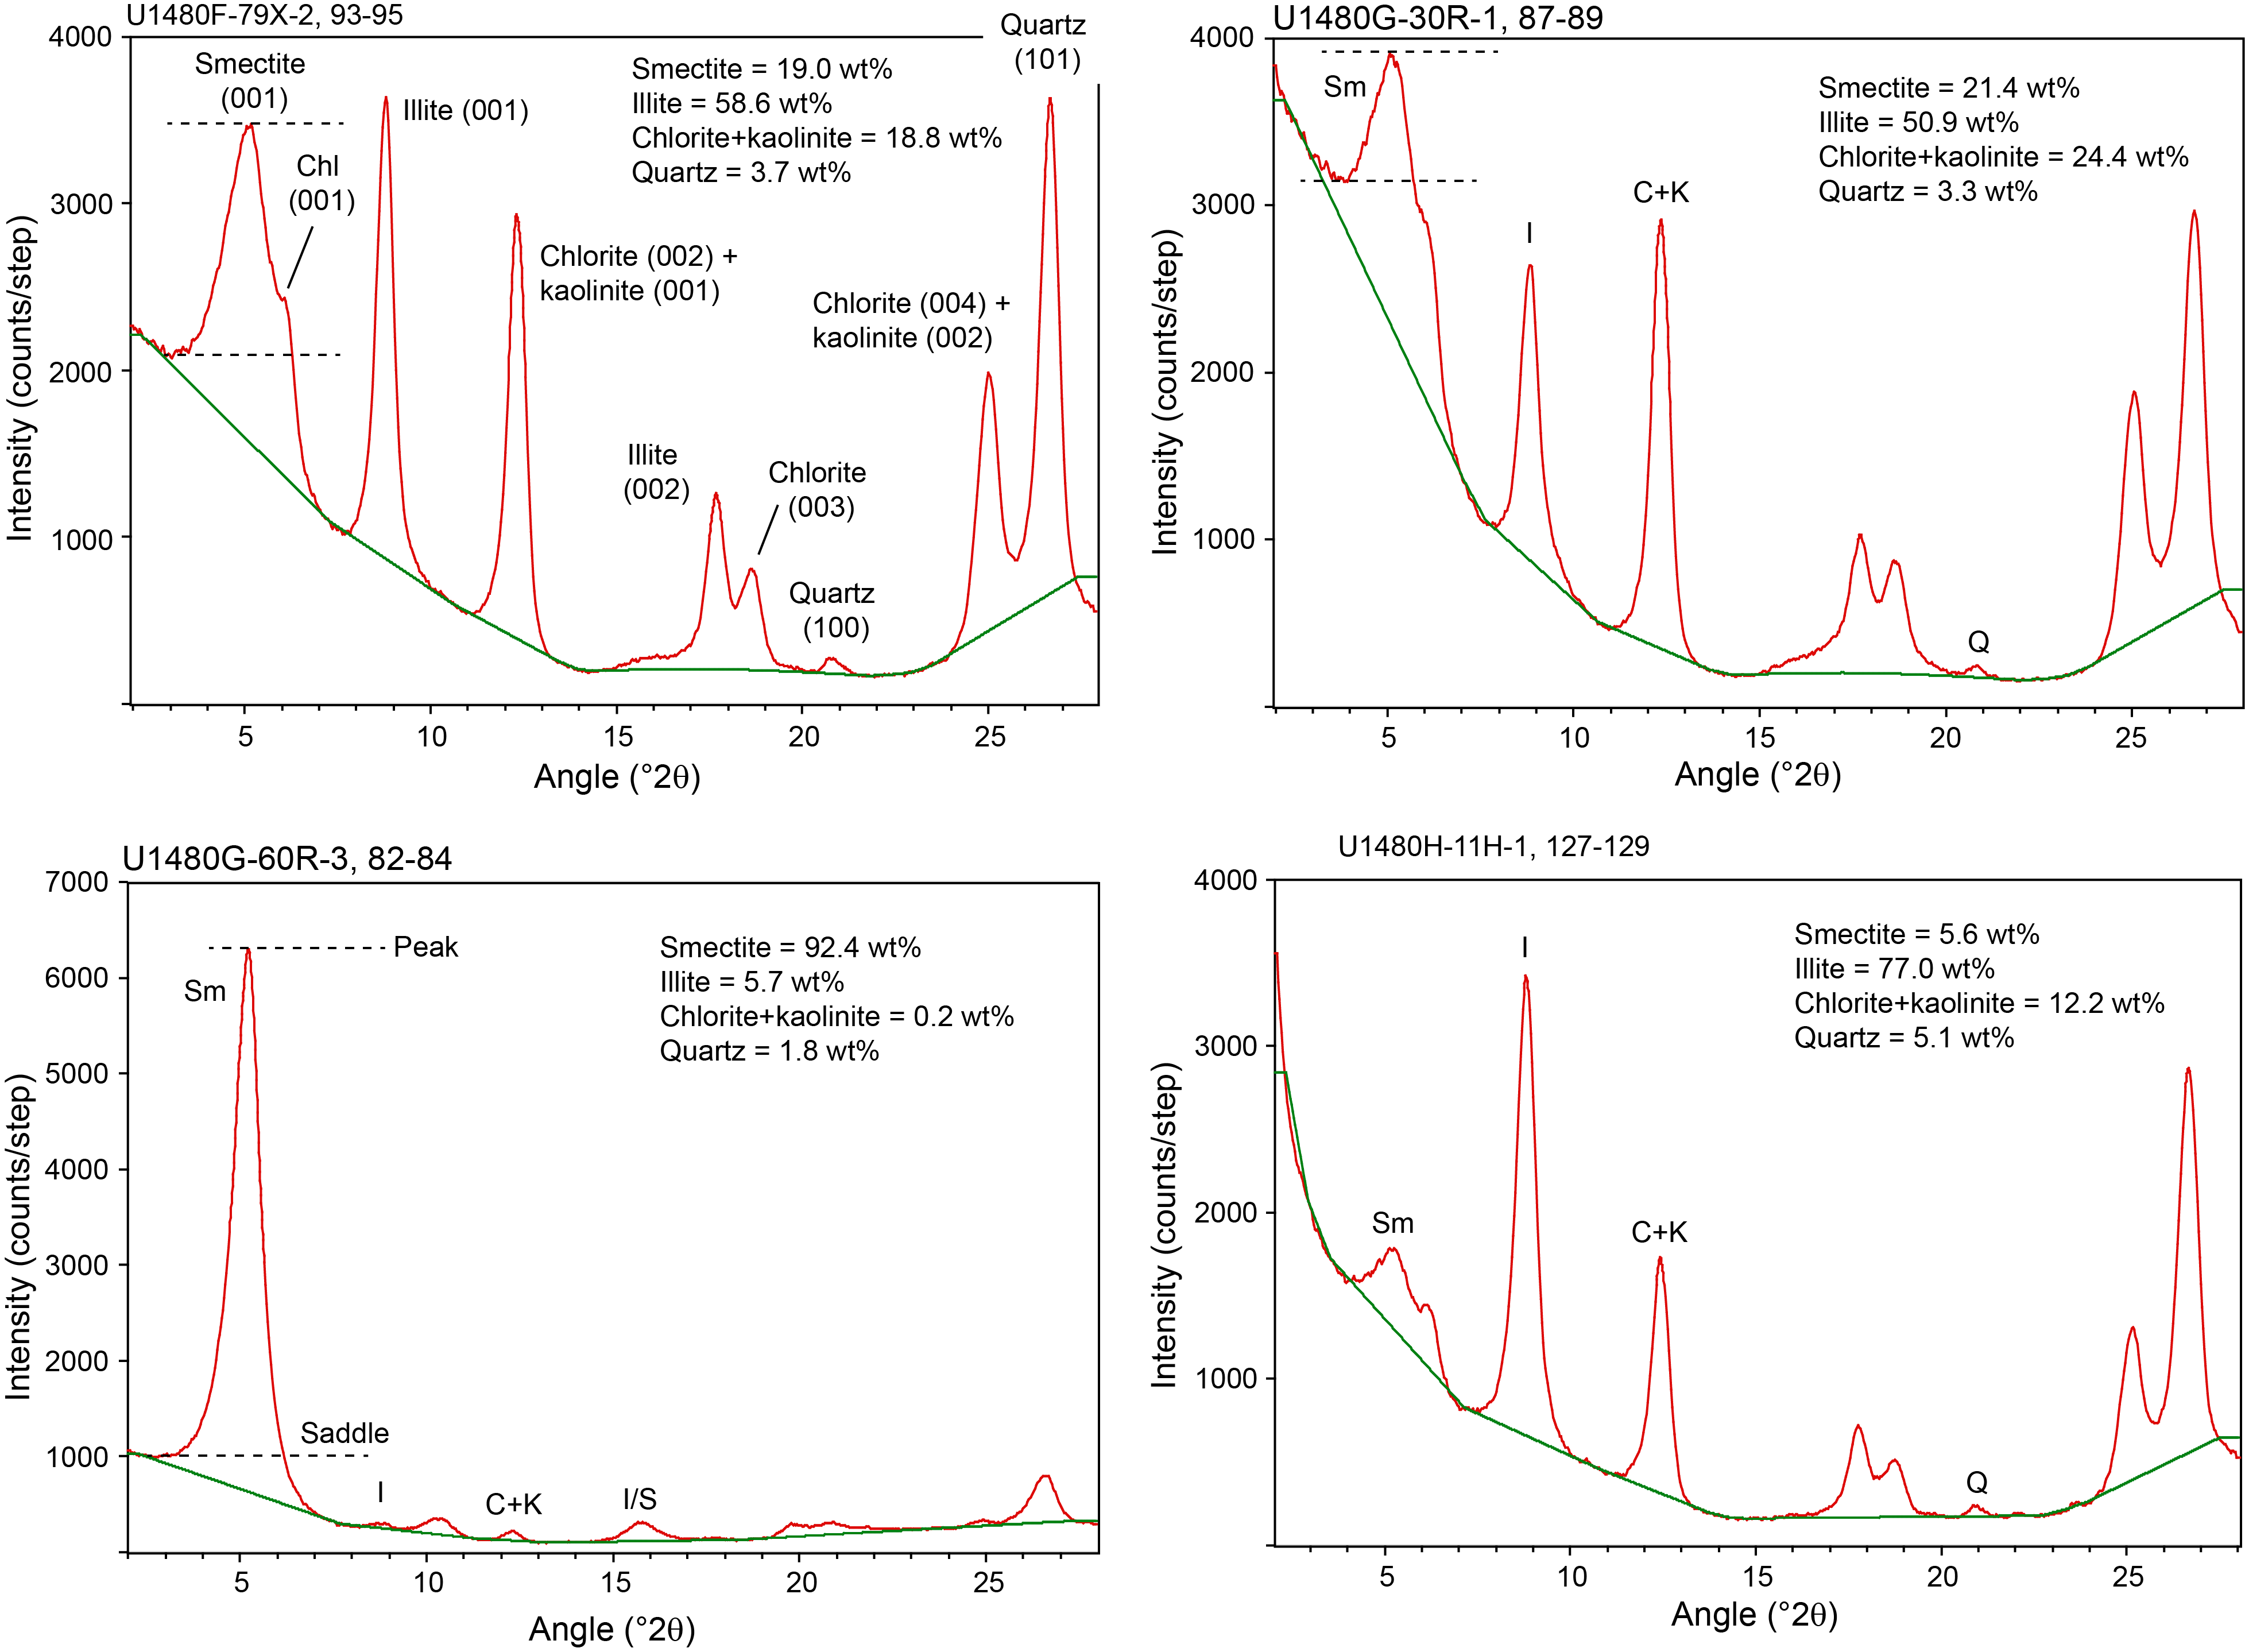
Figure F6. Smectite, illite, chlorite, kaolinite, and quartz peaks.
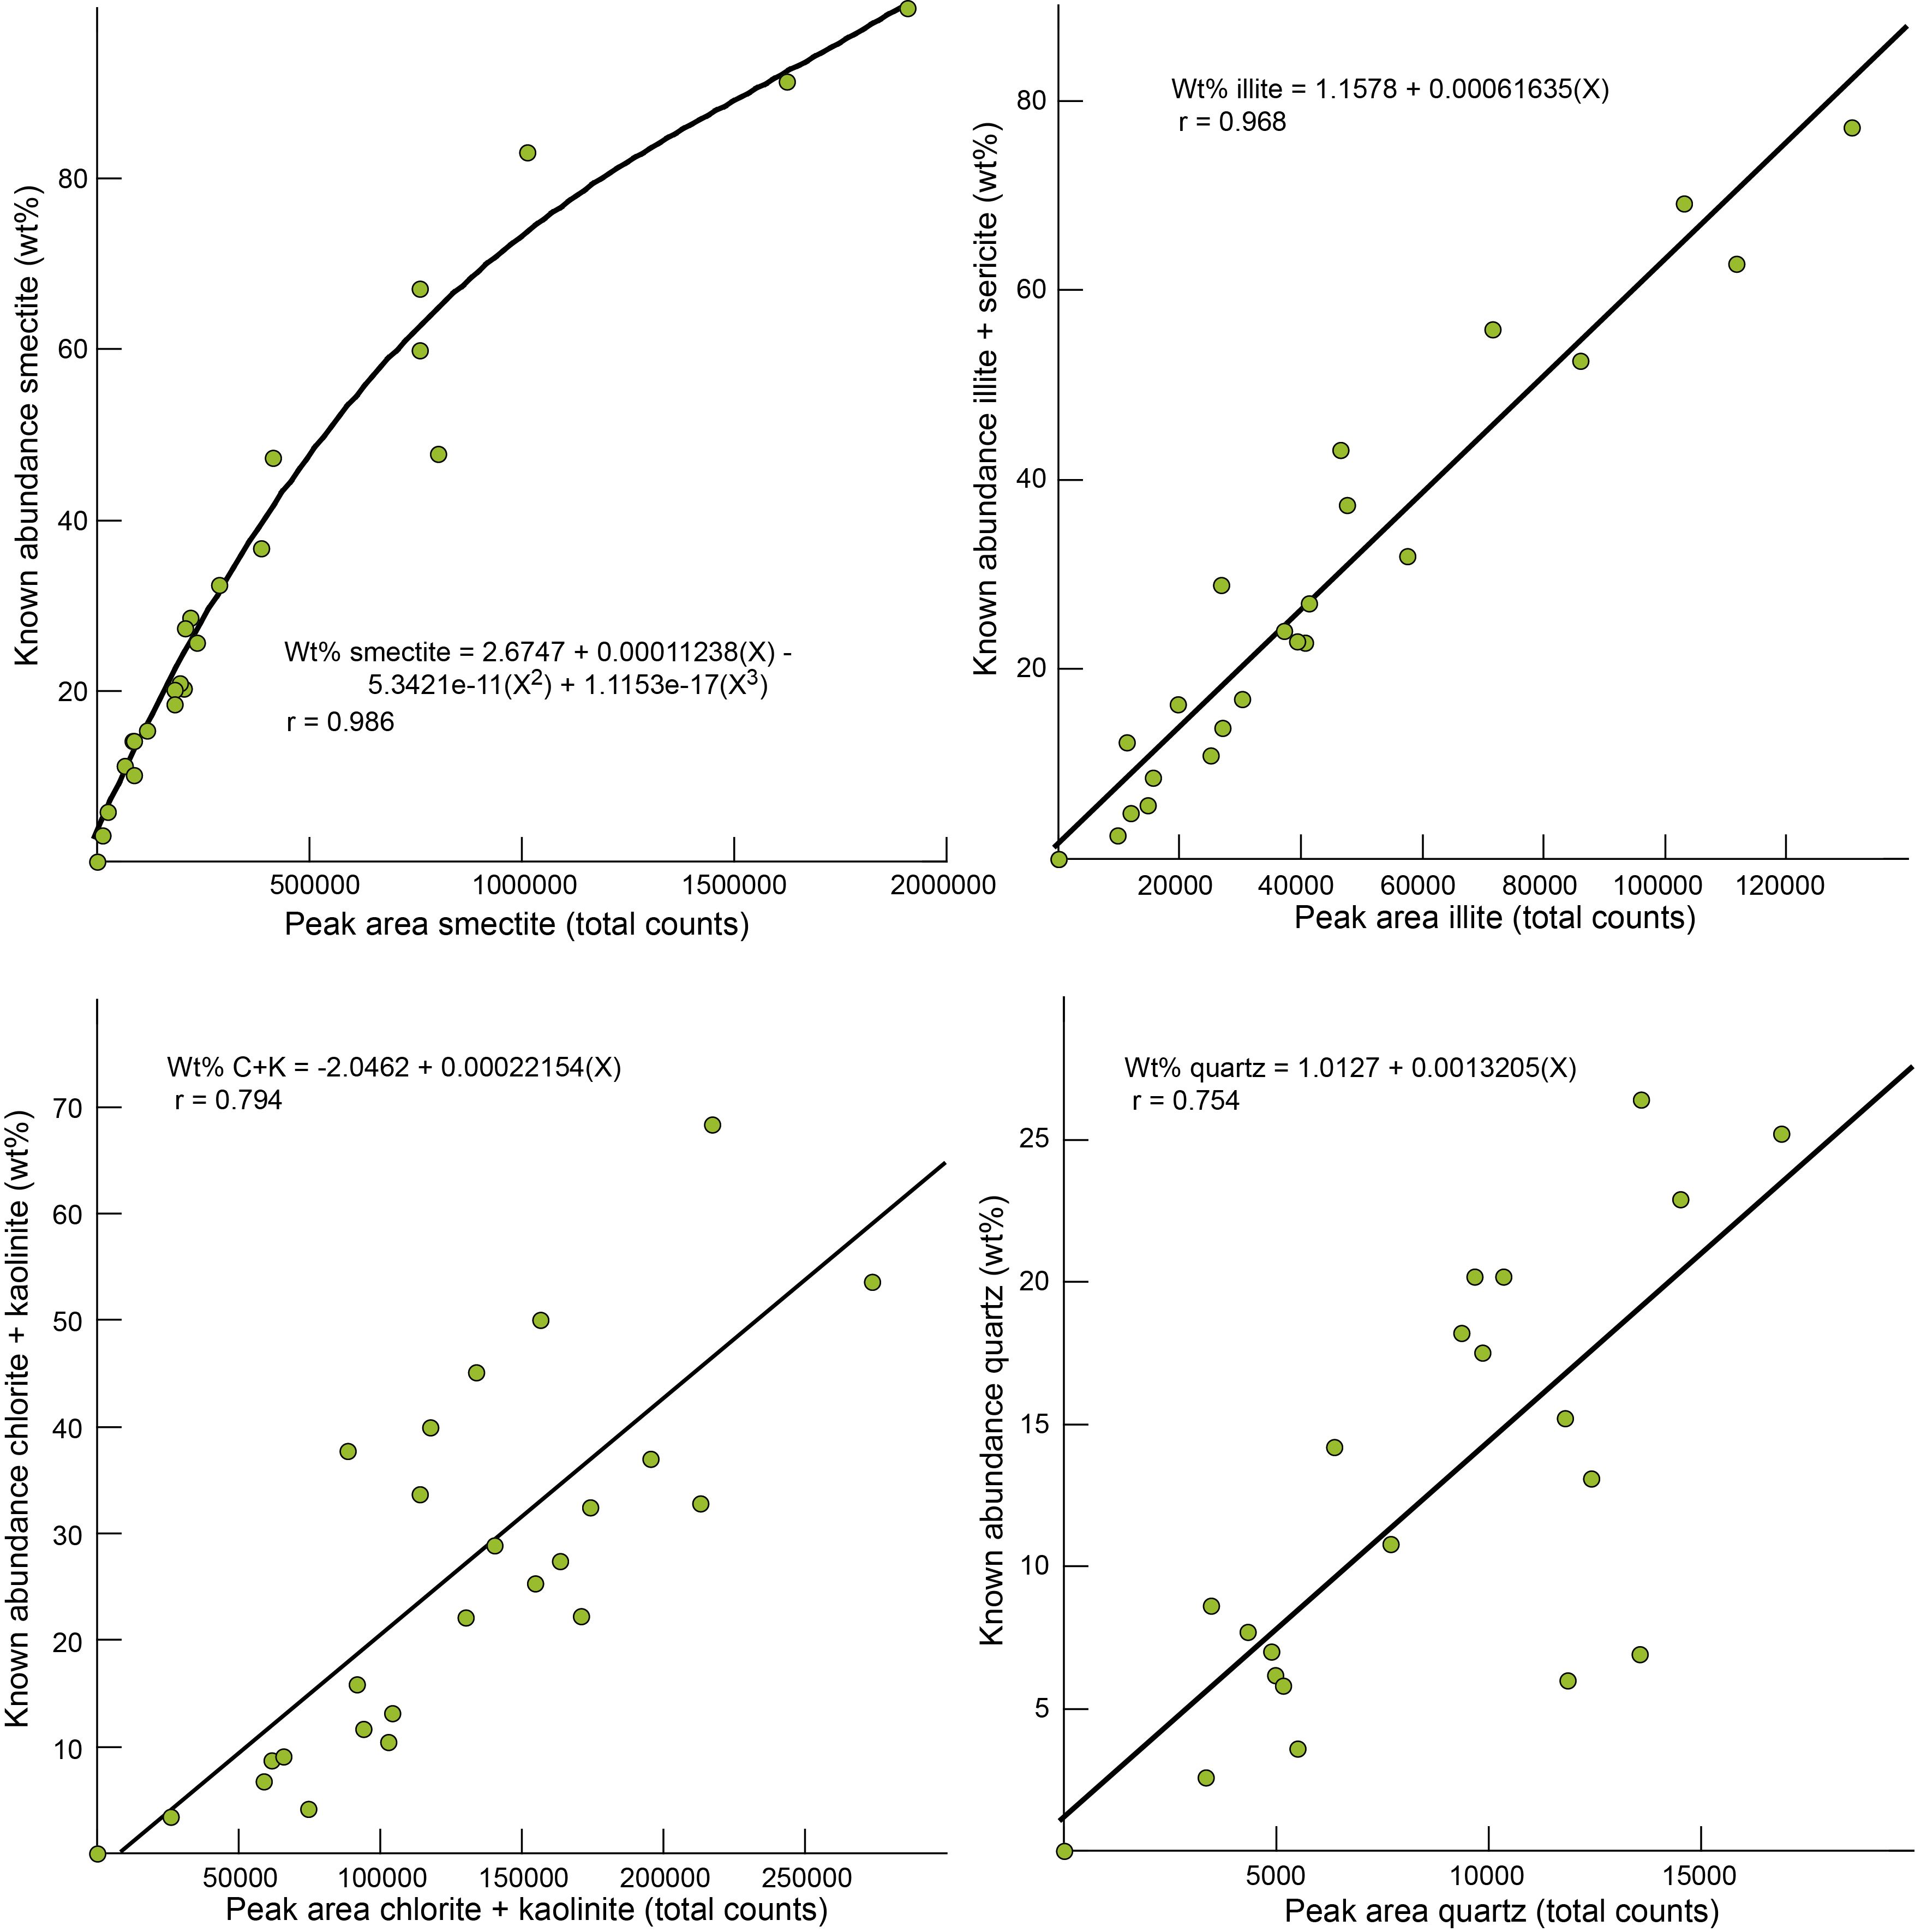
Figure F7. Regression equations and peak area vs. known abundance, clay-size standards.
In practice, reductions in the intensity of the peak at ~12.2°2θ (d-value = ~7 Å) after heating clays to 550°C can be attributed to decomposition of kaolinite. However, heating also changes the measured intensities of other peaks relative to their comparable peaks from glycol-saturated scans (Figure F3). The illite (001) peak at ~8.8°2θ (d-value = ~10 Å), for example, increases significantly because of collapse of the smectite (001) lattice structure (Figure F3). The amount of quartz remains unchanged by heating, but its (101) peak intensity is usually reduced. Thus, to compute the proportion of chlorite in undifferentiated chlorite + kaolinite, we normalized the two peak intensity values before and after heating to the intensity of the quartz (101) peak. The equation is
- CK = intensity of undifferentiated chlorite (002) + kaolinite (001) glycol saturated,
- Q1 = intensity of quartz (101) glycol saturated,
- Q2 = intensity of quartz (101) heated, and
- C = intensity of residual chlorite (002) heated.
Indicators of clay diagenesis
To document the extent of clay diagenesis, which could be either in situ or an indicator of conditions in potential detrital source areas, the saddle/peak method of Rettke (1981) was used to calculate percent expandability of undifferentiated discrete smectite and illite/smectite (I/S) mixed-layer clay (Figure F6). This method is sensitive to the proportions of discrete illite (I) versus I/S mixed-layer clay. Our calculations follow a curve for 1:1 mixtures of I and I/S. A complementary way to calculate the proportion of illite in the I/S mixed-layer phase is based on the position (d-value) of the (002/003) peak (following Moore and Reynolds, 1989a) after correcting the diffractogram peak position for misalignment of the detector and sample holder. That approach is valid, however, only if a sample contains enough I/S to generate clearly resolved peaks. Values of the illite crystallinity (Kübler) index (Kübler and Jaboyedoff, 2000; Robinson et al., 1990; Warr and Ferreiro Mählmann, 2015) are reported here as peak width at half height (Δ°2θ) for the (001) reflection. Those values decrease (i.e., the peak narrows) as illite becomes more crystalline.
Identification of individual mineral types
Scans of random clay powders confirmed that the detrital illite fraction is composed of 1M (or a continuous series of 1Md + 1M) and 2M1 polytypes (Figure F4). To determine their relative proportions, we completed Wildfire (Reynolds, 1993) simulations of hkl peaks following the methods described by Haines and van der Pluijm (2008, 2010). A custom-developed spreadsheet was used to match natural peak patterns to simulations based on an existing library of reference reflections. The libraries of reference patterns span 22°–36°2θ, which is the range of illite polytype–specific peaks. Because sample preparation methods allowed nonclay minerals such as feldspar to persist in the clay fraction, significant reflections from the feldspar in this 2θ interval, as well as 001 reflections from other clay minerals, such as chlorite and kaolinite, reduced the precision of the polytype quantification analysis. Although some degree of nonrandom clay orientation is likely given the sample holders used, this is accounted for through a correction ("Dollase factor") applied in the modeling analysis. Taking all of these issues into account, we estimate the error of determining percentage of 2M1 mica in any sample is 7%.
To compute the bo value (phengite content) of the detrital illite mix, we recorded the d-value of the illite (060) reflection after using the quartz (211) peak at 60.1°2θ to correct peak positions for small misalignments of the instrument (Figure F5). The bo values (d-value × 6) can be compared with reference curves or ranges of values from well-documented metamorphic terrains subjected to a variety of pressure and temperature conditions (e.g., Sassi and Scolari, 1974; Padan et al., 1982).
Smectite is actually a diverse group of expandable clay minerals. To determine whether smectite-rich samples contain di- or trioctahedral minerals of the smectite group (e.g., montmorillonite versus saponite), we recorded the d-value of the (060) reflection, again using the quartz (211) peak at 60.1°2θ to correct peak positions for small misalignments (Figure F5). We compare those values with the data of Brindley (1980). The (060) d-values for montmorillonite, for example, range from 1.492 to 1.504 Å (62.22°–61.67°2θ), whereas comparable values for saponite and hectorite (trioctahedral varieties) are 1.520–1.530 Å (60.95°–60.51°2θ).
Results
Clay mineral assemblages
Tables T2 and T3 show the integrated peak area values (total counts) for smectite, illite, undifferentiated chlorite + kaolinite, and quartz for samples from Sites U1480 and U1481, respectively. These tables also include the values of mineral abundance (in weight percent) calculated using Biscaye (1965) weighting factors, SVD normalization factors, and regression equations.
A graphical overview of the XRD results for Sites U1480 and U1481 (weight percent computed using regression equations) is shown using ternary diagrams (Figure F8). These plots demonstrate that contents of undifferentiated chlorite + kaolinite are subordinate to illite and smectite in all lithologic units. Starting at the base of the stratigraphic section, Subunits IIIA and IIIB (Site U1480) are distinctly smectite rich, but there is a significant shift to a more illitic assemblage in the correlative deposits (Unit III at Site U1481). Subunits IIC and IIB are similar to one another in composition, with proportions of illite dominating. The content of illite increases even more in Subunit IIA, whereas the assemblages in Unit I are more heterogeneous with significant increases in percentages of smectite.
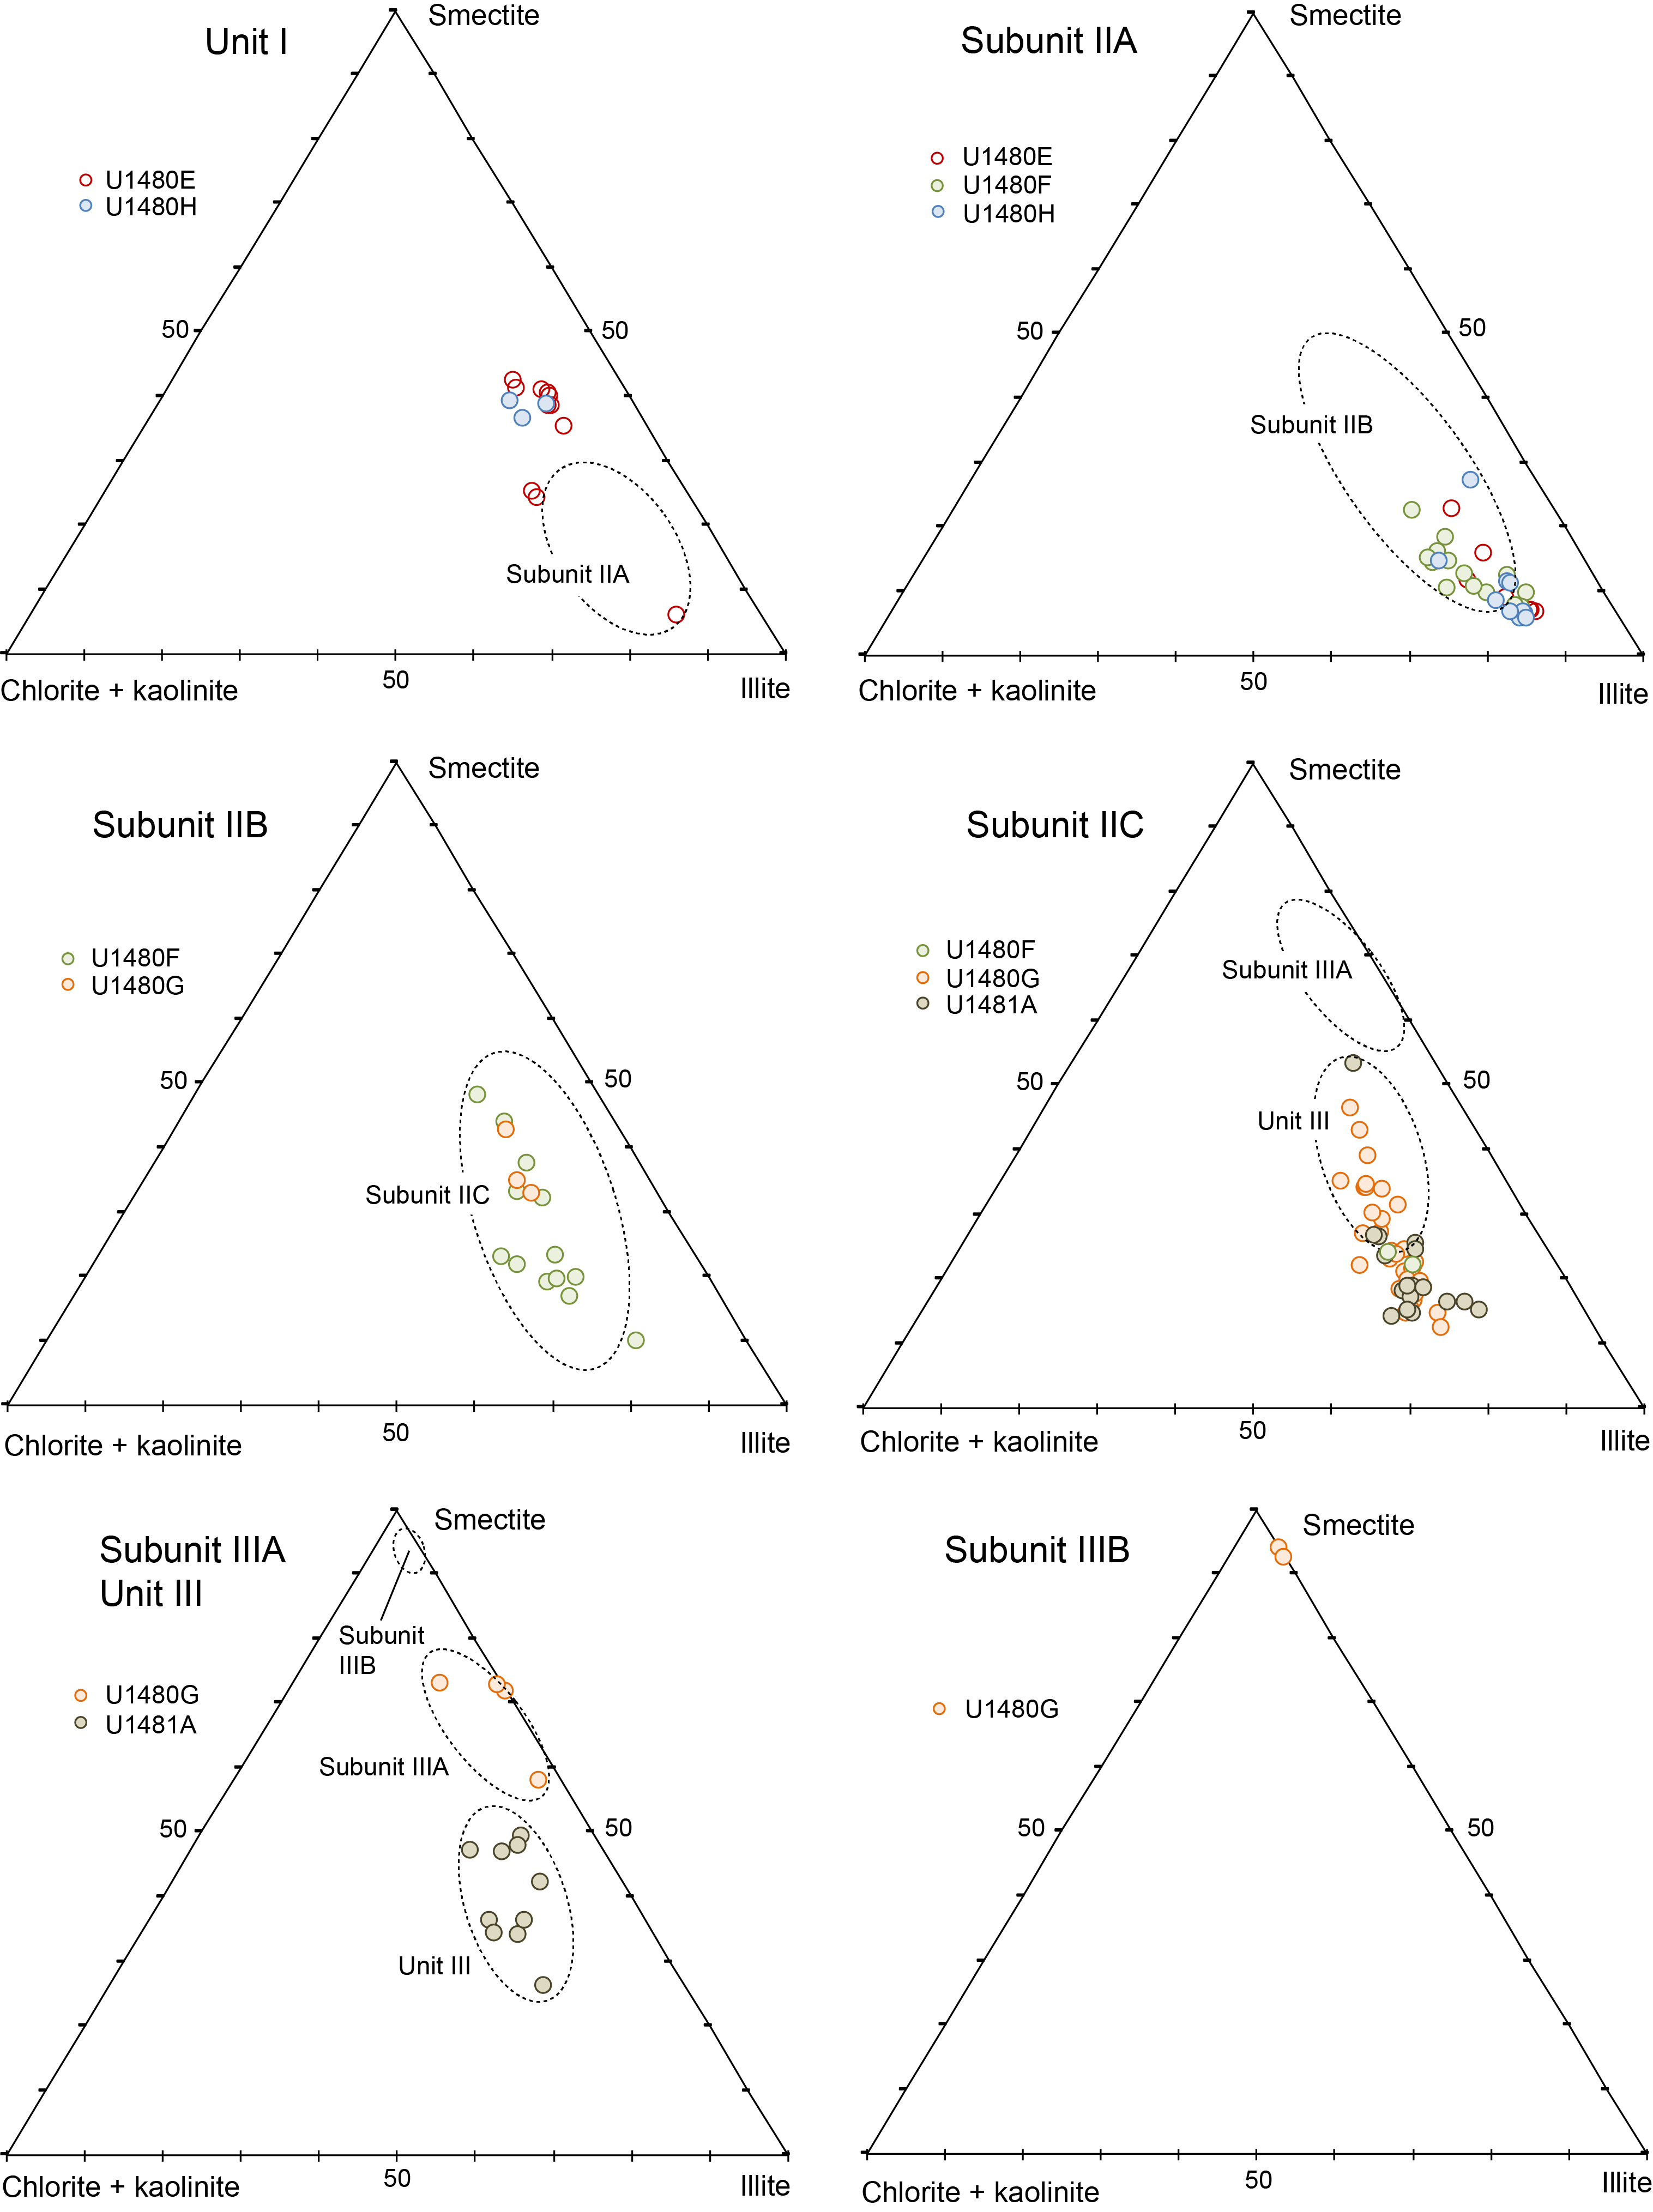
Figure F8. Clay minerals in lithologic units.
Figure F9 shows the mineral proportions plotted as a function of depth at Site U1480. The normalized abundance of smectite in Unit I ranges from 5.2 to 41.0 wt% with a mean value (µ) of 33 wt%. Percentages of illite range from 42.3 to 70.3 wt% (µ = 49 wt%). Undifferentiated chlorite + kaolinite values range from 9.2 to 19.4 wt% (µ = 13 wt%). The percentage of quartz ranges from 1.7 to 15.3 wt% (µ = 5 wt%).
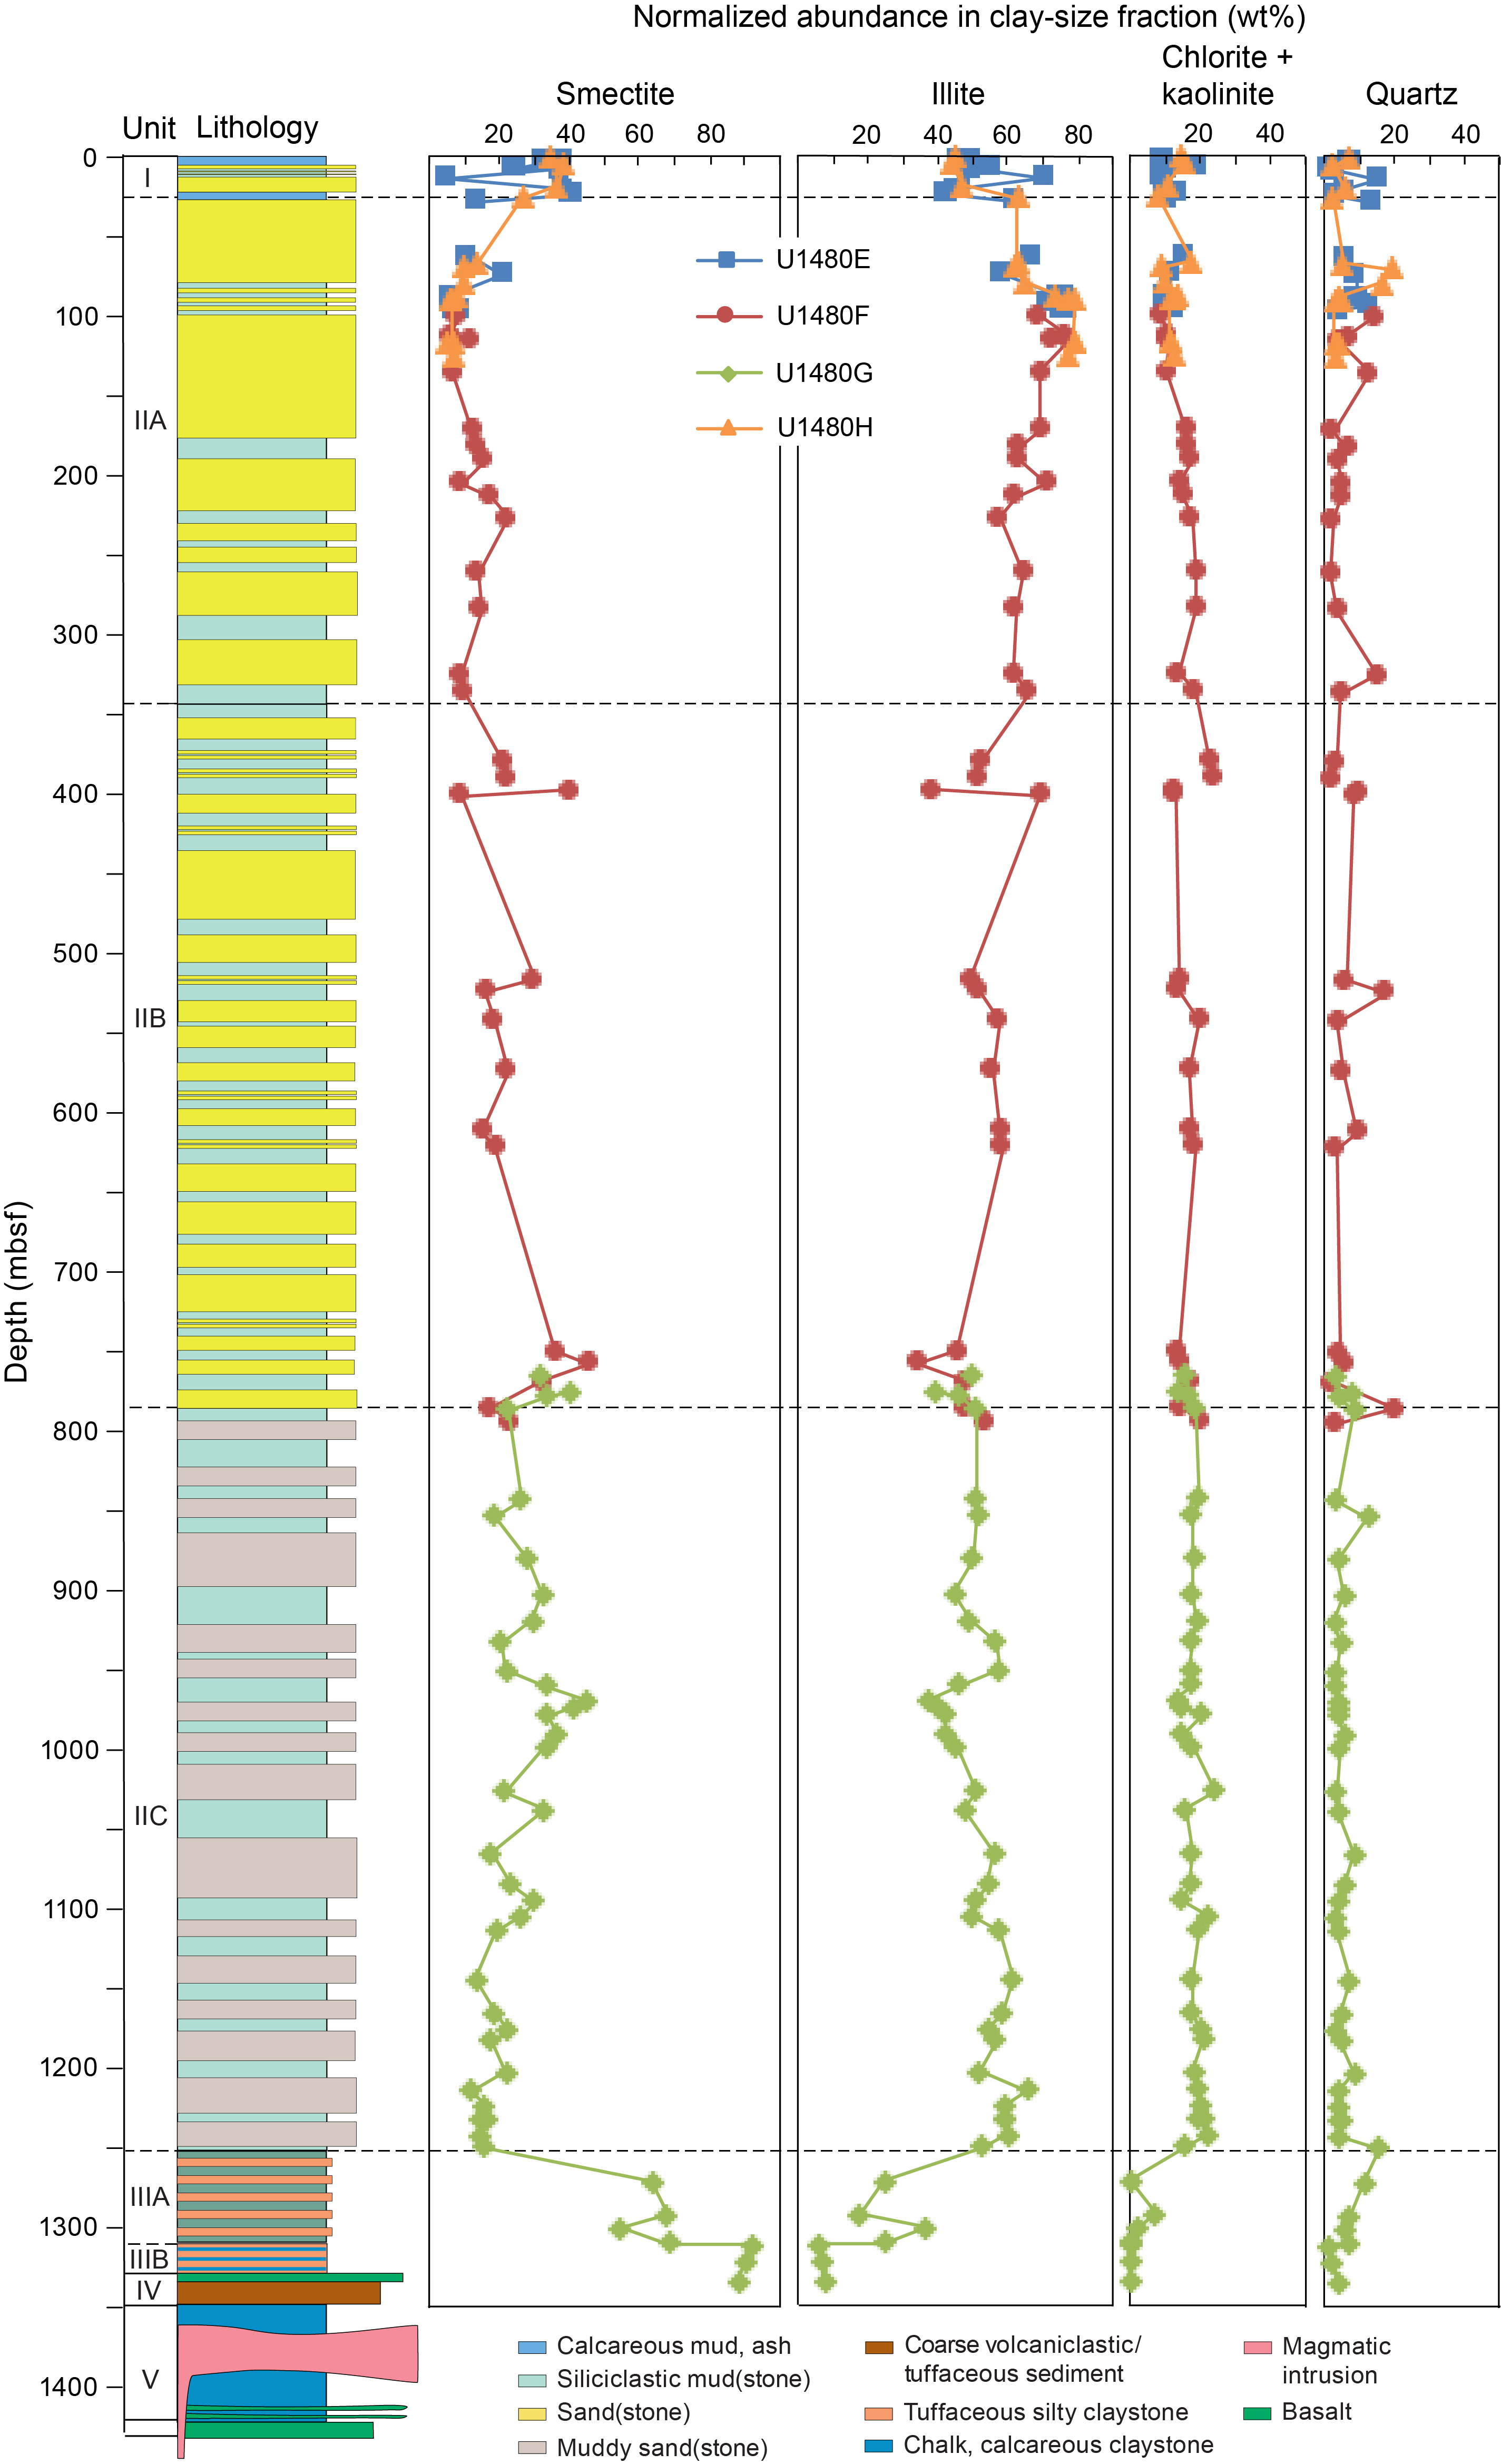
Figure F9. Lithostratigraphy with normalized abundance, Site U1480.
In Lithologic Unit II, the normalized abundance of smectite ranges from 5.6 to 45.5 wt% (µ = 19 wt%). Smectite increases in abundance between Subunits IIA and IIB (~344 mbsf), and the mean increases from 11 to 27 wt%. The percentage of smectite remains consistent through the remainder of the unit. Illite values range from 34.1 to 79 wt% (µ = 59 wt%). At ~344 mbsf, illite decreases from Subunit IIA (µ = 69 wt%) to Subunit IIB (µ = 50 wt%). The weight percent of illite remains unchanged in the remainder of the unit. Chlorite + kaolinite values range from 8.2 to 24.4 wt% (µ = 16 wt%). The mean value for chlorite + kaolinite increases by about 4 wt% between Subunits IIA and IIB. Percentages of quartz range from 1.9 to 17.8 wt% (µ = 6 wt%). Throughout this unit, the percentage of quartz only varies by about 1%, with a mean of ~7 wt% in Subunit IIA and a mean of ~6 wt% in Subunit IIC.
In Lithologic Unit III, smectite values in the clay-size fraction range from 54.5 to 92.4 wt% (µ = 73 wt%). A sharp increase in smectite with increasing depth occurs across the boundary between Units II and III (Figure F9), and the mean increases from 64 wt% in Subunit IIIA to 91 wt% in Subunit IIIB. Percentages of illite range from 5.7 to 36.4 wt% (µ = 19 wt%). Beginning at the boundary between Units II and III, a pronounced decrease in illite occurs with increasing depth (Figure F9). The mean decreases from 26 wt% in Subunit IIIA to 6 wt% in Subunit IIIB. Undifferentiated chlorite + kaolinite values range from 0 to 7.3 wt% (µ = 2 wt%). Below the boundary between Units II and III, the amount of chlorite + kaolinite decreases with increasing depth (Figure F9). The percentage for quartz ranges from 1.8 to 11.6 wt% (µ = 6 wt%). Over Subunit IIIA, there is a gradual decrease in the weight percent of quartz. One sample was analyzed from Lithologic Unit IV; the normalized abundance for smectite is 88.3 wt%, illite is 7.6 wt%, chlorite + kaolinite is 0.4 wt%, and quartz is 3.7 wt%.
At Site U1481 (Figure F10), the values of normalized weight percent for smectite in Lithologic Unit II range from 12.2 to 50.8 wt% (µ = 20 wt%). The percentage for illite ranges from 34.3 to 60.6 wt% (µ = 55 wt%). Chlorite + kaolinite values range from 10 to 24.1 wt% (µ = 18 wt%). Quartz values range from 3.3 to 19.7 wt% (µ = 7 wt%). In Lithologic Unit III, the normalized abundance of smectite ranges from 19.9 to 45.8 wt% (µ = 36 wt%). Illite values range from 33.8 to 49.9 wt% (µ = 41 wt%). Chlorite + kaolinite values range from 8.6 to 18.9 wt% (µ = 14 wt%). The percentages for quartz range from 5.2 to 24.4 wt% with a mean value of 9 wt%.
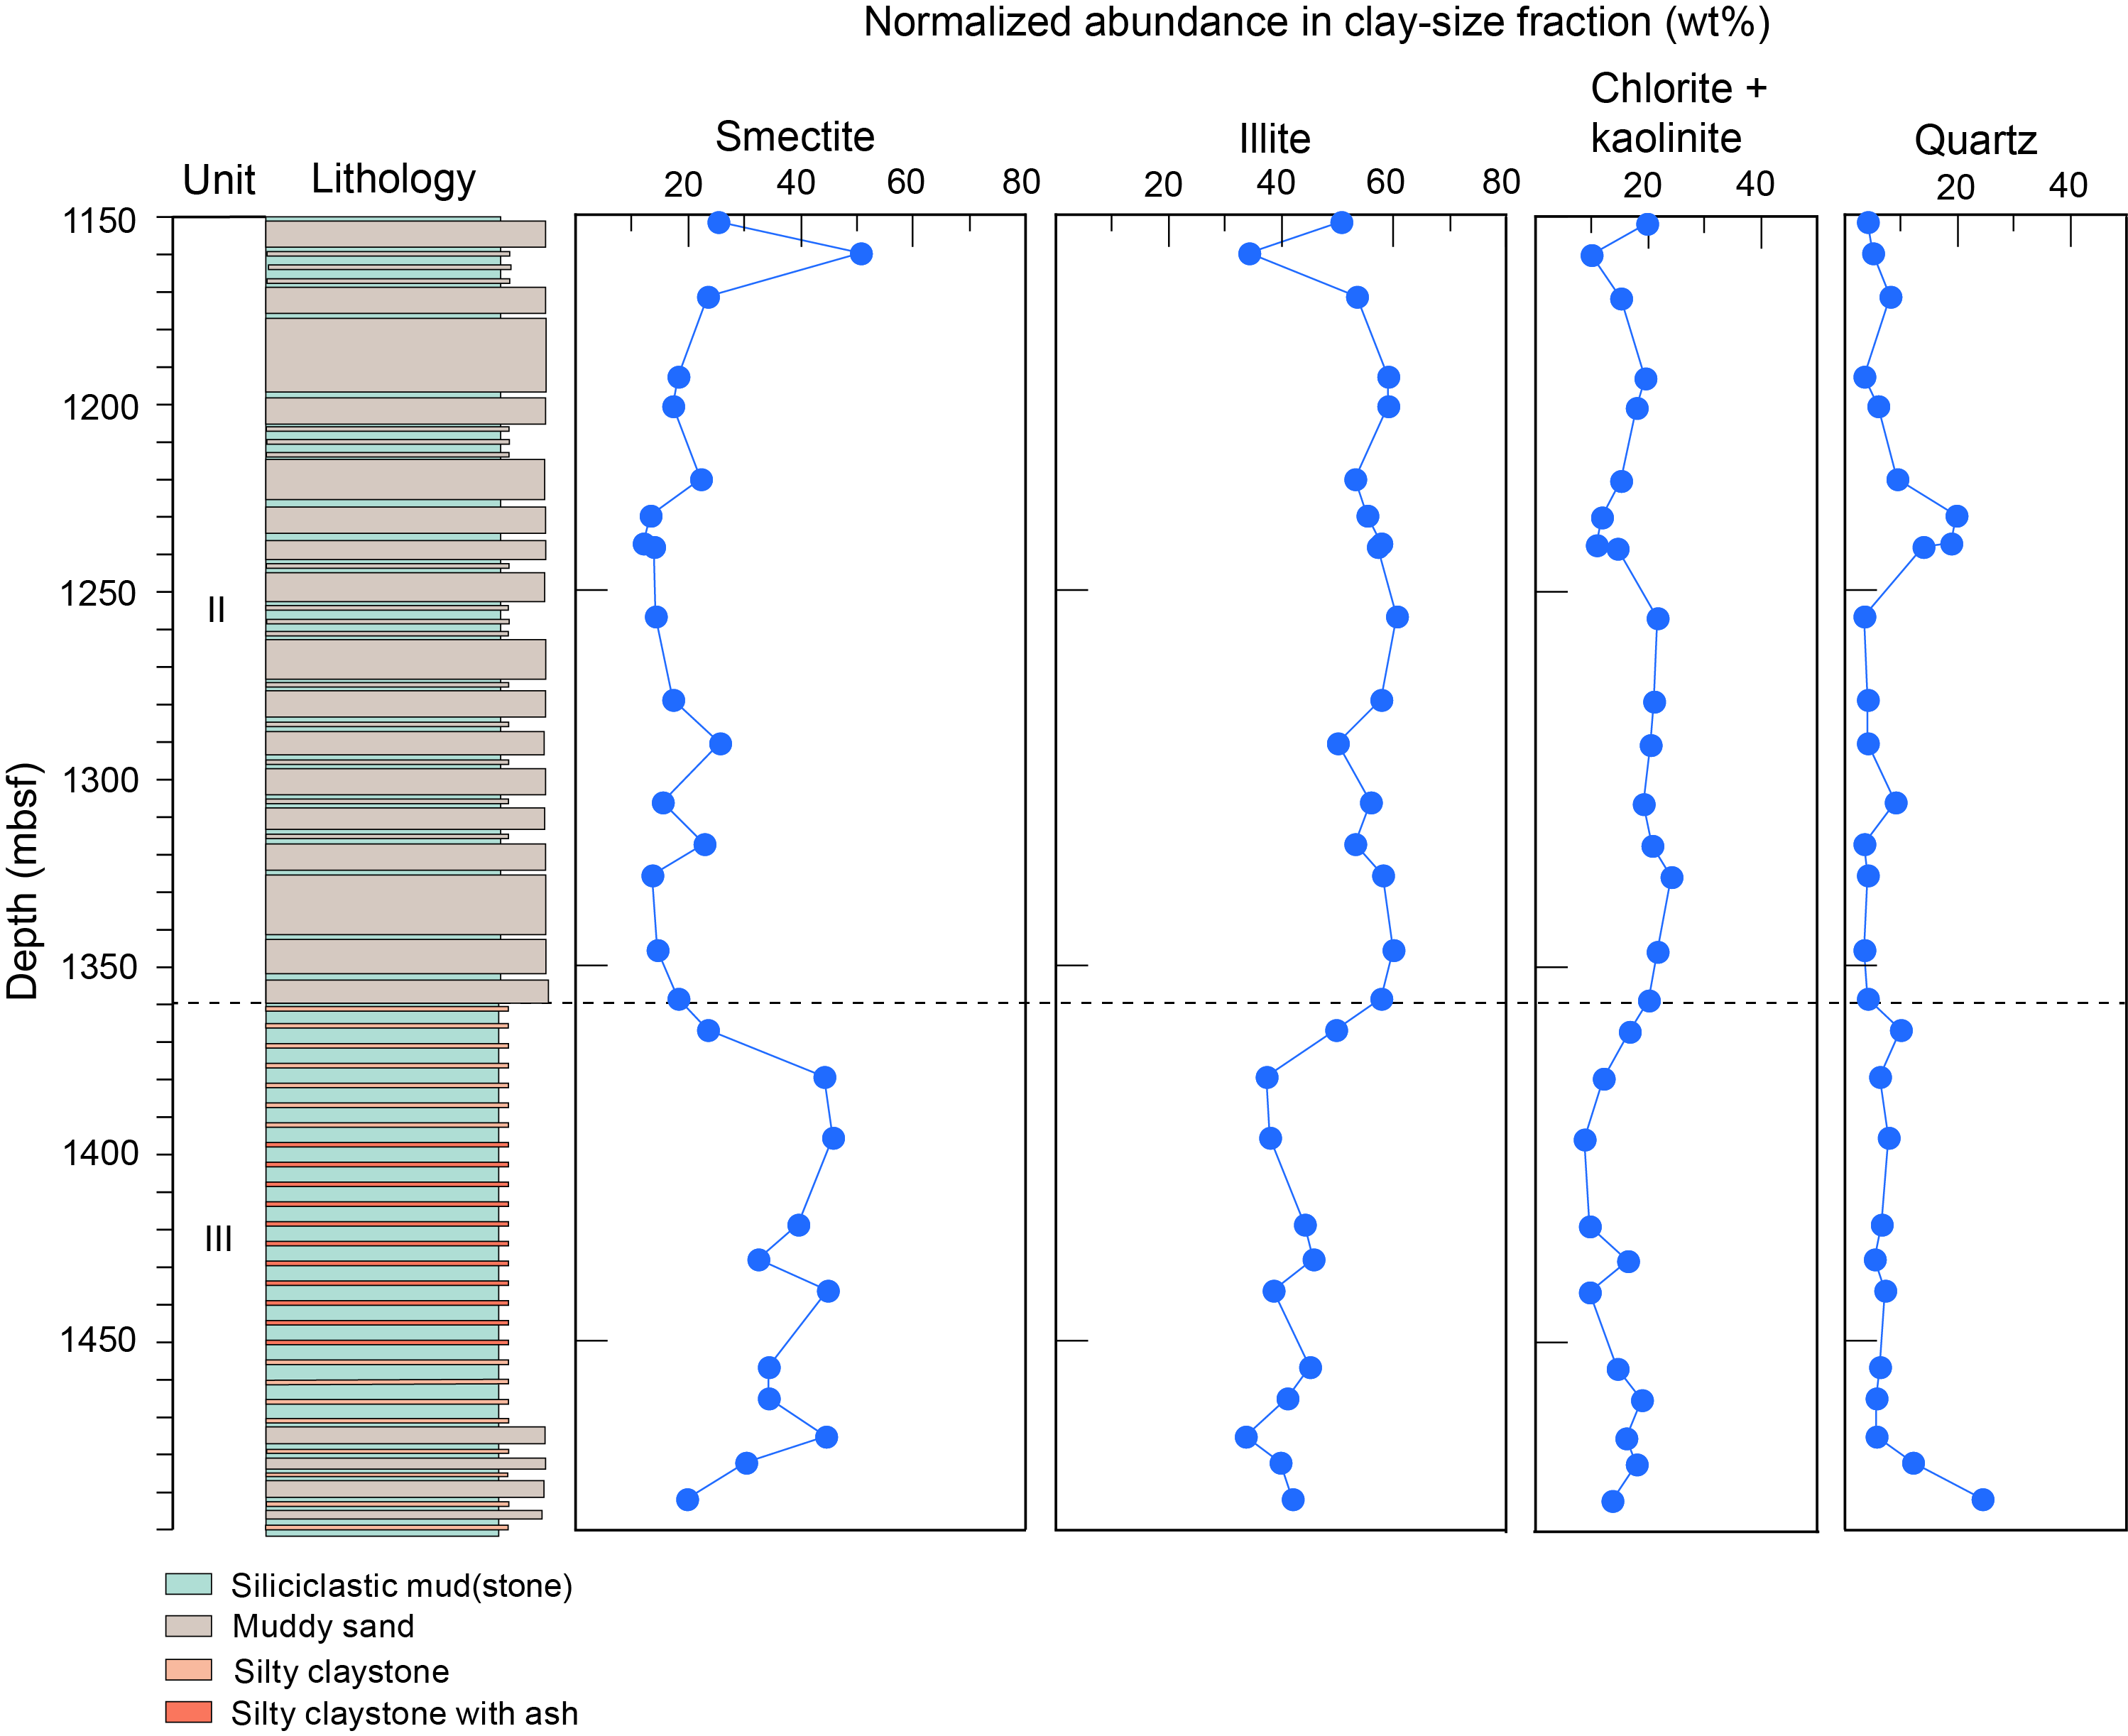
Figure F10. Lithostratigraphy with normalized abundance, Site U1481.
Comparing the composition of Subunit IIC at Site U1480 with the composition of age-correlative Unit II at Site U1481 demonstrates that the mean weight percent values remain relatively uniform. Smectite varies the most, with a mean of 24 wt% at Site U1480 and 20 wt% at Site U1481. In contrast, Subunit IIIA at Site U1480 and age-correlative Unit III at Site U1481 display larger compositional differences. The mean for smectite at Site U1481 is 36 wt%, which is substantially less than the mean of 64 wt% at Site U1480. At Site U1481, the mean for illite is 41 wt%, versus 26 wt% at Site U1480. For chlorite + kaolinite, the mean value is 14 wt% at Site U1481 and 3 wt% at Site U1480. Note that when plotted on a ternary plot of clay mineral abundance (Figure F8), no overlap occurs between Subunit IIIA (Site U1480) and Unit III (Site U1481). Subsequent reappraisal of the lithostratigraphy (Pickering et al., in press) places the basal section of Site U1481 into Unit II rather than Unit III, which is consistent with the clay mineral results.
Table T4 shows the comparison of glycol versus heated results to compute proportions of chlorite and kaolinite in a representative suite of 16 specimens. The proportion of chlorite ranges from 66.6% to 100% (µ = 92%).
Indicators of clay diagenesis
XRD indicators of clay diagenesis are displayed in Tables T5 and T6 and plotted as a function of depth in Figure F11. The expandability of I/S mixed-layer clays in Unit I at Site U1480 ranges from 48.0% to 68.8% with a mean value of 62%. These values increase with depth (Figure F11), and the mean increases significantly to 88% within a cluster of smectite-rich specimens from Unit III. This gradient is opposite to the trend expected with burial diagenesis.
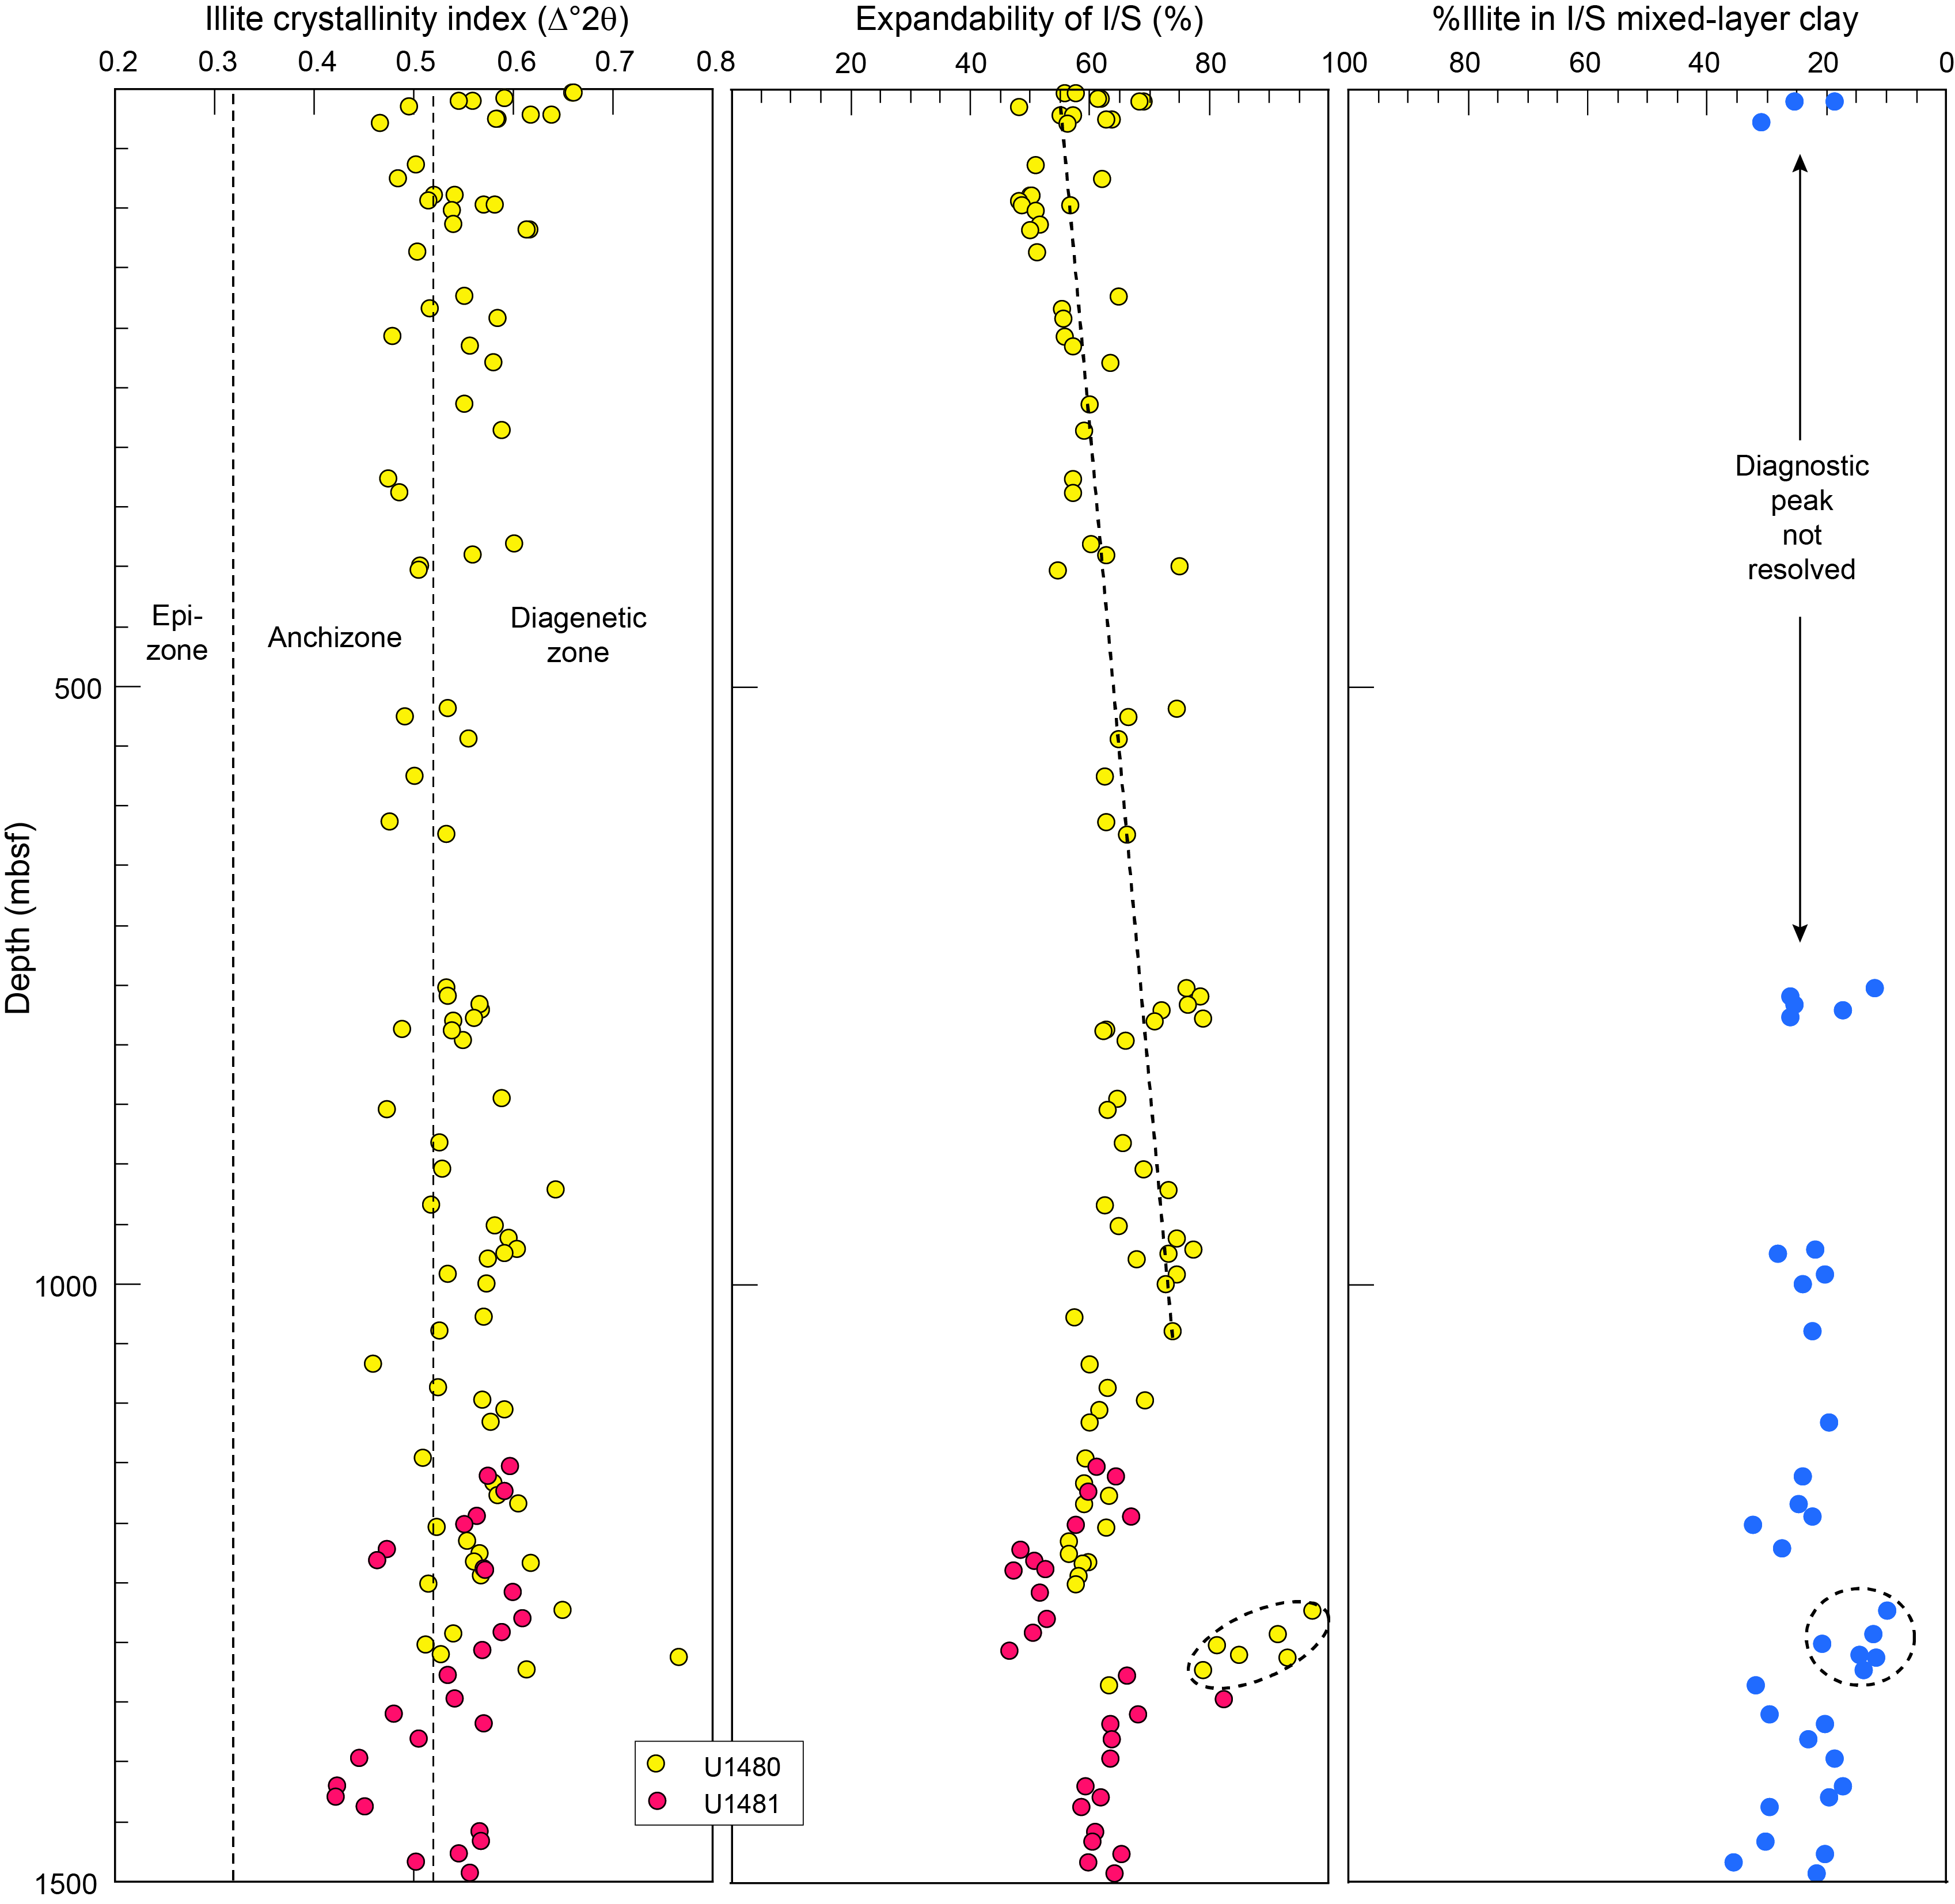
Figure F11. Illite crystallinity index, I/S expandability, and illite abundance.
The illite crystallinity index for Unit I at Site U1480 ranges from 0.50Δ°2θ to 0.66Δ°2θ with a mean value of 0.59Δ°2θ. Using the criteria of Warr and Ferreiro Mählmann (2015) as a generic frame of reference, the boundary between diagenesis and anchimetamorphism coincides with a value of 0.52Δ°2θ (Figure F11). For samples from Unit II, the crystallinity index decreases to a mean value of 0.55Δ°2θ, and values increase to 0.60Δ°2θ in Unit III. Values from both sites reflect geologic conditions in the detrital source areas, not in situ burial conditions, and thus the measured crystallinity index is a weighted average of the total assemblage of detrital illite particles.
At Site U1481, the expandability of I/S mixed-layer clays has a mean of 64% in Unit II, but it increases to 73% in Unit III, likely due to increasing the amount of smectite from authigenic replacement of dispersed ash. The change in illite crystallinity index between the two units is insignificant; the mean value for Unit II is 0.52Δ°2θ, and the mean value for Unit III is 0.53Δ°2θ. Comparing the results from Sites U1480 and U1481, we see small differences between correlative Unit II samples (~1% expandability) and larger variations between correlative Unit III samples (~14% expandability).
Illite-mica polytypes
All samples analyzed contain about half 2M1 mica and the remainder 1M/1Md mica (Table T7). Values range from 46% to 60% 2M1 mica. An error of ±7% is estimated for these results based on the quality of the calculated and observed pattern match and the identification of interfering feldspar (plagioclase), chlorite, and kaolinite reflections measured in the samples. Given that there is no variability in the amount of 2M1 mica within error, there are no depth trends or differences by stratigraphic unit (Figure F12), although the illite-rich samples analyzed are restricted to the trench-wedge section (Unit I) and the Nicobar Fan section (Unit II).
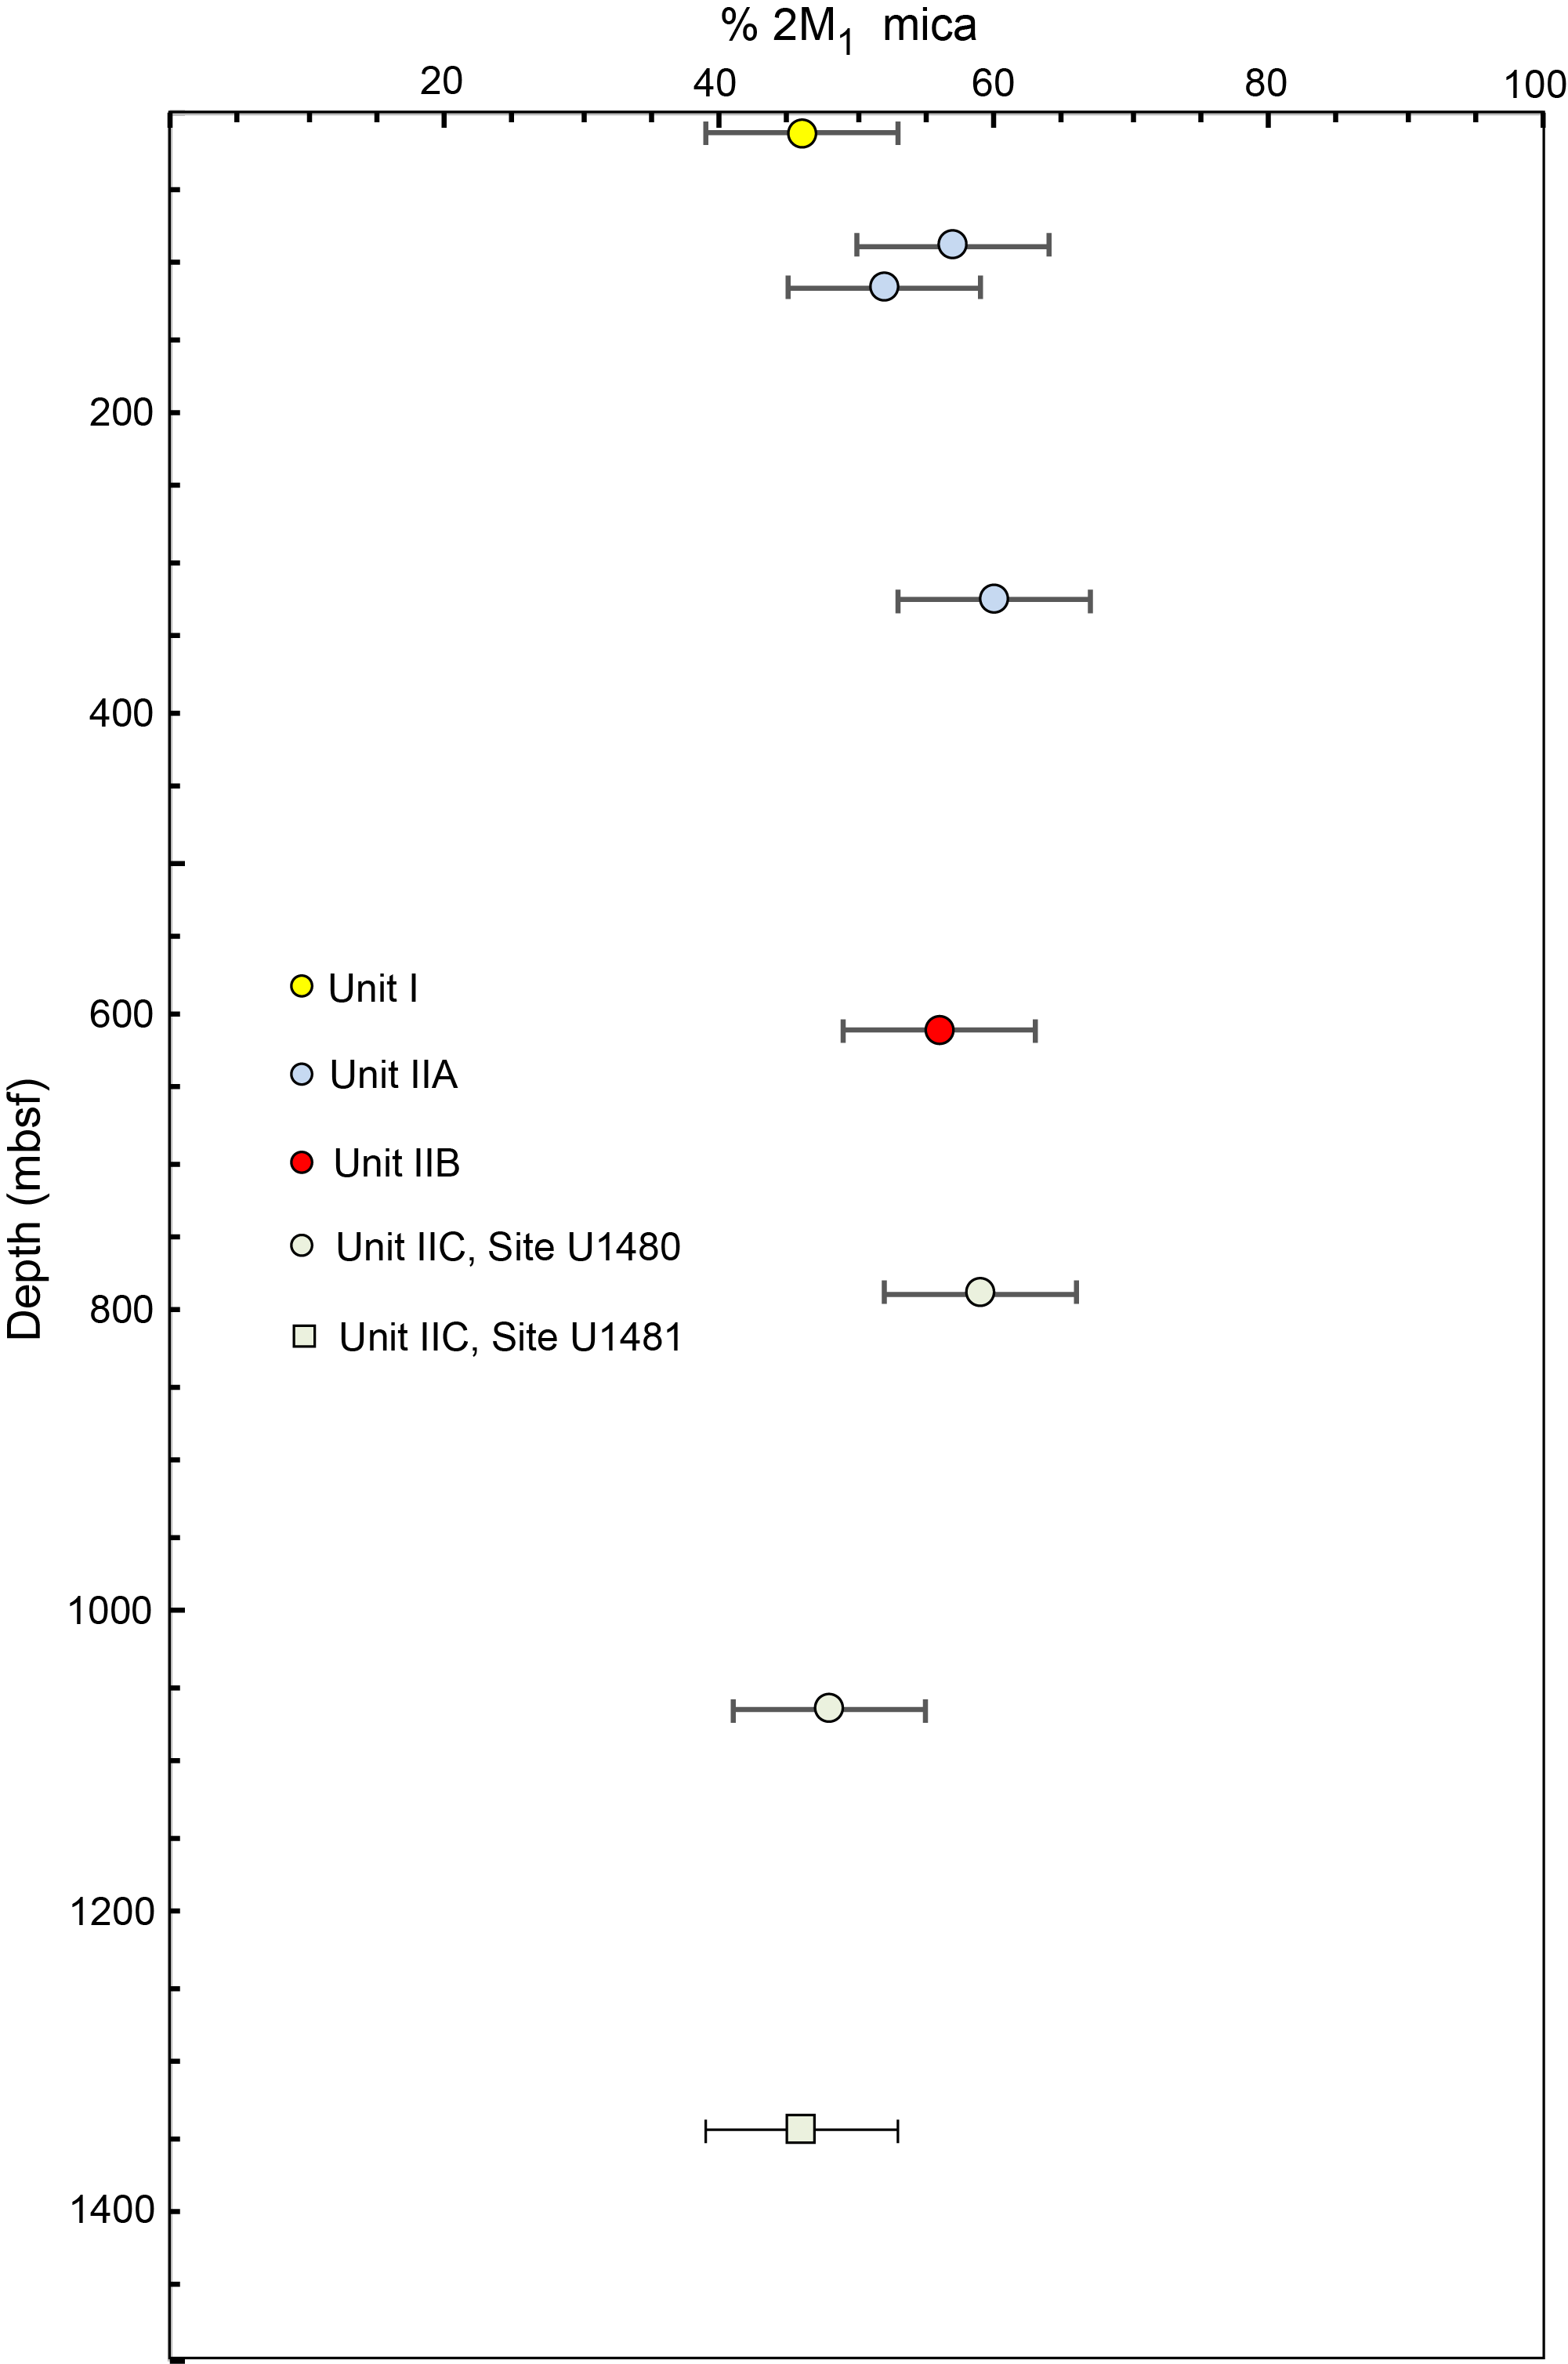
Figure F12. Illite-mica polytypes.
Illite and smectite (060) reflections
The illite (060) reflections from 20 representative specimens yield d-values that range from 1.498 to 1.500 Å (Table T8). The corresponding bo values range from 8.988 to 9.000. Such values are consistent with low phengite contents, and they match results from such low-pressure metamorphic terrains as Bosost, Andes, and New Hampshire (Figure F13), as documented by Sassi and Scolari (1974) and Padan et al. (1982). The smectite (060) reflections from 15 representative specimens yield peak apex positions of 61.998°–61.700°2θ, or d-values of 1.497–1.503 Å (Table T9). Following the criteria of Brindley (1980), all of the smectite-rich samples are composed primarily of montmorillonite (Figure F13).
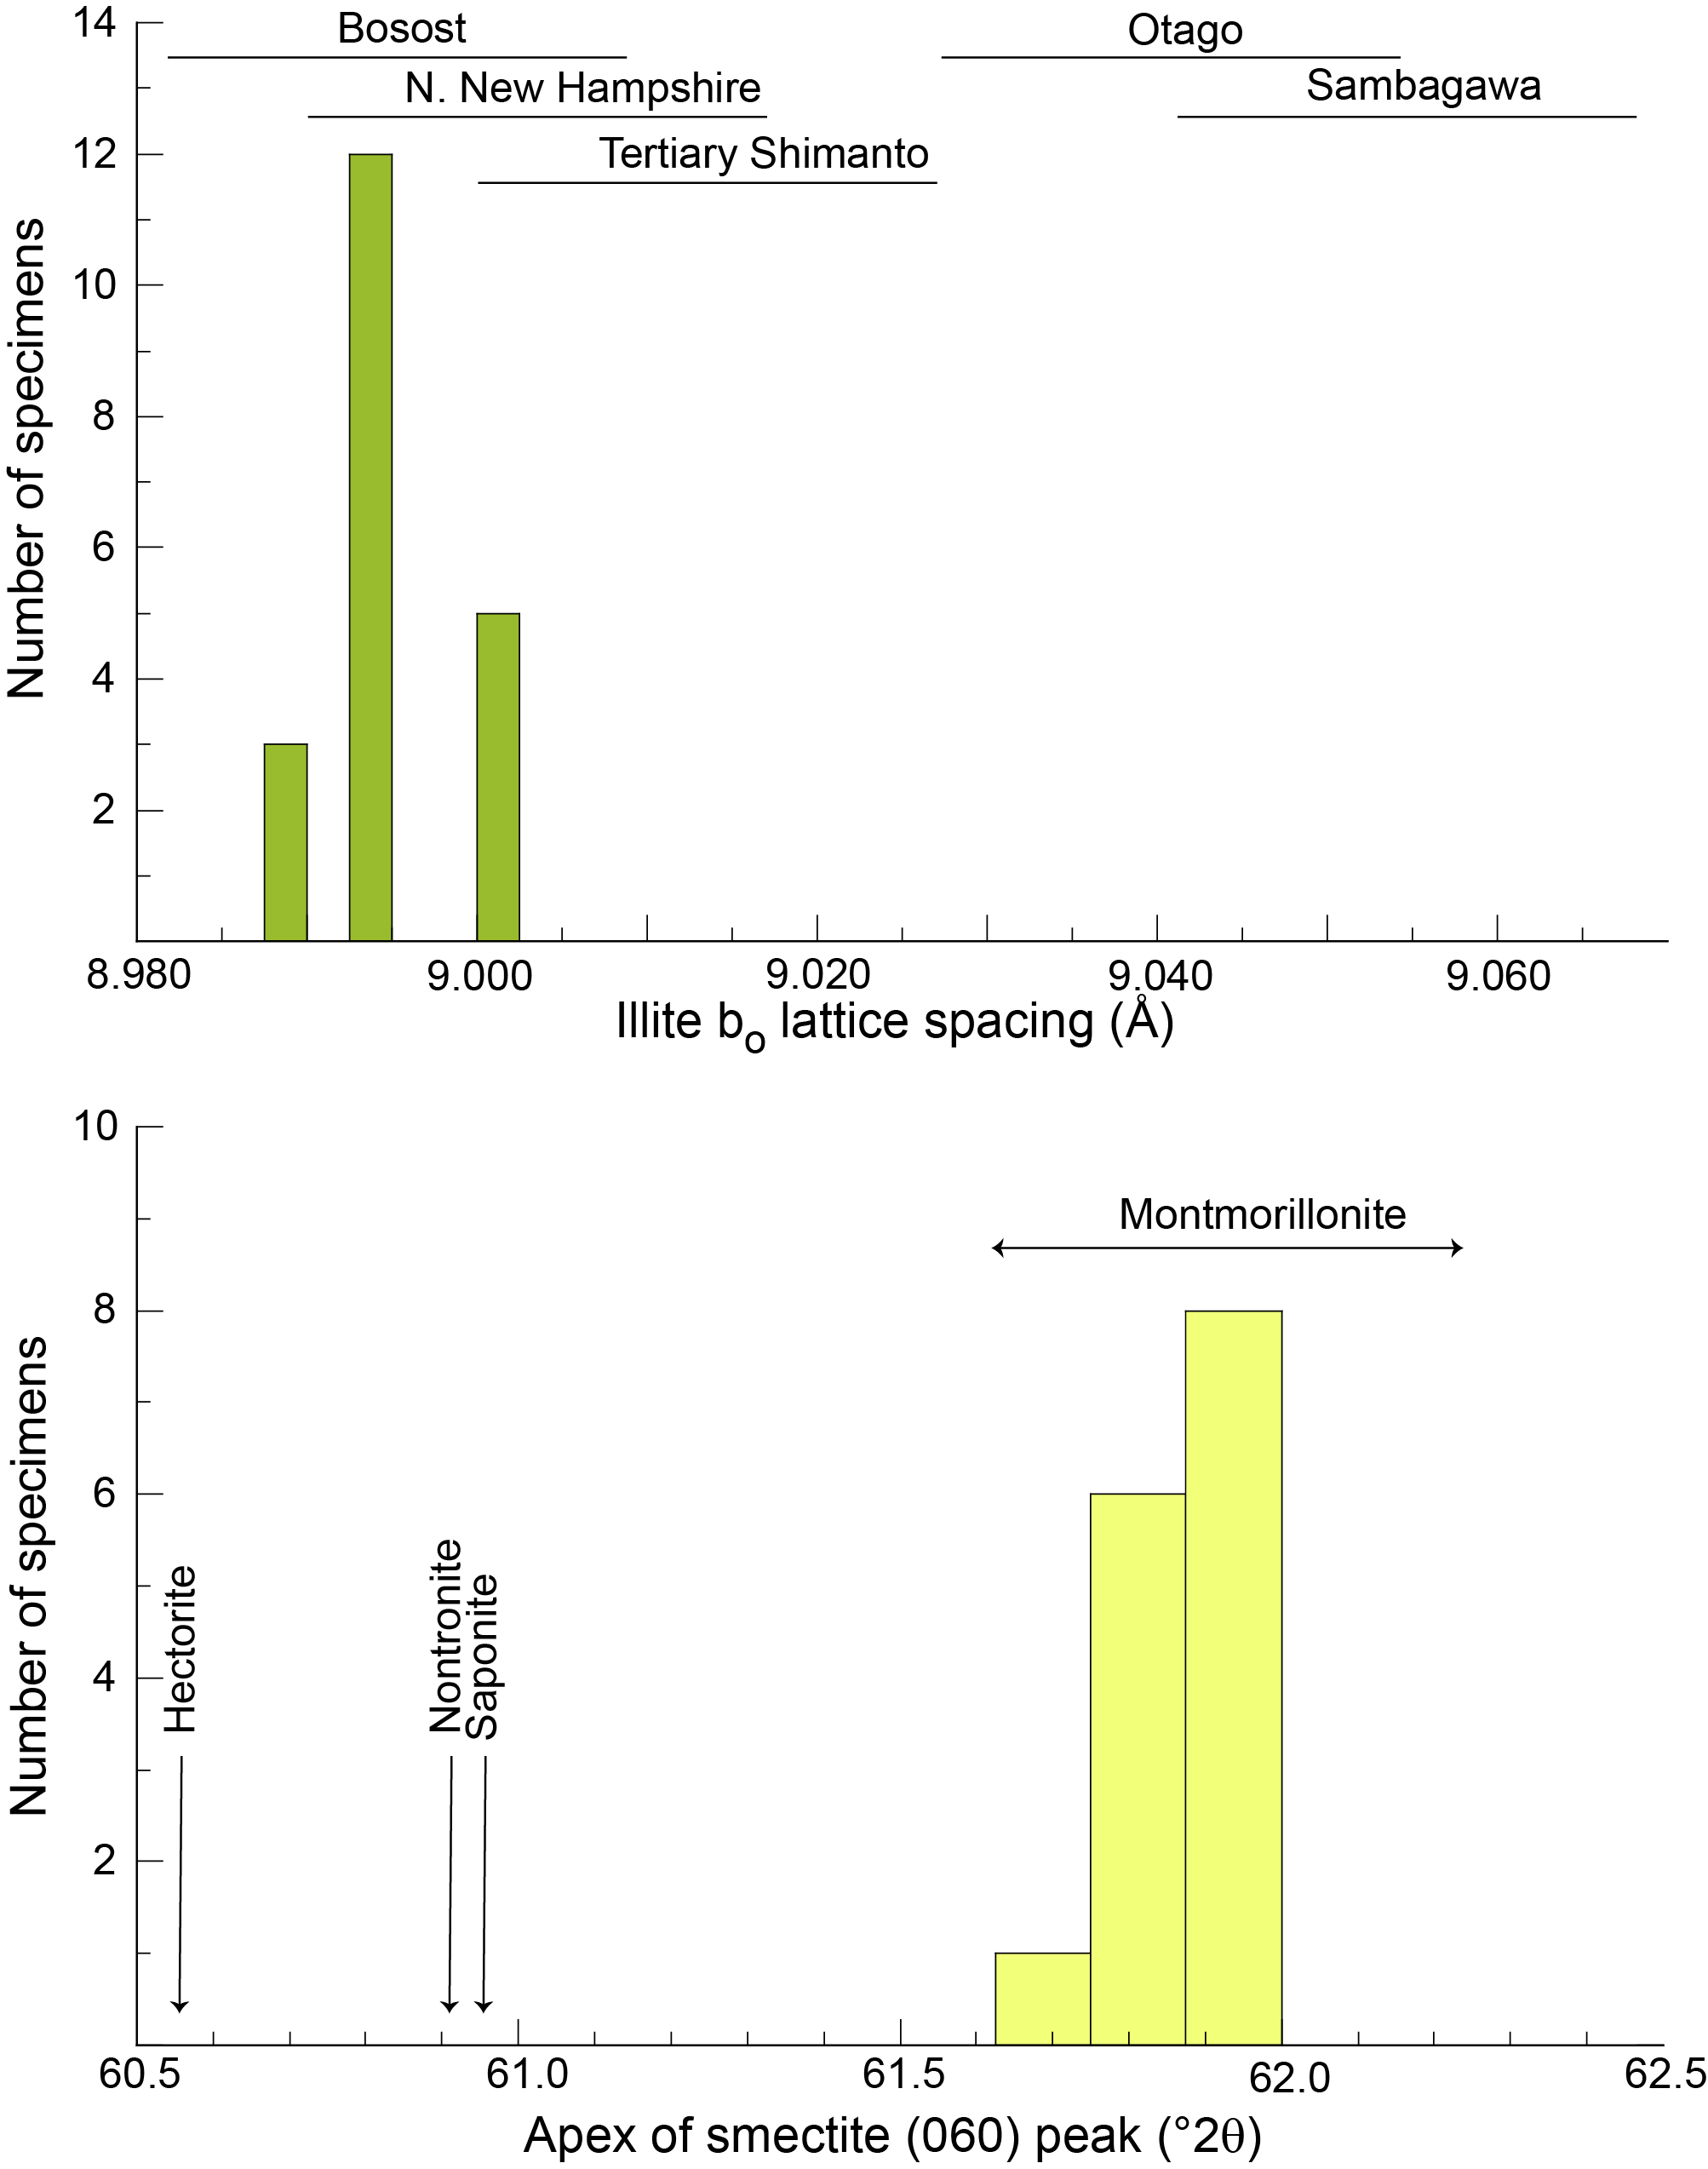
Figure F13. Illite bo lattice spacing and apex of smectite (060) peak.
Conclusions
XRD scans of the clay-size fraction from hemipelagic specimens at Site U1480 show that the relative abundance of smectite in clay mineral assemblages decreases from a mean value of 33 wt% in Unit I to a mean of 19 wt% in Unit II; values increase sharply to a mean of 73 wt% in Unit III. Compositional variations among subunits are small. The average proportion of illite is 49 wt% in Unit I, 59% in Unit II, and 19 wt% in Unit III. Undifferentiated chlorite + kaolinite varies from a mean value of 13 wt% in Unit I to a mean of 2 wt% in Unit III. Heating tests show that chlorite dominates over kaolinite with an average proportion of 92%.
At Site U1481, the average content of smectite is 20 wt% in Unit II and 36 wt% in Unit III. The mean value for illite is 55 wt% in Unit II and 41 wt% in Unit III, whereas changes in chlorite + kaolinite content are relatively insignificant. The contrasts in composition between correlative units at Sites U1480 and U1481 are substantial.
The expandability of I/S mixed-layer clays increases with depth at Site U1480, which is opposite to the trend expected with burial diagenesis. Values increase to 88% in smectite-rich mudstones from Unit III. The illite crystallinity index has a mean value of 0.59Δ°2θ in Unit I, decreases to a mean of 0.55Δ°2θ in Unit II, and increases to a mean of 0.60Δ°2θ in Unit III; all values are consistent with generic conditions of advanced diagenesis in detrital source terrains. For samples from Site U1481, the expandability of I/S mixed-layer clays increases from a mean of 64% in Unit II to a mean of 73% in Unit III. Changes in the illite crystallinity index are statistically insignificant; the mean values for Units II and III are 0.52Δ°2θ and 0.53Δ°2θ, respectively, straddling the generic boundary between advanced diagenesis and anchimetamorphism. The d-values for the illite (060) lattice yield bo values of 8.988–9.000 Å, which are consistent with low phengite contents and low-pressure conditions in metamorphic source terrains. The smectite (060) reflections are consistent with montmorillonite as the dominant expandable clay.
Acknowledgments
This research used samples provided by the International Ocean Discovery Program (IODP). We thank the drilling crew, laboratory technicians, and scientists aboard the R/V JOIDES Resolution for their dedicated assistance with sampling during IODP Expedition 362. Funding to Vrolijk was granted by the U.S. Science Support Program. Kelsey McNamara assisted with XRD analyses at the New Mexico Bureau of Geology and Mineral Resources. This research was supported by the Earth Observatory of Singapore, the National Research Foundation Singapore, and the Singapore Ministry of Education under the Research Centres of Excellence initiative.
References
Biscaye, P.E., 1965. Mineralogy and sedimentation of recent deep-sea clay in the Atlantic Ocean and adjacent seas and oceans. Geological Society of America Bulletin, 76(7):803–831. https://doi.org/10.1130/0016-7606(1965)76[803:MASORD]2.0.CO;2
Brindley, G.W., 1980. Order-disorder in clay mineral structures. In Brindley, G.W., and Brown, G. (Eds.), Crystal Structures of Clay Minerals and Their X-Ray Identification. Mineralogical Society Monograph, 5:125–195. https://doi.org/10.1180/mono-5.2
Fisher, A.T., and Underwood, M.B., 1995. Calibration of an X-ray diffraction method to determine relative mineral abundances in bulk powders using matrix singular value decomposition: a test from the Barbados accretionary complex. In Shipley, T.H., Ogawa, Y., Blum, P., et al., Proceedings of the Ocean Drilling Program, Initial Reports, 156: College Station, TX (Ocean Drilling Program), 29–37. https://doi.org/10.2973/odp.proc.ir.156.103.1995
Frey, M., Hunziker, J.C., Jäger, E., and Stern, W.B., 1983. Regional distribution of white K-mica polymorphs and their phengite content in the Central Alps. Contributions to Mineralogy and Petrology, 83:185–197. https://doi.org/10.1007/BF00373092
Geersen, J., McNeill, L., Henstock, T.J., and Gaedicke, C., 2013. The 2004 Aceh-Andaman earthquake: early clay dehydration controls shallow seismic rupture. Geochemistry, Geophysics, Geosystems, 14(9):3315–3323. https://doi.org/10.1002/ggge.20193
Gingele, F.X., De Deckker, P., and Hillenbrand, C.-D., 2001. Clay mineral distribution in surface sediment between Indonesia and NW Australia—source and transport by ocean currents. Marine Geology, 179(3–4):135–146. https://doi.org/10.1016/S0025-3227(01)00194-3
Haines, S.H., and van der Pluijm, B.A, 2008. Clay quantification and Ar–Ar dating of synthetic and natural gouge: application to the Miocene Sierra Mazatán detachment fault, Sonora, Mexico. Journal of Structural Geology, 30(4):525–538. https://doi.org/10.1016/j.jsg.2007.11.012
Haines, S.H., and van der Pluijm, B.A, 2010. Dating the detachment fault system of the Ruby Mountains, Nevada: significance for the kinematics of low-angle normal faults. Tectonics, 29(4):TC4028. https://doi.org/10.1029/2009TC002552
Hillier, S., 2000. Accurate quantitative analysis of clay and other minerals in sandstones by XRD: comparison of a Rietveld and a reference intensity ratio (RIR) method and the importance of sample preparation. Clay Minerals, 35(1):291–302. https://doi.org/10.1180/000985500546666
Hüpers, A., Torres, M.E., Owari, S., McNeill, L.C., Dugan, B., Henstock, T.J., Milliken, K.L., et al., 2017. Release of mineral-bound water prior to subduction tied to shallow seismogenic slip off Sumatra. Science, 356(6340):841–844. https://doi.org/10.1126/science.aal3429
Kübler, B., and Jaboyedoff, M., 2000. Illite crystallinity. Comptes Rendus de l'Académie des Sciences - Series IIA - Earth and Planetary Science, 331(2):75–89. https://doi.org/10.1016/S1251-8050(00)01395-1
McNeill, L.C., Dugan, B., Backman, J., Pickering, K.T., Pouderoux, H.F.A., Henstock, T.J., Petronotis, K.E., et al., 2017a. Understanding Himalayan erosion and the significance of the Nicobar Fan. Earth and Planetary Science Letters, 475:134–142. https://doi.org/10.1016/j.epsl.2017.07.019
McNeill, L.C., Dugan, B., Petronotis, K.E., Backman, J., Bourlange, S., Chemale, F., Chen, W., Colson, T.A., Frederik, M.C.G., Guèrin, G., Hamahashi, M., Henstock, T., House, B.M., Hüpers, A., Jeppson, T.N., Kachovich, S., Kenigsberg, A.R., Kuranaga, M., Kutterolf, S., Milliken, K.L., Mitchison, F.L., Mukoyoshi, H., Nair, N., Owari, S., Pickering, K.T., Pouderoux, H.F.A., Yehua, S., Song, I., Torres, M.E., Vannucchi, P., Vrolijk, P.J., Yang, T., and Zhao, X., 2017b. Expedition 362 summary. In McNeill, L.C., Dugan, B., Petronotis, K.E., and the Expedition 362 Scientists, Sumatra Subduction Zone. Proceedings of the International Ocean Discovery Program, 362: College Station, TX (International Ocean Discovery Program). https://doi.org/10.14379/iodp.proc.362.101.2017
Moore, D.M., and Reynolds, R.C., Jr., 1989a. Identification of mixed-layered clay minerals. In Moore, D.M., and Reynolds, R.C., Jr. (Eds.), X-Ray Diffraction and the Identification and Analysis of Clay Minerals: New York (Oxford University Press USA), 241–271.
Moore, D.M., and Reynolds, R.C., Jr., 1989b. Sample preparation techniques for clay minerals. In Moore, D.M., and Reynolds, R.C., Jr. (Eds.), X-Ray Diffraction and the Identification and Analysis of Clay Minerals: New York (Oxford University Press), 179–201.
Padan, A., Kisch, H.J., and Shagam, R., 1982. Use of the lattice parameter bo of dioctahedral illite/muscovite for the characterization of P/T gradients of incipient metamorphism. Contributions to Mineralogy and Petrology, 79:85–95. https://doi.org/10.1007/BF00376965
Paudel, L.P., and Arita, K., 2006. The b-spacing values of white micas and their metamorphic implications in the Lesser Himalaya, central Nepal. Journal of Asian Earth Sciences, 27(1):10–24. https://doi.org/10.1016/j.jseaes.2005.01.008
Petschick, R., Kuhn, G., and Gingele, F., 1996. Clay mineral distribution in surface sediments of the South Atlantic: sources, transport, and relation to oceanography. Marine Geology, 130(3–4):203–229. https://doi.org/10.1016/0025-3227(95)00148-4
Phillips, S.C., Johnson, J.E., Underwood, M.B., Guo, J., Giosan, L., and Rose, K., 2014. Long-timescale variation in bulk and clay mineral composition of Indian continental margin sediments in the Bay of Bengal, Arabian Sea, and Andaman Sea. Marine and Petroleum Geology, 58(Part A):117–138. https://doi.org/10.1016/j.marpetgeo.2014.06.018
Pickering, K.T., Pouderoux, H., McNeill, L.C., Backman, J., Chemale, F., Kutterolf, S., Milliken, K.L., et al., in press. Sedimentology, stratigraphy and architecture of the Nicobar Fan (Bengal–Nicobar Fan System), Indian Ocean: results from International Ocean Discovery Program Expedition 362. Sedimentology. https://doi.org/10.1111/sed.12701
Rettke, R.C., 1981. Probable burial diagenetic and provenance effects on Dakota Group clay mineralogy, Denver Basin. Journal of Sedimentary Research, 51(2):541–551. https://doi.org/10.1306/212F7CCF-2B24-11D7-8648000102C1865D
Reynolds, R.C., 1993. Wildfire©: A Computer Program for the Calculation of Three-dimensional Powder X-ray Diffraction Patterns for Mica Polytypes and Their Disordered Variations: Hanover, NH (Robert C. Reynolds).
Robinson, D., Warr, L.N., and Bevins, R.E., 1990. The illite 'crystallinity' technique: a critical appraisal of its precision. Journal of Metamorphic Geology, 8(3):333–344. https://doi.org/10.1111/j.1525-1314.1990.tb00476.x
Sassi, F.P., and Scolari, A., 1974. The bo value of the potassic white micas as a barometric indicator in low-grade metamorphism of pelitic schists. Contributions to Mineralogy and Petrology, 45:143–152. https://doi.org/10.1007/BF00371166
Srodon, J., and Eberl, D.D., 1984. Illite. In Bailey, S. (Ed.), Reviews in Mineralogy (Volume 13): Micas: Chantilly, VA (Mineralogical Society of America), 495–544.
Thiry, M., 2000. Palaeoclimatic interpretation of clay minerals in marine deposits: an outlook from the continental origin. Earth-Science Reviews, 49(1–4):201–221. https://doi.org/10.1016/S0012-8252(99)00054-9
Underwood, M.B., Laughland, M.M., and Kang, S.M., 1993. A comparison among organic and inorganic indicators of diagenesis and low-temperature metamorphism, Tertiary Shimanto Belt, Shikoku, Japan. In Underwood, M.B. (Ed.), Thermal Evolution of the Tertiary Shimanto Belt, Southwest Japan: An Example of Ridge-Trench Interaction. Special Paper - Geological Society of America, 273:45–61. https://doi.org/10.1130/SPE273-p45
Underwood, M.B., Lawler, N., and McNamara, K., 2020. Data report: standard mineral mixtures, normalization factors, and determination of error for quantitative X-ray diffraction analyses of bulk powders and clay-sized mineral assemblages. In Wallace, L.M., Saffer, D.M., Barnes, P.M., Pecher, I.A., Petronotis, K.E., LeVay, L.J., and the Expedition 372/375 Scientists, Hikurangi Subduction Margin Coring and Observatories. Proceedings of the International Ocean Discovery Program, 372B/375: College Station, TX (International Ocean Discovery Program). https://doi.org/10.14379/iodp.proc.372B375.201.2020
Velde, B., 1965. Experimental determination of muscovite polymorph stabilities. American Mineralogist, 50(3–4):436–449.
Warr, L.N., and Ferreiro Mählmann, R.F., 2015. Recommendations for Kübler Index standardization. Clay Minerals, 50(3):283–286. https://doi.org/10.1180/claymin.2015.050.3.02
1 Rosenberger, K., Underwood, M.B., Vrolijk, P., and Haines, S., 2020. Data report: clay mineral assemblages in hemipelagic sediments entering the Sumatra subduction zone, IODP Sites U1480 and U1481, Expedition 362. In McNeill, L.C., Dugan, B., Petronotis, K.E., and the Expedition 362 Scientists. Sumatra Subduction Zone. Proceedings of the International Ocean Discovery Program, 362: College Station, TX (International Ocean Discovery Program). https://doi.org/10.14379/iodp.proc.362.204.2020
2 Department of Earth and Environmental Science, New Mexico Institute of Mining and Technology, USA. Correspondence author: dimeguru@gmail.com
3 Nanyang Technological University, Singapore.
This work is distributed under the Creative Commons Attribution 4.0 International (CC BY 4.0) license. 