Morgan, J., Gulick, S., Mellett, C.L., Green, S.L., and the Expedition 364 Scientists
Proceedings of the International Ocean Discovery Program Volume 364
publications.iodp.org

https://doi.org/10.14379/iodp.proc.364.201.2020
Data report: orientation correction of Chicxulub core recovered from IODP/ICDP Expedition 3641
Naoma McCall,2 Sean Gulick,2 Brendon Hall,3 Johanna Lofi,4 and Michael Poelchau5
Keywords: International Ocean Discovery Program, IODP, International Continental Scientific Drilling Program, ICDP, L/B Myrtle, Mission Specific Platform, Expedition 364, Chicxulub: Drilling the K-Pg Impact Crater, Site M0077, Gulf of México, Yucatán shelf, Chicxulub, core orientation
MS 364-201: Received 9 August 2019 · Accepted 19 February 2020 · Published 30 April 2020
Abstract
During International Ocean Discovery Program (IODP)/International Continental Drilling Project (ICDP) Expedition 364, the peak ring of the Chicxulub impact crater was drilled in April–May 2016. The expedition recovered 829 m of core, from 505.7 to 1334.7 meters below seafloor (mbsf). Because the geographic in situ orientation of the core is not preserved during the drilling process, we report orientation corrections for all core sections. Angular correction values were determined by comparing and matching fractures and lithologic contacts between computed tomography scans of the cores and downhole acoustic borehole images as well as comparing fractures and contacts from one core section to another. The orientation correction values can be used to reorient cores to true geographic north, enabling proper assessment of directionality for structural deformation, paleomagnetic indicators, and sedimentary transport data with the Expedition 364 cores.
Introduction
During International Ocean Discovery Program (IODP)/International Continental Drilling Project (ICDP) Expedition 364, the Chicxulub impact crater’s peak ring was drilled with nearly 100% core recovery (Gulick et al., 2017b). This drilling is the first time that an unequivocal peak ring of any impact crater has been drilled and is a valuable opportunity to study impact crater formation (Morgan et al., 2016; Riller et al., 2018). Chicxulub has also been conclusively linked to the Cretaceous/Paleocene mass extinction (Schulte et al., 2010), and thus these cores are key to examining causes of extinction and recovery of life with the newly formed crater (Gulick et al., 2019; Lowery et al., 2018). Core rotation and misalignment occurs during the drilling process as well as after recovery while moving or handling the core. To properly assess fault geometries and deformation kinematics, the in situ orientation of the core relative to the borehole wall and thus relative to north needs to be restored. Similarly, paleomagnetic data should be placed into context and other potential directional indicators such as sediment transport require knowing true orientations (Nelson et al., 1987; Hailwood and Ding, 2000; Paulsen et al., 2002).
Drilling took place from 5 April to 30 May 2016 aboard the liftboat L/B Myrtle, which utilized the ICDP Atlas Copco T3WDH mining rig. The drill site included a single hole, Hole M0077A, located at 21°26.996ʹN, 89°56.968ʹW, ~45 km northwest of the crater center. Coring started at 505.7 meters below seafloor (mbsf) and ended at 1334.7 mbsf with a total of 829.51 m of core and recovery near 100%. To remain consistent with existing nomenclature, we use the term “core run” for the initial divisions of core during coring and the term “section” to indicate a subdivision of a core run. Coring produced 303 sequential core runs with a maximum length of 3.1 m. Each core run was divided into sections as long as 1.5 m. Sectioning usually occurred at areas of natural breakage in the core (Gulick et al., 2017a).
To orient the core, we used computed tomography (CT) images and acoustic borehole images (ABI). Both data sets can be presented as flat unwrapped views of the core surface and borehole walls, respectively. The unwrapped images, commonly referred to as the “cylinder unwrap” view, show the 3-D surface unrolled to a 2-D image. In this view, 3-D surfaces, such as dipping fractures and bedding planes, present as sinusoids. Our orientation technique uses the CT images and borehole image to match features between the recovered core and the borehole wall.
Methods and materials
Materials
The core was imaged using 3-D dual-energy X-ray computed tomography at 0.3 mm resolution (Hall et al., 2017; Gulick et al., 2017a). The dual-energy CT imaging used a high-energy beam (135 kV) and a low-energy beam (80 kV), which can be processed, if calibrated, to calculate density and average atomic number of the sample, respectively (Gulick et al., 2017a). The images are in grayscale: low density and atomic number areas show as dark or black, and high density and atomic number areas are light or white. Open fractures appear black, and mineral-filled fractures appear dark gray to white.
In addition to the CT images of the core is an accompanying data set of acoustic borehole images, which provides a 360° image of the wall of the drilled borehole by measuring the amplitude and two-way traveltime of an ultrasonic pulse interacting with the borehole wall (Gulick et al., 2017a; Lofi et al., 2018). Resolution of the image varies between 144 samples every 4 mm to 288 samples every 2 mm (Lofi et al., 2018). The slimline tool used for acoustic imaging is coupled with a 3-component magnetometer that gives the magnetic north orientation for the ABI data set (Lofi et al., 2018). Although the downhole acoustic image is lower resolution than the CT scans, prominent features such as well-defined fractures and dikes are visible in the borehole images. Careful identification of such features in both CT and the ABI log allowed us to adjust the depth and rotation of the recovered core relative to the borehole wall, which we report here.
Core orientation method
Our methods for orienting the core relative to the borehole images includes the following steps described in detail in the following paragraphs. First, we corrected for depth by adjusting the ABI while using the CT images as a depth reference frame (Figure F1; Table T1). Second, we rotated the CT images by matching features in the ABI and neighboring CT images of the core (Figure F2). These rotations are presented in Table T2 and listed in CT depth measured in meters core composite below seafloor (m CCSF-A) as well as core depth measured in meters core below seafloor, Method A (m CSF-A or mbsf; see also IODP Depth Scales Terminology at https://www.iodp.org/policies-and-guidelines).
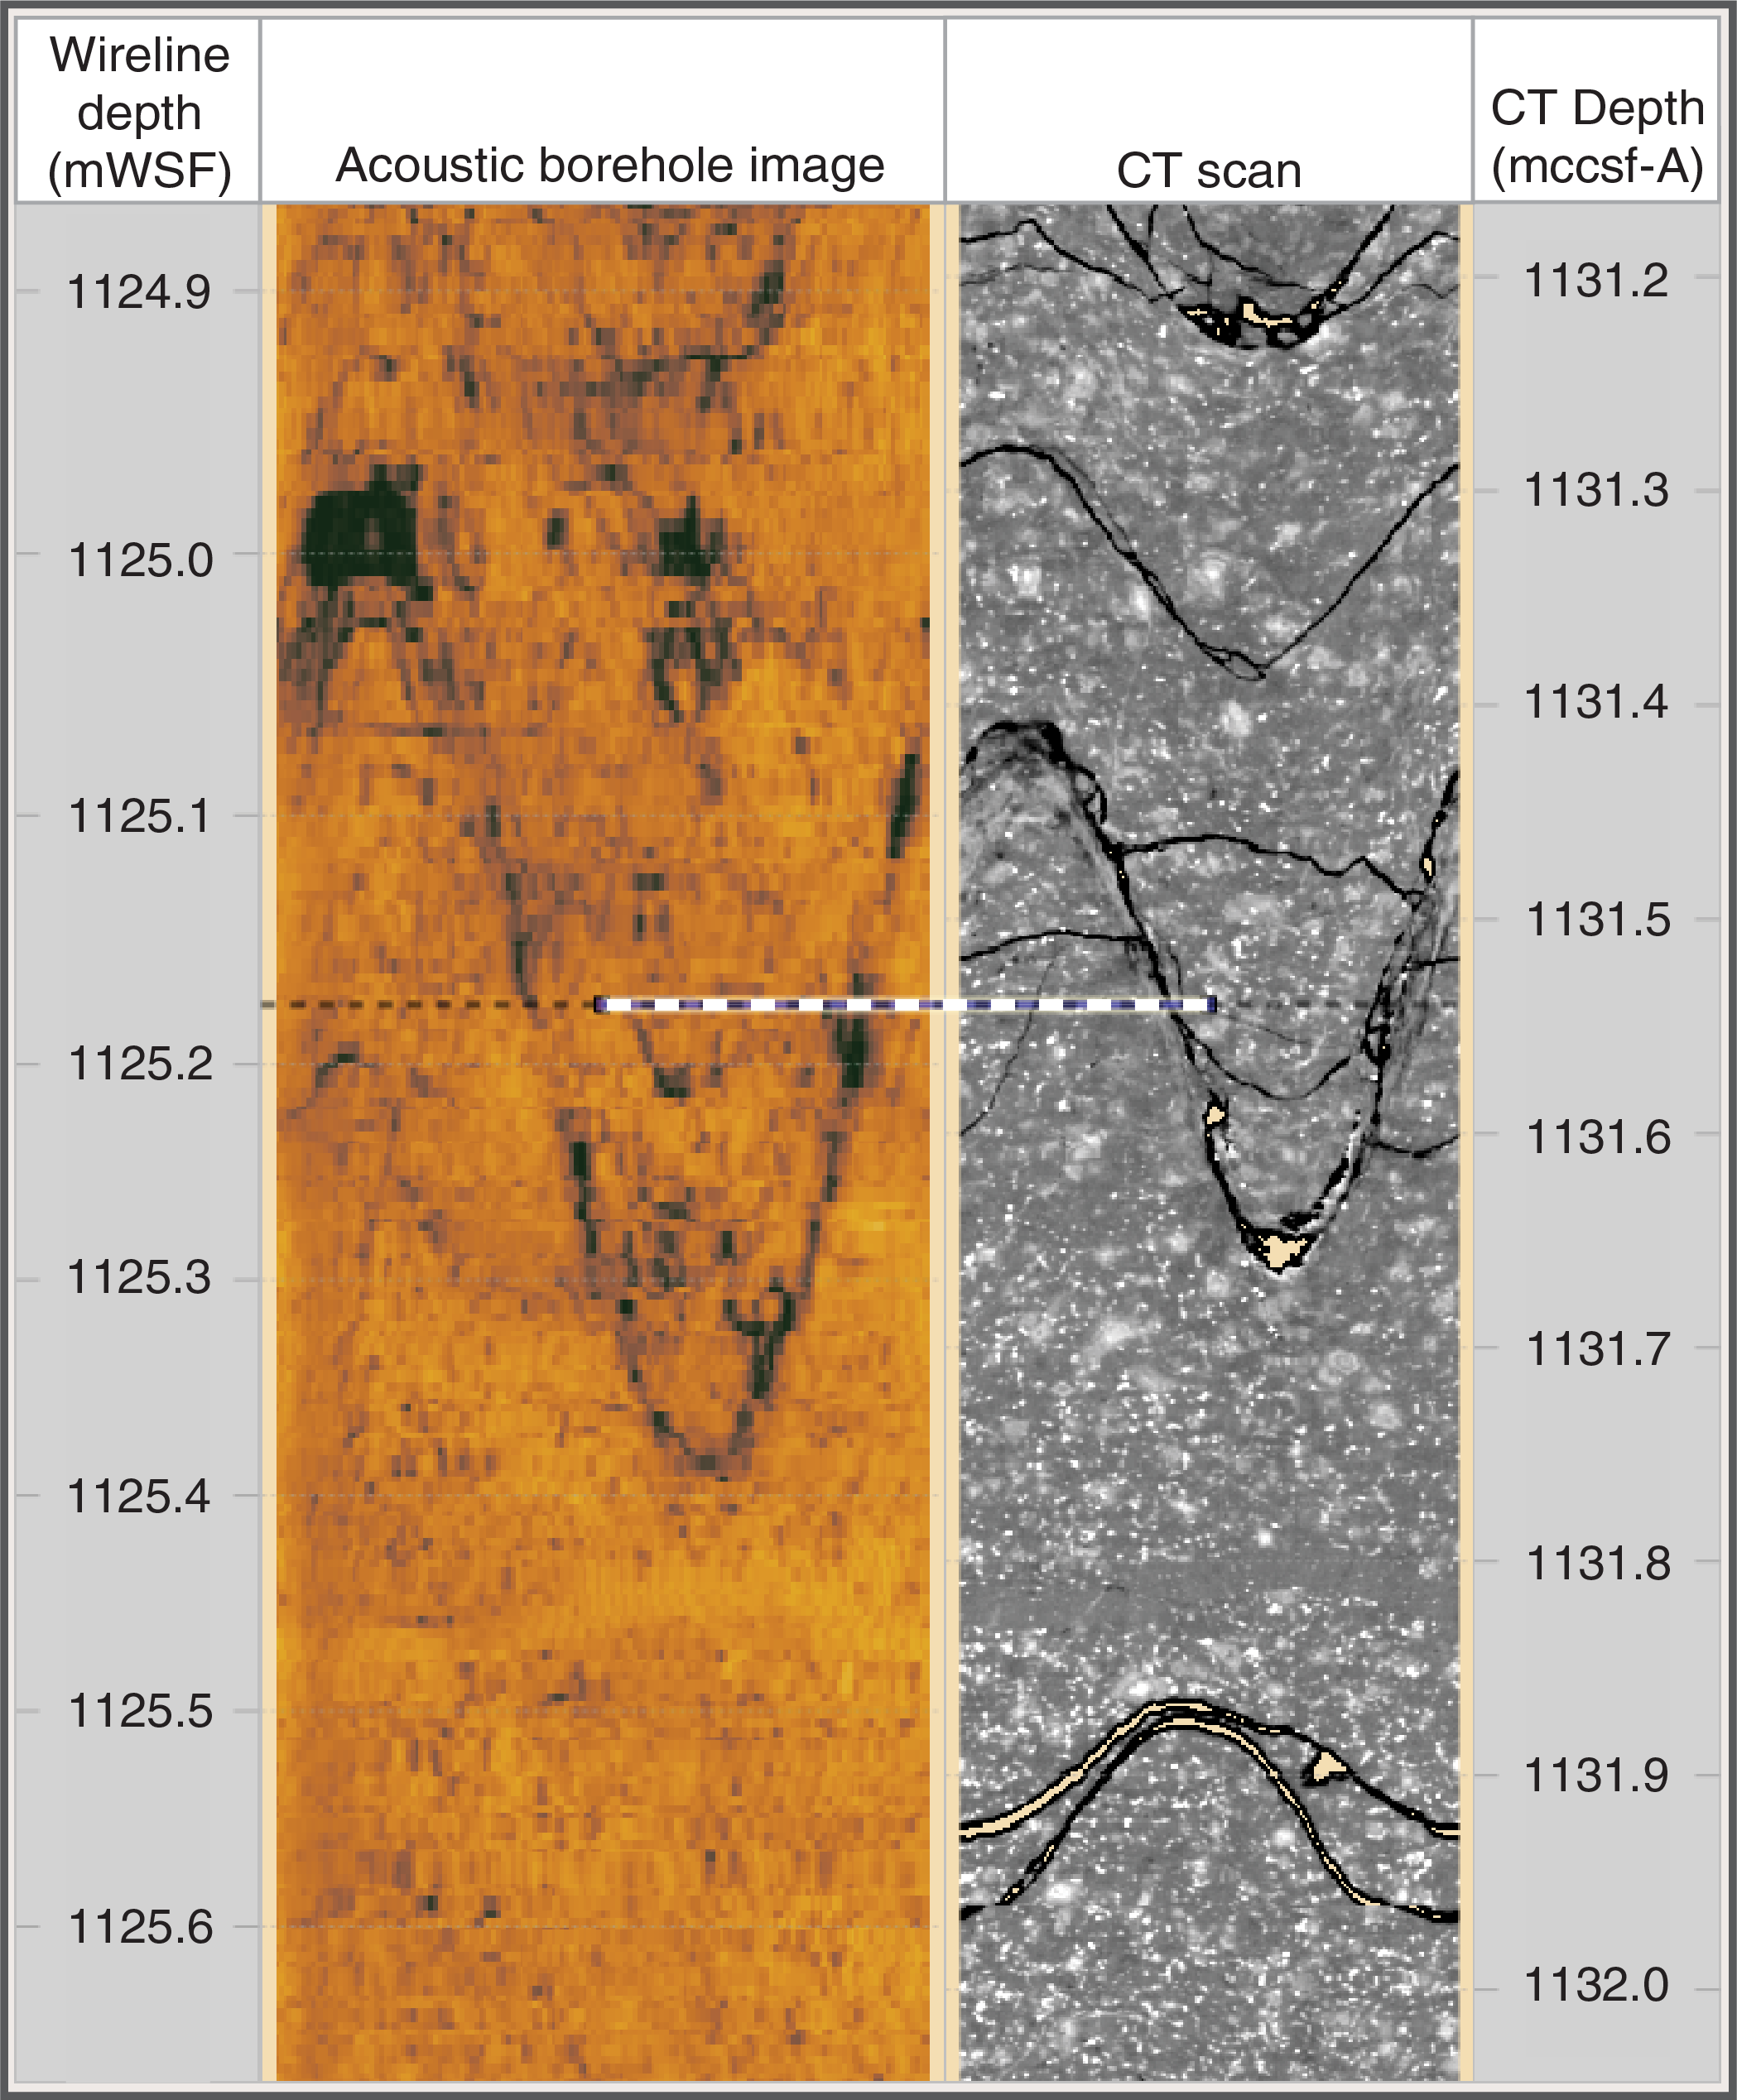
Figure F1. Depth-shift editor user interface in Virtual Core.
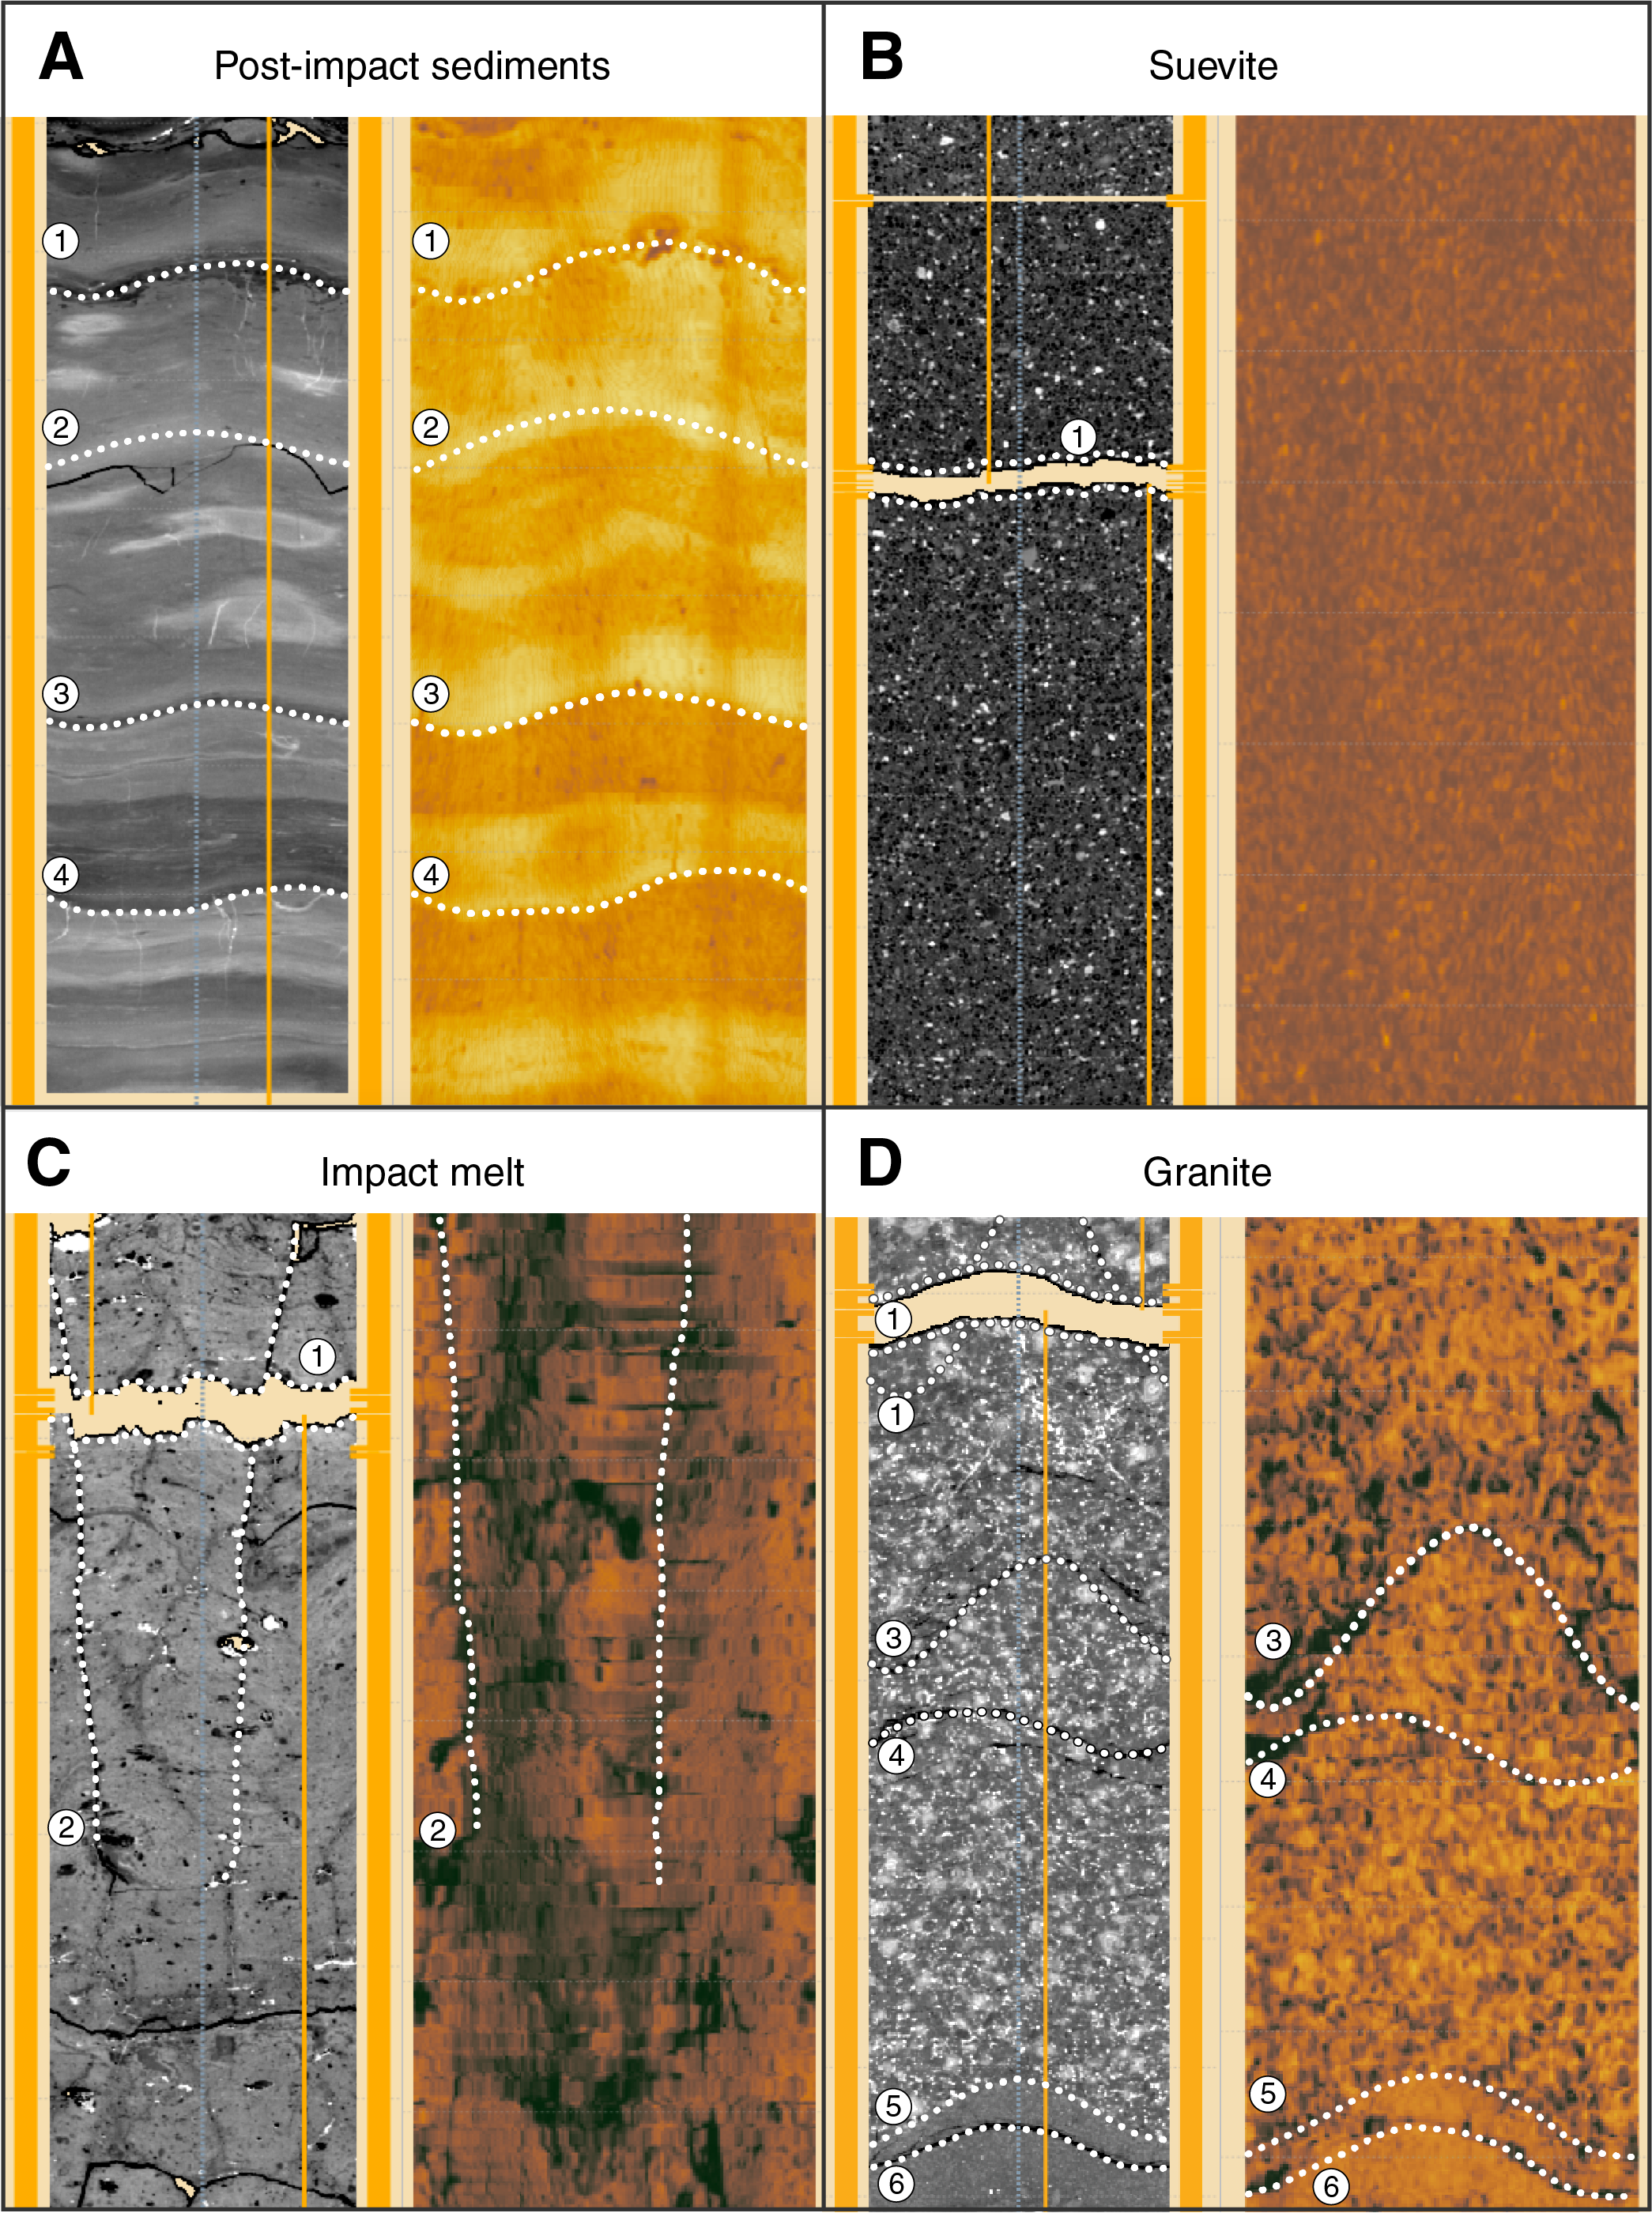
Figure F2. Core orientation user interface for CT and acoustic borehole imaging.
Depth correction
Before rotationally orienting the core, the depths of ABI and CT images needed to be correlated. We adjusted the borehole depth with the CT scans of the core as a reference frame using the depth-shift editor in the Virtual Core software, a core and borehole analysis software from Enthought computing (https://www.enthought.com/services/core-analysis). Features found in both the cylinder unwrap of the borehole image and the cylinder unwrap of the CT scans were paired, and the depth of a feature in the borehole was matched to the depth of the same feature in the CT scan. The most prominent features matched were bedding planes, contact points between dikes and granitic rocks, and fractures (Figure F2). Dipping features present as sinusoids in the cylinder unwrap view. When matching complete sinusoidal features, the midpoint of the sinusoid was matched to avoid variations in sinusoid amplitudes caused by the different diameters of the borehole and core (Figure F1). Rarely, if only part of a sinusoid was visible, peaks or troughs were matched, which could create an error in depth of as much as 5 cm. More than 250 matching features were used to calibrate depth between the borehole image and CT scans. The tie points for correcting the depths of the ABI image are presented in Table T1.
Rotational orientation correction
After the borehole image was adjusted for depth, the CT scans of unsplit core were rotationally aligned using the acoustic borehole image as a reference frame (Figure F2). Because the ABI was collected with a magnetometer, it can be used as a guide for in situ orientation of the core. Immediately after drilling, each 3 m long core run was marked with a black line running down the length of the core liner to serve as an indicator and then divided into as many as three sections with no single section longer than 1.5 m. This black line was then used to orient the core during the CT scanning process by running with the black line pointing up (Figure F3). Ideally, the original alignment of the core was preserved in the CT images; however, there were frequent sections that did not match between the ABI and CT scans or were misaligned from section to section. Possible opportunities for core misalignment include twisting during the drilling process and issues of visibility of the black line to CT technicians and rotation of the core during initial transportation on the rig before the black orientation line was marked. Additional unintentional rotation of the core or part of the core within the liner could have occurred during initial handling or between the process of CT scanning and core splitting. This would be more likely to occur on small sections of core and core sections that contain many fragmented pieces.
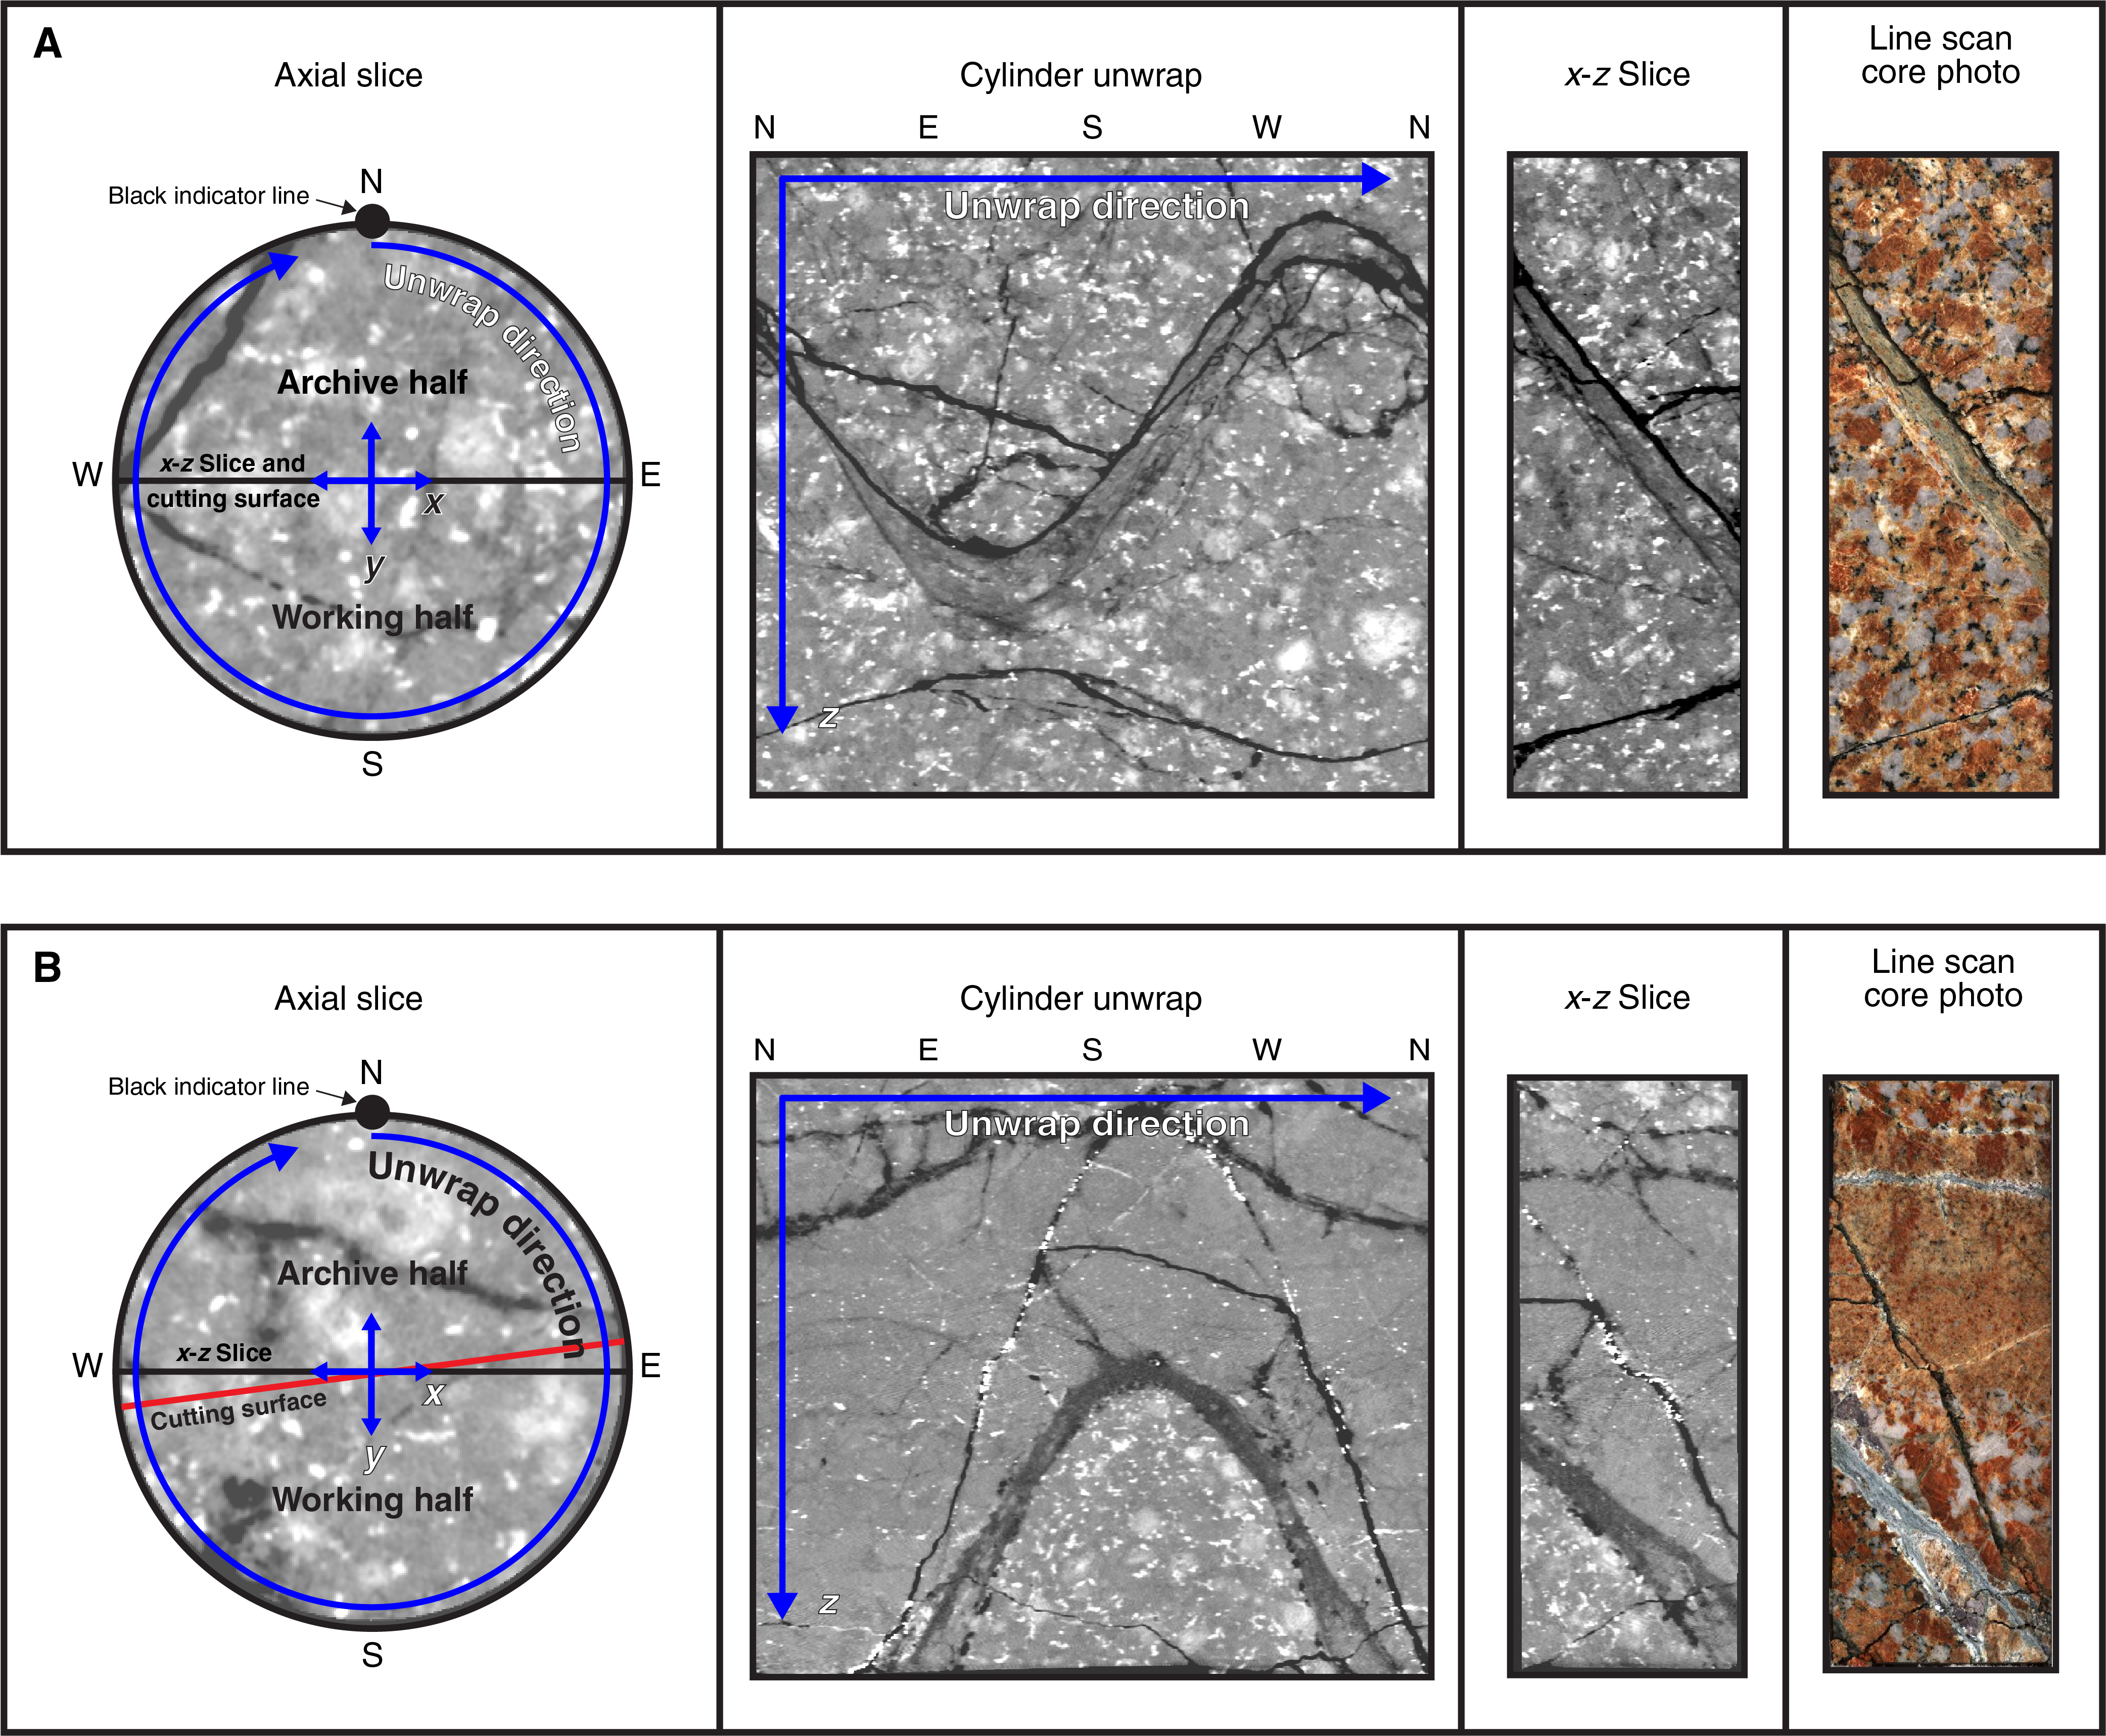
Figure F3. Reference frame for CT axial slice, CT cylinder unwrap, CT x-z slice, and linescan photo.
Orientation corrections were also determined using Virtual Core software. Portions of core in the CT scan were rotated using the alignment tool. Most often a rotated interval started at a new core run or section, although occasionally rotations were made within a section if matching features that necessitated rotation.
The alignment tool displays the cylinder unwrap view of the CT images and the depth-corrected ABI side-by-side. Alignment was achieved by matching features such as dipping beds, sharp lithologic contacts, and fractures found in both the cylinder unwrap of the borehole image and the CT scans (Figure F2). In addition to matching features between the borehole image and the CT scans, alignment was also achieved by matching one portion of a core to neighboring portions by matching one end of a core to another, either by lining up neighboring fractures or matching the breakage pattern from the end of one core to the next, or both.
Figure F2 shows screen shots of the user interface of the alignment tool. In the alignment tool in Virtual Core, the cylinder unwrap of the borehole image has magnetic south set to 0°, which is the center of the image. The yellow line in the alignment tool denotes the original placement of the core; it is 180° from the black indicator line marked during core recovery. The distance between the yellow line and the center shows the approximate rotation angle.
Each time a section of core was rotated, the identifying features, most commonly fractures, were recorded (Table T2). Depth, type of feature, and a certainty rating were also noted (Table T2). We assigned a certainty rating ranging 1– 5; 5 is most certain and 1 is least certain. Certainty varied based on clarity of the features in both the CT scan and the borehole image and the dip of the feature. An inclined bedding plane or dipping fracture is more easily matched than a relatively flat one. Some sections had several matching features, wherease others had one, or in unconstrained sections, none. Each orientation correction made was applied to an entire core section unless there was a physical discontinuity and a rationale for additional corrections. Orientation corrections made to one section were applied to neighboring sections if the features from one section to another could be matched, such as the ends of core sections fitting together or fractures that run from one core section to the next.
As an independent check, after initial orientation corrections were made, each rotation was exported to a spreadsheet that lists the depth at which the core was rotated and the amount of rotation in degrees. This spreadsheet was compared to the list of core runs and sections. If corrections were made within a section, the rotation was reviewed to make sure that rotation was warranted, as most opportunities for core misalignment occur at core run boundaries and/or section breaks. Conversely, each core run that was not rotated was checked to make sure there were no features present that would suggest rotation was needed.
Discrepancies between CT scans and linescans
Ideally, the core was CT scanned with the black indicator line oriented upward, core was cut into two halves 90° from the indicator line along the east–west axis, and then photographed. This results in the x-z slice of the CT scan and the linescan core photo displaying an identical view, and the strike of the cutting surface is either 90° or 270° (Figure F3A). Scanning the cores with the indicator line properly aligned and cutting core precisely along the east–west axis allows orientation corrections made to the CT data applicable to core samples and photos as well. However, some core sections were identified where the linescan photo and the CT x-z slice did not display exactly the same view, indicating that the strike of the cutting plane for the linescan photo deviated from 90° or 270° (Figure F3B). A list of discrepancies between the CT x-z slice and linescan photo was compiled with the core run and section number as well as a 1–4 value of how severe the discrepancy appeared (1 is a weak discrepancy and 4 is a strong discrepancy). The strike of the cutting plane for these sections was determined by identifying planar fractures in both the cylinder unwrap and the linescan photograph and measuring the dip of the fractures in both images. The following formula was used to create Table T3 and can be used if additional areas are found:
- β = the angle between the strike of the fracture and the strike of the cutting surface,
- α = the dip of the fracture in the linescan photo (apparent dip), and
- δ = the dip of the fracture in the cylinder unwrap (true dip).
This correction was made only on core sections with planar fractures visible in both the cylinder unwrap CT scan and the linescan photograph. Table T3 contains the list of discrepancies and their 1–4 severity value, the depth and orientation of fractures used, the strike of the cutting surface, and the deviation between the cutting surface and the CT x-z slice. These corrections have been integrated into Table T2; the rotational value for core samples is calculated using the rotational value for CT data plus the deviation from the CT x-z slice. This allows the user to apply orientation corrections using either CT data or core samples.
Results
Table T2 lists a rotational value and depth range for each section of core rotated. The rotation value (Column A) is the number of degrees clockwise that the black indicator line would need to be moved to correct the orientation of the core. A rotational value of zero indicates that the core at that depth did not require rotation and that the black indicator line was oriented north or that a rotation was not made because of a lack of matching features. Column B is the rotational value for core samples, which occasionally varies from the CT rotational value, as discussed above. Columns C, D, and E list the depth of rotation and matching features in CT depth (m CCSF-A), core depth (m CSF-A, mbsf), and corresponding core run and section number. Column F lists the features that warranted rotation as well as where rotation begins and ends, whereas Column G lists the associated 1–5 certainty level for each feature. Column H contains notes such as where there is a discrepancy between CT and linescan photo or when a rotation is made at a core break or within a core.
The alignment tool in Virtual Core has south set to 0° and rotations are from –180° to 180°; positive value corresponds to clockwise rotation and negative value corresponds to counterclockwise rotation. This notation may be confusing, as standard convention usually has north set to 0°. Additionally, clockwise and counterclockwise rotations make room for human error in applying orientation corrections and allows for the possibility of rotating cores in the wrong direction. In the interest of clarity, we present all rotations as a positive value that is the number of degrees clockwise the black indicator line would need to be moved to orient the core.
The first rotation is at 507.15 m CCSF-A; above to this depth matches between the CT and ABI could not be made—ABI data were lacking because of the presence of drill pipe in the borehole. Additionally, from 683.08 to 702.48 m CCSF-A and 939.86 to 943.37 m CCSF-A, ABI data are lacking or low quality, preventing matches between the CT and ABI. Any rotations made in these intervals were made by matching one end of core to another.
Further adjustments to the alignment of the core may need to be performed on areas with lower certainty ratings and fewer matching features and in areas where additional rotation occurred after CT scanning. In general, there were more features to match in the postimpact sedimentary sequence (505.70–617.28 mbsf) and the fractured granite of the lower peak ring (747.02–1334.69 mbsf); the former had gently dipping beds discernible in both the borehole image and CT scans, and the latter had numerous fractures that could be matched between the borehole image and CT scans (Figure F2A, F2D). In the postimpact sedimentary unit there were 103 matching features and 51 rotations. Rotations were made on average every 2.2 m and had matching features every 1.1 m. About 12% of the matches were made by matching one end of a section to another, with an average certainty rating of 3.5, and 83% of the matches were made by matching features between the CT scans and borehole images; these matches had an average certainty rating of 3.6. In the granite, there were 625 matching features and 296 rotations. Rotations were made on average every 2 m and had matching features every 0.9 m. About 25% of the matches were made by matching one end of a section to another, and 75% of the matches were made by matching features between the CT scans and borehole images; both of these match types had an average certainty rating of 3.7.
In the suevite and melt rock there were fewer features to match (Figure F2B, F2C) and most rotations relied on matching one end of core to another. This method is effective for relative orientation corrections, but if one section of core is not properly aligned, the misalignment can be propagated downcore until a match with the borehole image is made. This allows for the possibility that the sections may be oriented to one another but may not represent the in situ orientation. In the suevite we matched 27 features and made 27 rotations, with an average rotation and matching feature every 3.7 m. About 85% of the matches were made by matching one section of core to another with a certainty rating of 3.35. This rating corresponds to how clearly then ends of a section match one another but not how certain this rotation reflects in situ orientation. About 15% of the matches were made by matching features between the CT scans and borehole images with an average certainty rating of 1.75. In the impact melt rock unit, there were 15 matching features and 10 rotations. Rotations were made on average of every 2 m and had matching features every 1.3 m. About 60% of the matches were made by matching one end of a section to another with an average certainty rating of 3.8, and 40% of the matches were made by matching features between the CT scans and borehole images. These matches had an average certainty rating of 2.5.
Summary
The 829 m of core recovered from the Chicxulub peak ring has been reoriented via rotational adjustments with the purpose of restoring the in situ orientation of the core. Adjustments were made by matching dipping beds, fractures, and lithologic contacts in both the CT scans of the core and the accompanying acoustic borehole images. Additionally, matches were made from one section of core to another, either by lining up a fracture that connects in both sections or matching shape of the ends of one section to the next. We present all rotations made as well as feature matches with their certainty rating in Table T2 so that they may be utilized as is or modified as needed. We also present a list of discrepancies between the CT scan and core photograph as well as corrections for these intervals where planar fractures allowed for calculations in Table T3. For example, some researchers may be interested in orientation data but only want to include corrections based on matches made between the borehole image and CT scans or only want to include corrections made with matches with a minimum certainty rating or want to exclude sections where there is a discrepancy between CT scan and core photograph. We expect these data to be useful to assess deformation history, paleomagnetic directionality, sedimentary transport, and fluid flow direction within the core.
Acknowledgments
The European Consortium for Ocean Research Drilling (ECORD) implemented Expedition 364 with funding from the International Ocean Discovery Program (IODP) and the International Continental Scientific Drilling Project (ICDP). This research used samples and/or data provided by IODP. This data report was possible due to funding from the U.S. Science Support Program. We thank Enthought scientific computing for processing the X-ray CT data and Weatherford Laboratories for conducting the CT scanning at a reduced rate and with exceptional care. This is UTIG Contribution #3581.
References
Gulick, S.P.S., Bralower, T.J., Ormö, J., Hall, B., Grice, K., Schaefer, B., Lyons, S., et al., 2019. The first day of the Cenozoic. Proceedings of the National Academy of Sciences of the United States of America, 116(39):19342–19351. https://doi.org/10.1073/pnas.1909479116
Gulick, S., Morgan, J., Mellett, C.L., Green, S.L., Bralower, T., Chenot, E., Christeson, G., Claeys, P., Cockell, C., Coolen, M.J.L., Ferrière, L., Gebhardt, C., Goto, K., Jones, H., Kring, D., Lofi, J., Lowery, C., Ocampo-Torres, R., Perez-Cruz, L., Pickersgill, A.E., Poelchau, M., Rae, A., Rasmussen, C., Rebdolledo-Vieyra, M., Riller, U., Sato, H., Smit, J., Tikoo, S., Tomioka, N., Urrutia Fucugauchi, J., Whalen, M., Wittmann, A., Yamagachi, K., Xiao, L., and Zylberman, W., 2017a. Expedition 364 methods. In Morgan, J., Gulick, S., Mellett, C.L., Green, S.L., and the Expedition 364 Scientists, Chicxulub: Drilling the K-Pg Impact Crater. Proceedings of the International Ocean Discovery Program, 364: College Station, TX (International Ocean Discovery Program). https://doi.org/10.14379/iodp.proc.364.102.2017
Gulick, S., Morgan, J., Mellett, C.L., Green, S.L., Bralower, T., Chenot, E., Christeson, G., Claeys, P., Cockell, C., Coolen, M.J.L., Ferrière, L., Gebhardt, C., Goto, K., Jones, H., Kring, D., Lofi, J., Lowery, C., Ocampo-Torres, R., Perez-Cruz, L., Pickersgill, A.E., Poelchau, M., Rae, A., Rasmussen, C., Rebdolledo-Vieyra, M., Riller, U., Sato, H., Smit, J., Tikoo, S., Tomioka, N., Urrutia Fucugauchi, J., Whalen, M., Wittmann, A., Yamagachi, K., Xiao, L., and Zylberman, W., 2017b. Expedition 364 summary. In Morgan, J., Gulick, S., Mellett, C.L., Green, S.L., and the Expedition 364 Scientists, Chicxulub: Drilling the K-Pg Impact Crater. Proceedings of the International Ocean Discovery Program, 364: College Station, TX (International Ocean Discovery Program). https://doi.org/10.14379/iodp.proc.364.101.2017
Hailwood, E., and Ding, F., 2000. Sediment transport and dispersal pathways in the Lower Cretaceous sands of the Britannia Field, derived from magnetic anisotropy. Petroleum Geoscience, 6(4):369–379. https://doi.org/10.1144/petgeo.6.4.369
Hall, B.J., Gulick, S., McCall, N., Rae, A.S.P., Morgan, J., Gebhardt, C., Christenson, G., Newton, B., and the IODP-ICDP and Expedition 364 Scientists, 2017. Dual energy CT scanning and processing of core from the peak ring of the Chicxulub impact structure: results from IODP-ICDP Expedition 364. Lunar and Planetary Science Conference, 48:1697. https://www.hou.usra.edu/meetings/lpsc2017/pdf/1697.pdf
Lofi, J., Smith, D., Delahunty, C., Le Ber, E., Brun, L., Henry, G., Paris, J., et al., 2018. Drilling-induced and logging-related features illustrated from IODP–ICDP Expedition 364 downhole logs and borehole imaging tools. Scientific Drilling, 24:1–13. https://doi.org/10.5194/sd-24-1-2018
Lowery, C.M., Bralower, T.J., Owens, J.D., Rodríguez-Tovar, F.J., Jones, H., Smit, J., Whalen, M.T., et al., 2018. Rapid recovery of life at ground zero of the end-Cretaceous mass extinction. Nature, 558(7709):288–291. https://doi.org/10.1038/s41586-018-0163-6
Morgan, J.V.,Gulick, S.P. S., Bralower, T., Chenot, E., Christeson, G., Claeys, P., Cockell, C., et al., 2016. The formation of peak rings in large impact craters. Science, 354(6314):878–882. https://doi.org/10.1126/science.aah6561
Nelson, R.A., Lenox, L.C., and Ward, B.J., Jr., 1987. Oriented core: its use, error, and uncertainty. AAPG Bulletin, 71(4):357–367. https://doi.org/10.1306/94886EB1-1704-11D7-8645000102C1865D
Paulsen, T.S., Jarrard, R.D., and Wilson, T.J., 2002. A simple method for orienting drill core by correlating features in whole-core scans and oriented borehole-wall imagery. Journal of Structural Geology, 24(8):1233–1238. https://doi.org/10.1016/S0191-8141(01)00133-X
Riller, U., Poelchau, M.H., Rae, A.S.P., Schulte, F.M., Collins, G.S., Melosh, H.J., Grieve, R.A.F., et al., 2018. Rock fluidization during peak-ring formation of large impact structures. Nature, 562(7728):511–518. https://doi.org/10.1038/s41586-018-0607-z
Schulte, P., Alegret, L., Arenillas, I., Arz, J.A., Barton, P.J., Bown, P.R., Bralower, T.J., et al., 2010. The Chicxulub asteroid impact and mass extinction at the Cretaceous–Paleogene boundary. Science, 327(5970):1214–1218. https://doi.org/10.1126/science.1177265
1 McCall, N., Gulick, S., Hall, B., Lofi, J., and Poelchau, M., 2020. Data report: orientation correction of Chicxulub core recovered from IODP/ICDP Expedition 364. In Morgan, J., Gulick, S., Mellett, C.L., Green, S.L., and the Expedition 364 Scientists, Chicxulub: Drilling the K-Pg Impact Crater. Proceedings of the International Ocean Discovery Program, 364: College Station, TX (International Ocean Discovery Program). https://doi.org/10.14379/iodp.proc.364.201.2020
2 University of Texas at Austin, Jackson School of Geosciences, Institute for Geophysics, USA. Correspondence author: nmccall@utexas.edu
4 Géosciences Montpellier, Université de Montpellier, CNRS, Université des Antilles, France.
5 University of Freiburg, Germany.
This work is distributed under the Creative Commons Attribution 4.0 International (CC BY 4.0) license. 