Wallace, L.M., Saffer, D.M., Barnes, P.M., Pecher, I.A., Petronotis, K.E., LeVay, L.J., and the Expedition 372/375 Scientists
Proceedings of the International Ocean Discovery Program Volume 372B/375
publications.iodp.org

https://doi.org/10.14379/iodp.proc.372B375.205.2021
Data report: permeability and grain size of sediments, IODP Expeditions 372 and 3751
Elizabeth J. Screaton,2 Cora Summerfield,2 John M. Jaeger,2 and Jonathan Whipple2
Keywords: International Ocean Discovery Program; IODP; JOIDES Resolution; Expedition 372; Expedition 375; Site U1517; Site U1518; Site U1519; Site U1520; Hikurangi Subduction Margin Coring, Logging, and Observatories; vertical permeability; grain size
MS 372B375-205: Received 20 August 2020 · Accepted 18 November 2020 · Published 24 March 2021
Abstract
A total of 15 whole-round core samples from International Ocean Discovery Program Expeditions 372 and 375 were tested for vertical permeability. The samples were recovered from four sites. Sites U1517 and U1519 are located on the upper slope, Site U1518 is located near the trench, and Site U1520 is located seaward of the trench. Measured vertical permeability varied from 5.7 × 10⁻¹⁹ m2 to 1.7 × 10⁻¹⁶ m2. Unless cores were too consolidated to disaggregate, subsamples were taken and analyzed for grain size. The tested samples contained 35.4%–66.3% clay-sized (<4 µm), 32.7%–51.7% silt-sized (4–63 µm), and 0.5%–23.1% sand-sized (>63 µm) fractions.
Introduction
International Ocean Discovery Program Expeditions 372 and 375 recovered cores from the Hikurangi Subduction Zone off the east coast of New Zealand (Barnes et al., 2019; Saffer et al., 2019) (Figure F1). In this study, we used flow-through permeability tests to measure the vertical permeability of 15 whole-round core samples. Subsamples from the core used for permeability testing were used for grain size analyses. Samples are from four sites. Site U1517 is located ~35 km from shore on the upper slope of the Hikurangi margin at a water depth of 720 m. Drilling at Site U1517 investigated the landslide mass and the gas hydrate stability zone of the Tuaheni Landslide Complex, and sediments consist primarily of clayey silt with sandy intervals (Barnes et al., 2019). Site U1518 is located ~73 km from shore on the lower continental slope near the trench, and sediments are composed of silty clay or mud alternating with thin beds of silt to silty sand. Drilling at Site U1518 (~2630 m water depth) investigated the Pāpaku thrust fault and the surrounding sediments (Saffer et al., 2019). Site U1519 is located on the upper continental slope ~38 km from shore at a water depth of 1000 m. This site was drilled to investigate the upper plate overlying a region that produces slow slip events; common lithologies include mud(stone), silt(stone), and sand(stone) (Saffer et al., 2019). Site U1520, at a water depth of ~3520 m, examined sediments on the incoming Pacific plate, ~95 km from shore and 16 km east of the deformation front (Saffer et al., 2019). Site U1520 lithologies include mud with beds of silt and/or sand, pelagic carbonate, and volcaniclastic conglomerate (Saffer et al., 2019).
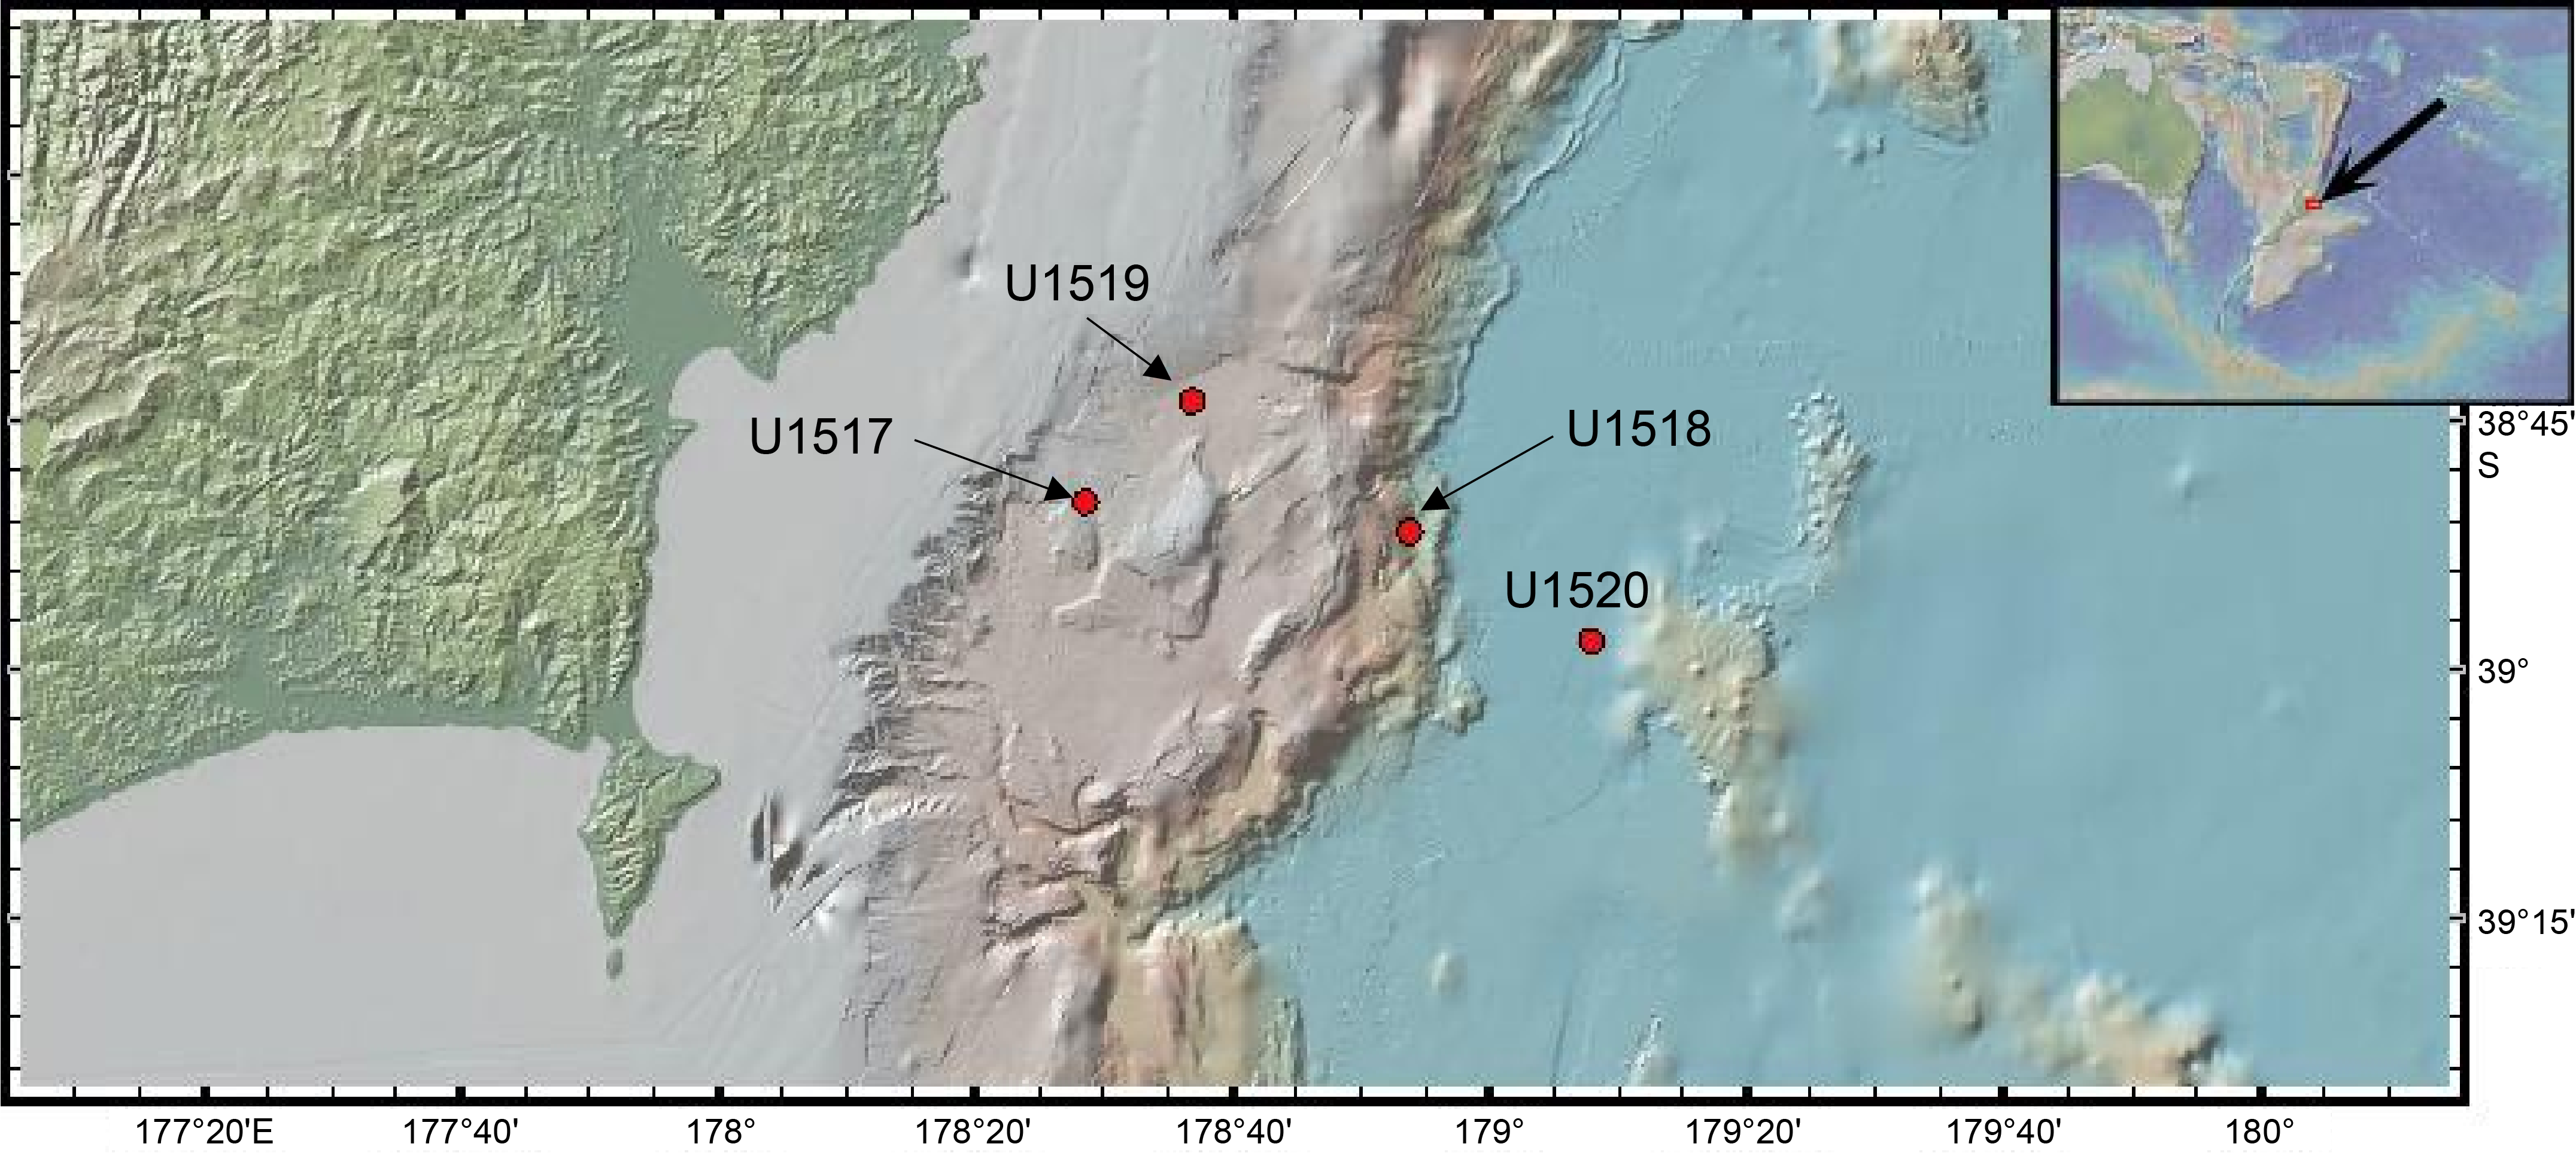
Figure F1. Site locations.
The objective of the testing was to help characterize the sediments that are part of the Hikurangi subduction zone. The permeability of sediments entering subduction zones can greatly affect fluid pressures during shallow subduction. Permeability testing allows development of permeability-porosity relationships that can be used for modeling pore pressure development and fluid flow.
Methods
Permeability tests
The methods for permeability testing are similar to those of previous studies (e.g., James and Screaton, 2015) and were based on American Society for Testing and Materials (ASTM) designation D 5084-90 (ASTM International, 1990). Permeability tests used Trautwein Soil Testing Equipment Company's DigiFlow K. A cell is used to contain the sample, and a pump maintains isostatic effective stress on the sample (Figure F2). Two additional pumps are used to pump or remove water from the top and bottom of the sample. Deionized water was used as the fluid in the pumps, and a solution of 33 g NaCl per liter of water permeated the sample. Pressure was transmitted from the deionized water to the permeant across a rubber membrane in an interface chamber (Figure F2).
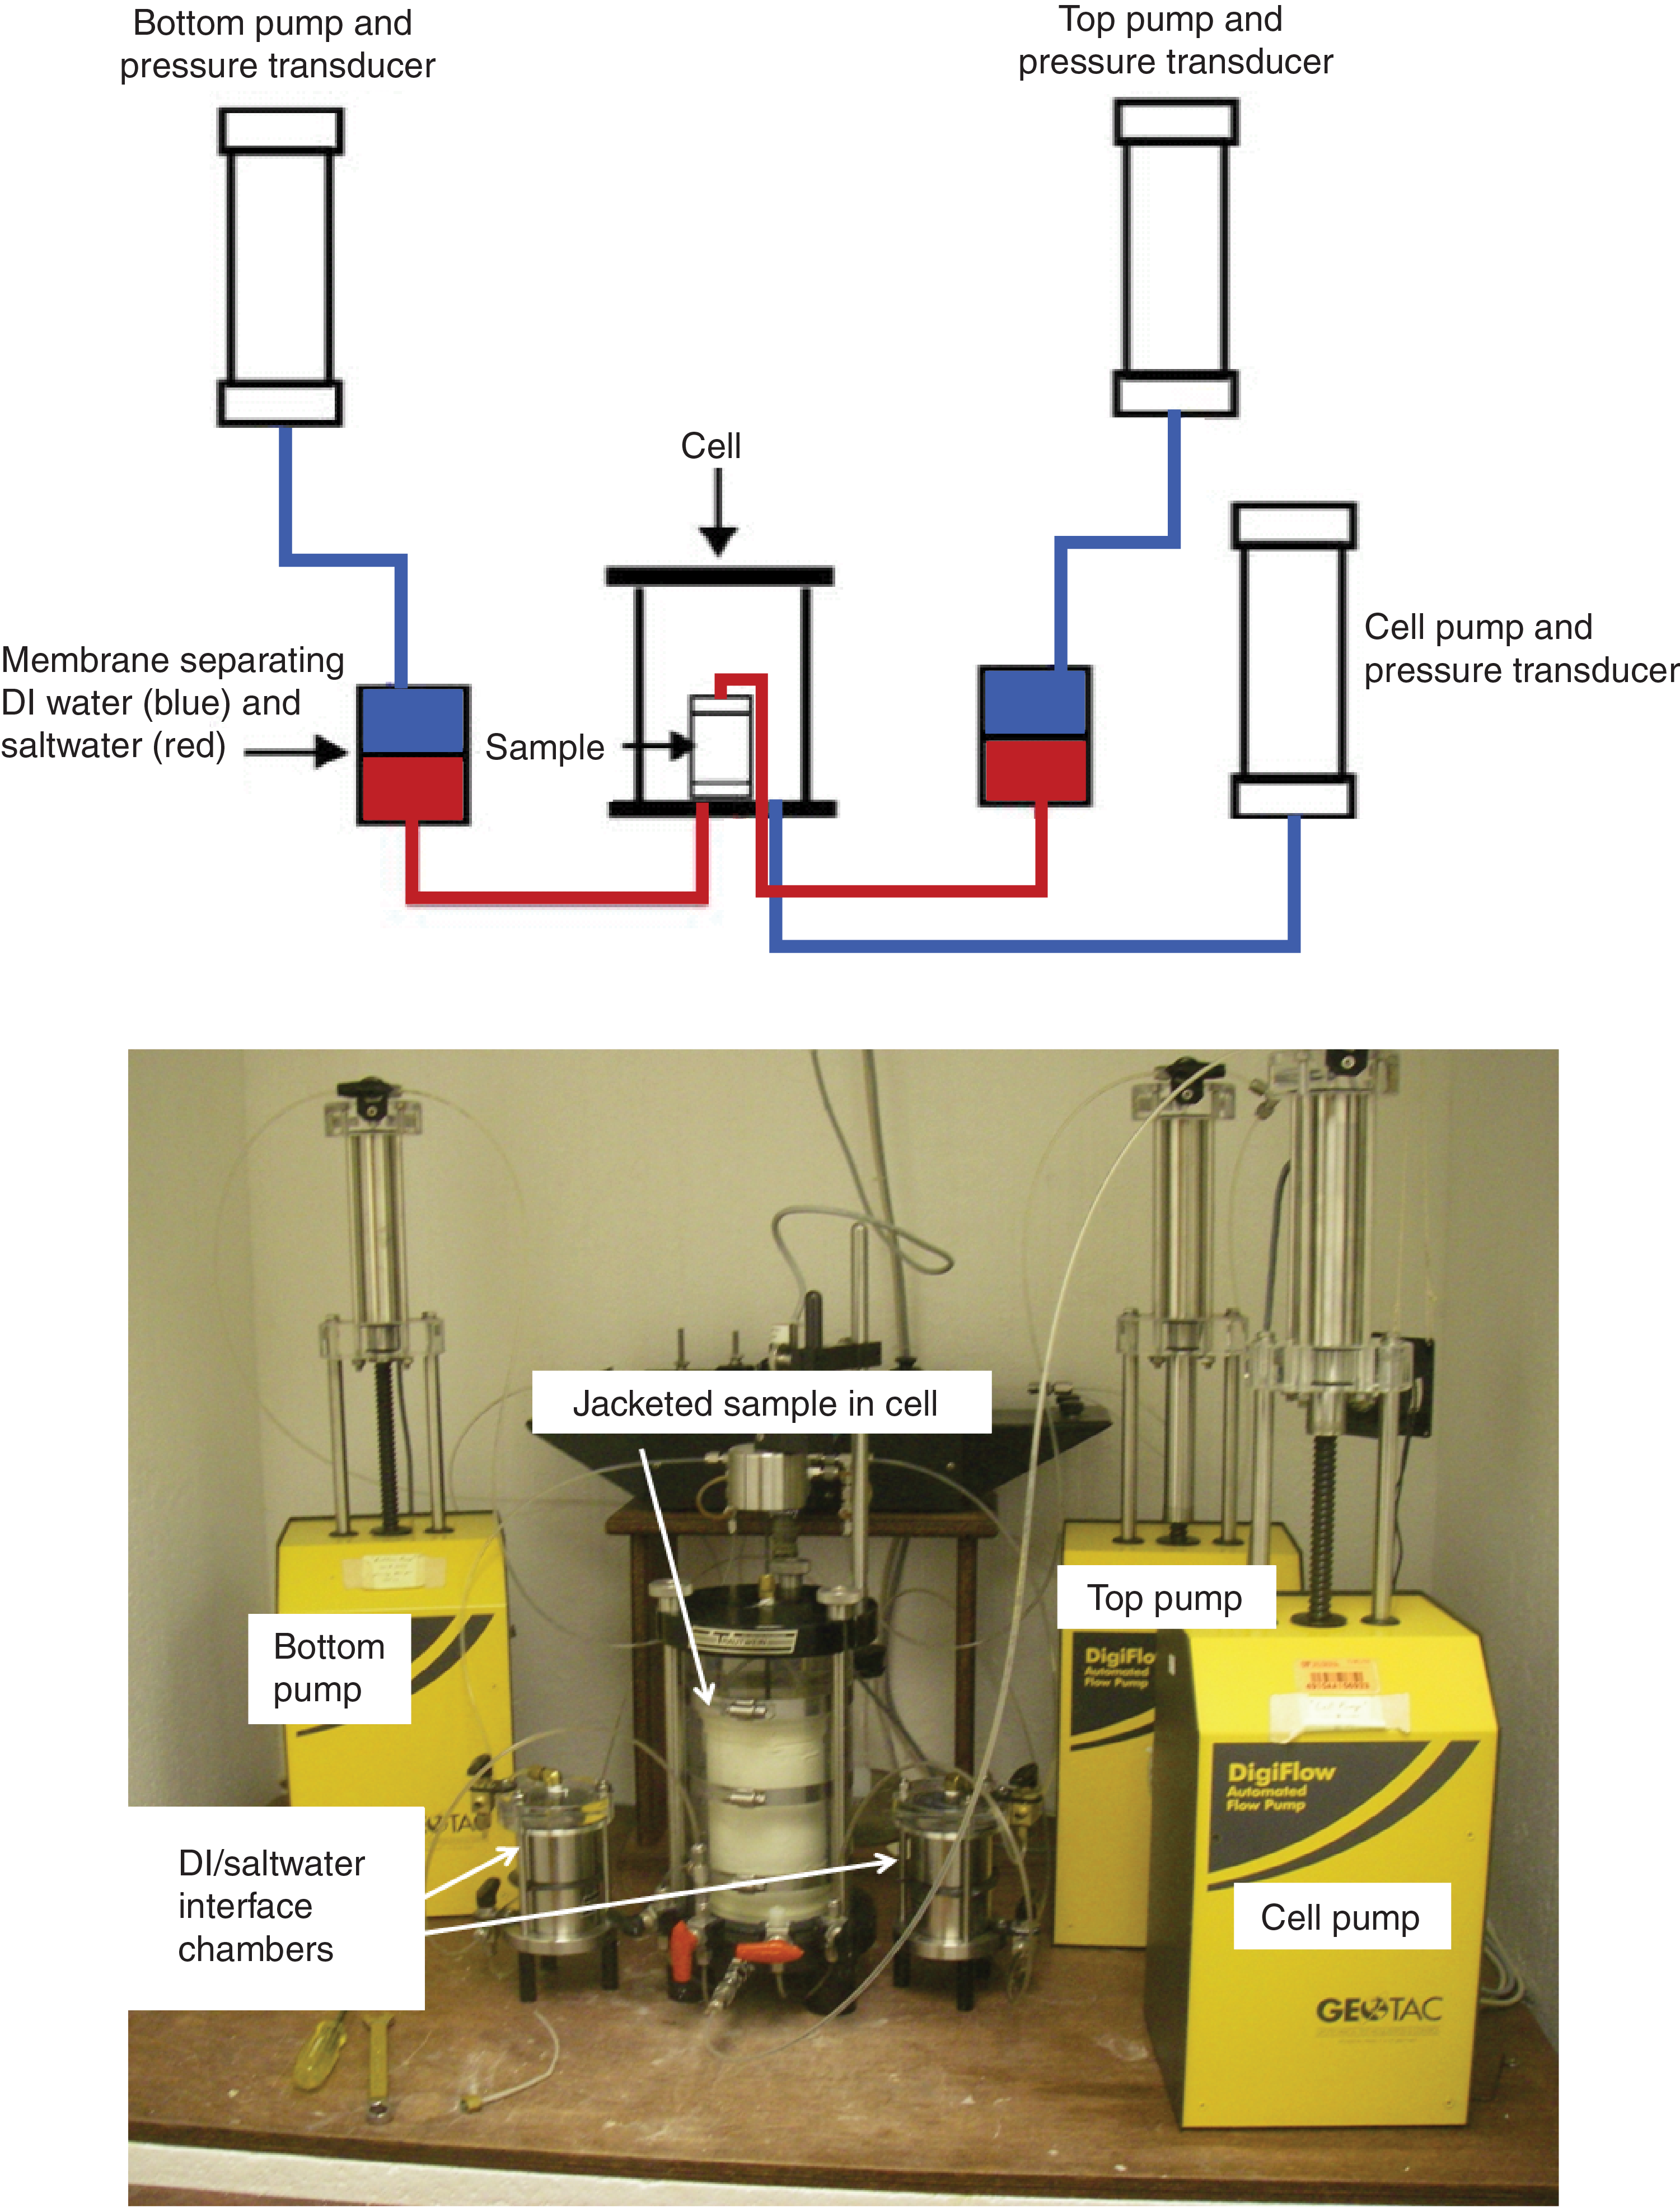
Figure F2. Permeability test system.
The retrieved core samples from Expeditions 372 and 375 were stored in plastic core liners and sealed bags to prevent moisture loss. Samples were refrigerated at 4°C until immediately before sample preparation. All tests were conducted with flow in the vertical direction (along the axis of the core) using the whole-round core. To provide freshly exposed surfaces, cores were trimmed on both ends using a cutting tool or wire saw, depending on core properties. Visual inspection was used to select portions of the core that were relatively uniform in composition and not disturbed or fractured. After the sample ends were trimmed, diameters of the trimmed whole-round cores ranged from 5.6 to 6.8 cm and sample heights ranged from 5.2 to 10.35 cm. After trimming, the sample was placed in a rubber membrane and fitted with saturated porous disks and end caps. The membrane-encased sample was placed in the cell, which was then filled with deionized water. Fluid exchange occurs only through the flow lines connecting the end caps to the top and bottom pumps. A small confining pressure of ~0.03 MPa (5 psi) was applied to the water in the cell, and flow lines were flushed to remove any trapped air bubbles. After the flow lines were flushed, the sample was backpressured to either ~0.28 MPa (40 psi), ~0.34 MPa (50 psi), or ~0.41 MPa (60 psi) by concurrently ramping the cell pressure and the sample pressure to maintain a constant effective stress of 0.03 MPa (5 psi). Because the whole-round samples were sealed immediately after the core liner was cut, the samples were expected to be near saturation prior to testing. Backpressuring at 0.28 MPa (40 psi) for ~24 h is sufficient to ensure full saturation under these conditions (ASTM International, 1990). A B test on each sample was used to check saturation. In a B test, the cell confining pressure was instantaneously increased by 10 psi and the sample response was measured. The ratio of sample pressure change to cell pressure change is the Skempton B coefficient, which is typically near 1 for soft to medium clays (Wang, 2000). A B test result of 0.95 is typically used to indicate saturation for soft to medium clays. This criterion is not applicable for more consolidated materials because compiled B coefficients for mudstone, sandstone, and limestone are 0.95, 0.50–0.88, and 0.25, respectively (Wang, 2000). Samples with B coefficient less than 0.95 were given additional time for saturation or backpressure was increased. Saturation was assumed if the B value did not change with increased time and increased backpressure. Subsequently, the cell fluid pressure was increased while the sample backpressure was maintained, thus increasing the effective stress on the sample. This effective stress both consolidated the sample and pushed the flexible membrane against the sample to prevent flow from bypassing the sample. The expected in situ effective stress is generally much greater than what was reached in laboratory testing. As a result, the measured permeability values likely overestimate in situ conditions. On the other hand, they can be used to construct permeability-porosity relationships for use in fluid-flow modeling (e.g., Daigle and Screaton, 2015).
For every sample, flow tests were performed at two or more different effective stress steps. Once the target effective stress was achieved for each step, cell pressure and backpressure were maintained. The sample was allowed to equilibrate for at least 12 h and generally for 24 h. Throughout testing, inflows and outflows to the cell fluid were monitored to assess changes in sample volume, and sample data were recorded every minute. Because fluid pressure in the closed hydraulic system was affected by temperature changes, testing was conducted within a closed cabinet to keep the internal temperature uniform. Testing temperatures were 26° ± 1°C, unless otherwise noted in Table T1. At least three flow tests were performed at each effective stress level, and flow direction varied between tests. Flow tests were run by specifying pressures of the top and bottom pumps and recording flow rates into and out of the sample.
The pressure difference (ΔP) from the top and bottom pumps was converted to hydraulic head difference (Δh):
where ρf = fluid density (1021 kg/m3) and g = acceleration due to gravity (9.81 m/s2).
Darcy's law was used to calculate the hydraulic conductivity:
- Q = measured flow rate (in cubic meters per second),
- K = hydraulic conductivity (in meters per second),
- A = the cross-sectional area of the sample (in square meters),
- Δh = the difference in head across the sample (in meters), and
- Δl = the length of the sample (in meters).
The hydraulic conductivity values were then converted to permeability (in square meters) using the following equation:
- ρf = fluid density (1021 kg/m3),
- g = acceleration due to gravity (9.81 m/s2), and
- µ = viscosity (0.00093 Pa·s).
For the laboratory temperature (average = 26°C) and fluid salinity (33 g/L), a fluid density of 1021 kg/m3 and viscosity of 0.00093 Pa·s were calculated based on relationships compiled by Sharqawy et al. (2010). Assuming reasonable water compressibility, density change due to the applied pressure was minor (<0.1%). A 1 h interval of stable flow rates was averaged for the permeability calculations, and the standard deviation of the permeability during that interval was calculated to assess uncertainty. The fluctuations in the calculated permeability are likely caused by slight temperature variations. The resulting volume changes would cause temporary changes in measured flow rates. The time interval was selected based on where inflow best matched outflow, indicating steady-state conditions, and where the standard deviation was minimized.
The corresponding porosity for each effective stress level was calculated using the change in volume of fluid contained in the cell during each consolidation step. The volume change during consolidation was assumed to be solely a result of changes in sample porosity. Influences of material and apparatus stiffness were assumed to be negligible. Total sample volume (VT(0)) was calculated using πr2h, where r is the radius of the core sample and h is the height of the sample. Initial porosities (n0) for volume calculations were obtained from the shipboard moisture and density results; these shipboard data can be accessed at https://web.iodp.tamu.edu/OVERVIEW. We assumed that the porosity of the sample at the end of backpressure is similar to the initial porosity (n0) of the sample due to the small change in effective stress.
Using the initial porosity (n0), the volume of voids before the testing (Vv(0)) was calculated:
Volume of solids (Vs) was calculated using:
The change in volume of water in the cell (ΔVT(1)) was calculated using the difference of cell volumes between two consecutive steps (e.g., cell volume at backpressure and cell volume at first consolidation). The new total volume of the sample (VT(1)) after pore spaces were reduced during the consolidation process was determined by subtracting the change in cell volume at the end of the consolidation step (ΔVT(1)) from the total sample volume (VT(0)):
Using the calculated new total volume of the sample (VT(1)), the new porosity at the end of the consolidation (n1) was calculated as
Grain size analyses
Subsamples were extracted in 1.5 cm thick intervals from the permeability sample after completion of the permeability tests. Because the cores used for permeability testing were relatively consistent in composition, the subsamples were assumed to be representative. The subsamples were homogenized and then disaggregated in a solution of sodium hexametaphosphate (Calgon) to inhibit clay flocculation. Subsamples were also immersed in an ultrasonic bath for a minimum of 2 h to assist disaggregation. Two samples (375-U1520C-22R-4, 99–119 cm, and 29R-3, 64–84 cm) could not be tested for grain size because they were too consolidated to disaggregate using these methods.
A small aliquot of the homogenized sample was dried to determine water content, which was then used to establish the equivalent dry mass used in the particle size analysis. Once disaggregated, a subsample was wet sieved at 63 μm to determine its sand-sized fraction. A separate subsample was wet sieved at 53 μm, and material smaller than 53 μm was analyzed on a 5100 Micrometrics SediGraph (Coakley and Syvitski, 1991). The SediGraph emits X-rays that record the settling rates of particles suspended in a hexametaphosphate solution. The principle of Stokes' Law was used to calculate grain sizes. The SediGraph data were combined with the wet-sieved results to normalize the mud and sand fraction to their relative masses to determine the proportion of sand-, silt-, and clay-sized particles. Clay-sized particles were defined as smaller than 4 μm based on the Wentworth grain size classification.
Results
Table T1 summarizes the effective stress and estimated porosity and permeability at each consolidation step as well as the grain size distribution for each sample.
Results are shown with plots of shipboard porosity in Figures F3, F4, F5, and F6 for Sites U1517, U1518, U1519, and U1520, respectively. Measured vertical permeability varied from 5.7 × 10⁻¹⁹ m2 to 1.7 × 10⁻¹⁶ m2. The tested samples contained 35.4%–66.3% clay-sized (<4 µm), 32.7%–51.7% silt-sized (4–63 µm), and 0.5%–23.1% sand-sized (>63 µm) fractions. Permeability results are also plotted as a function of porosity (Figure F7). The results show a general trend of the logarithm of permeability varying with porosity.
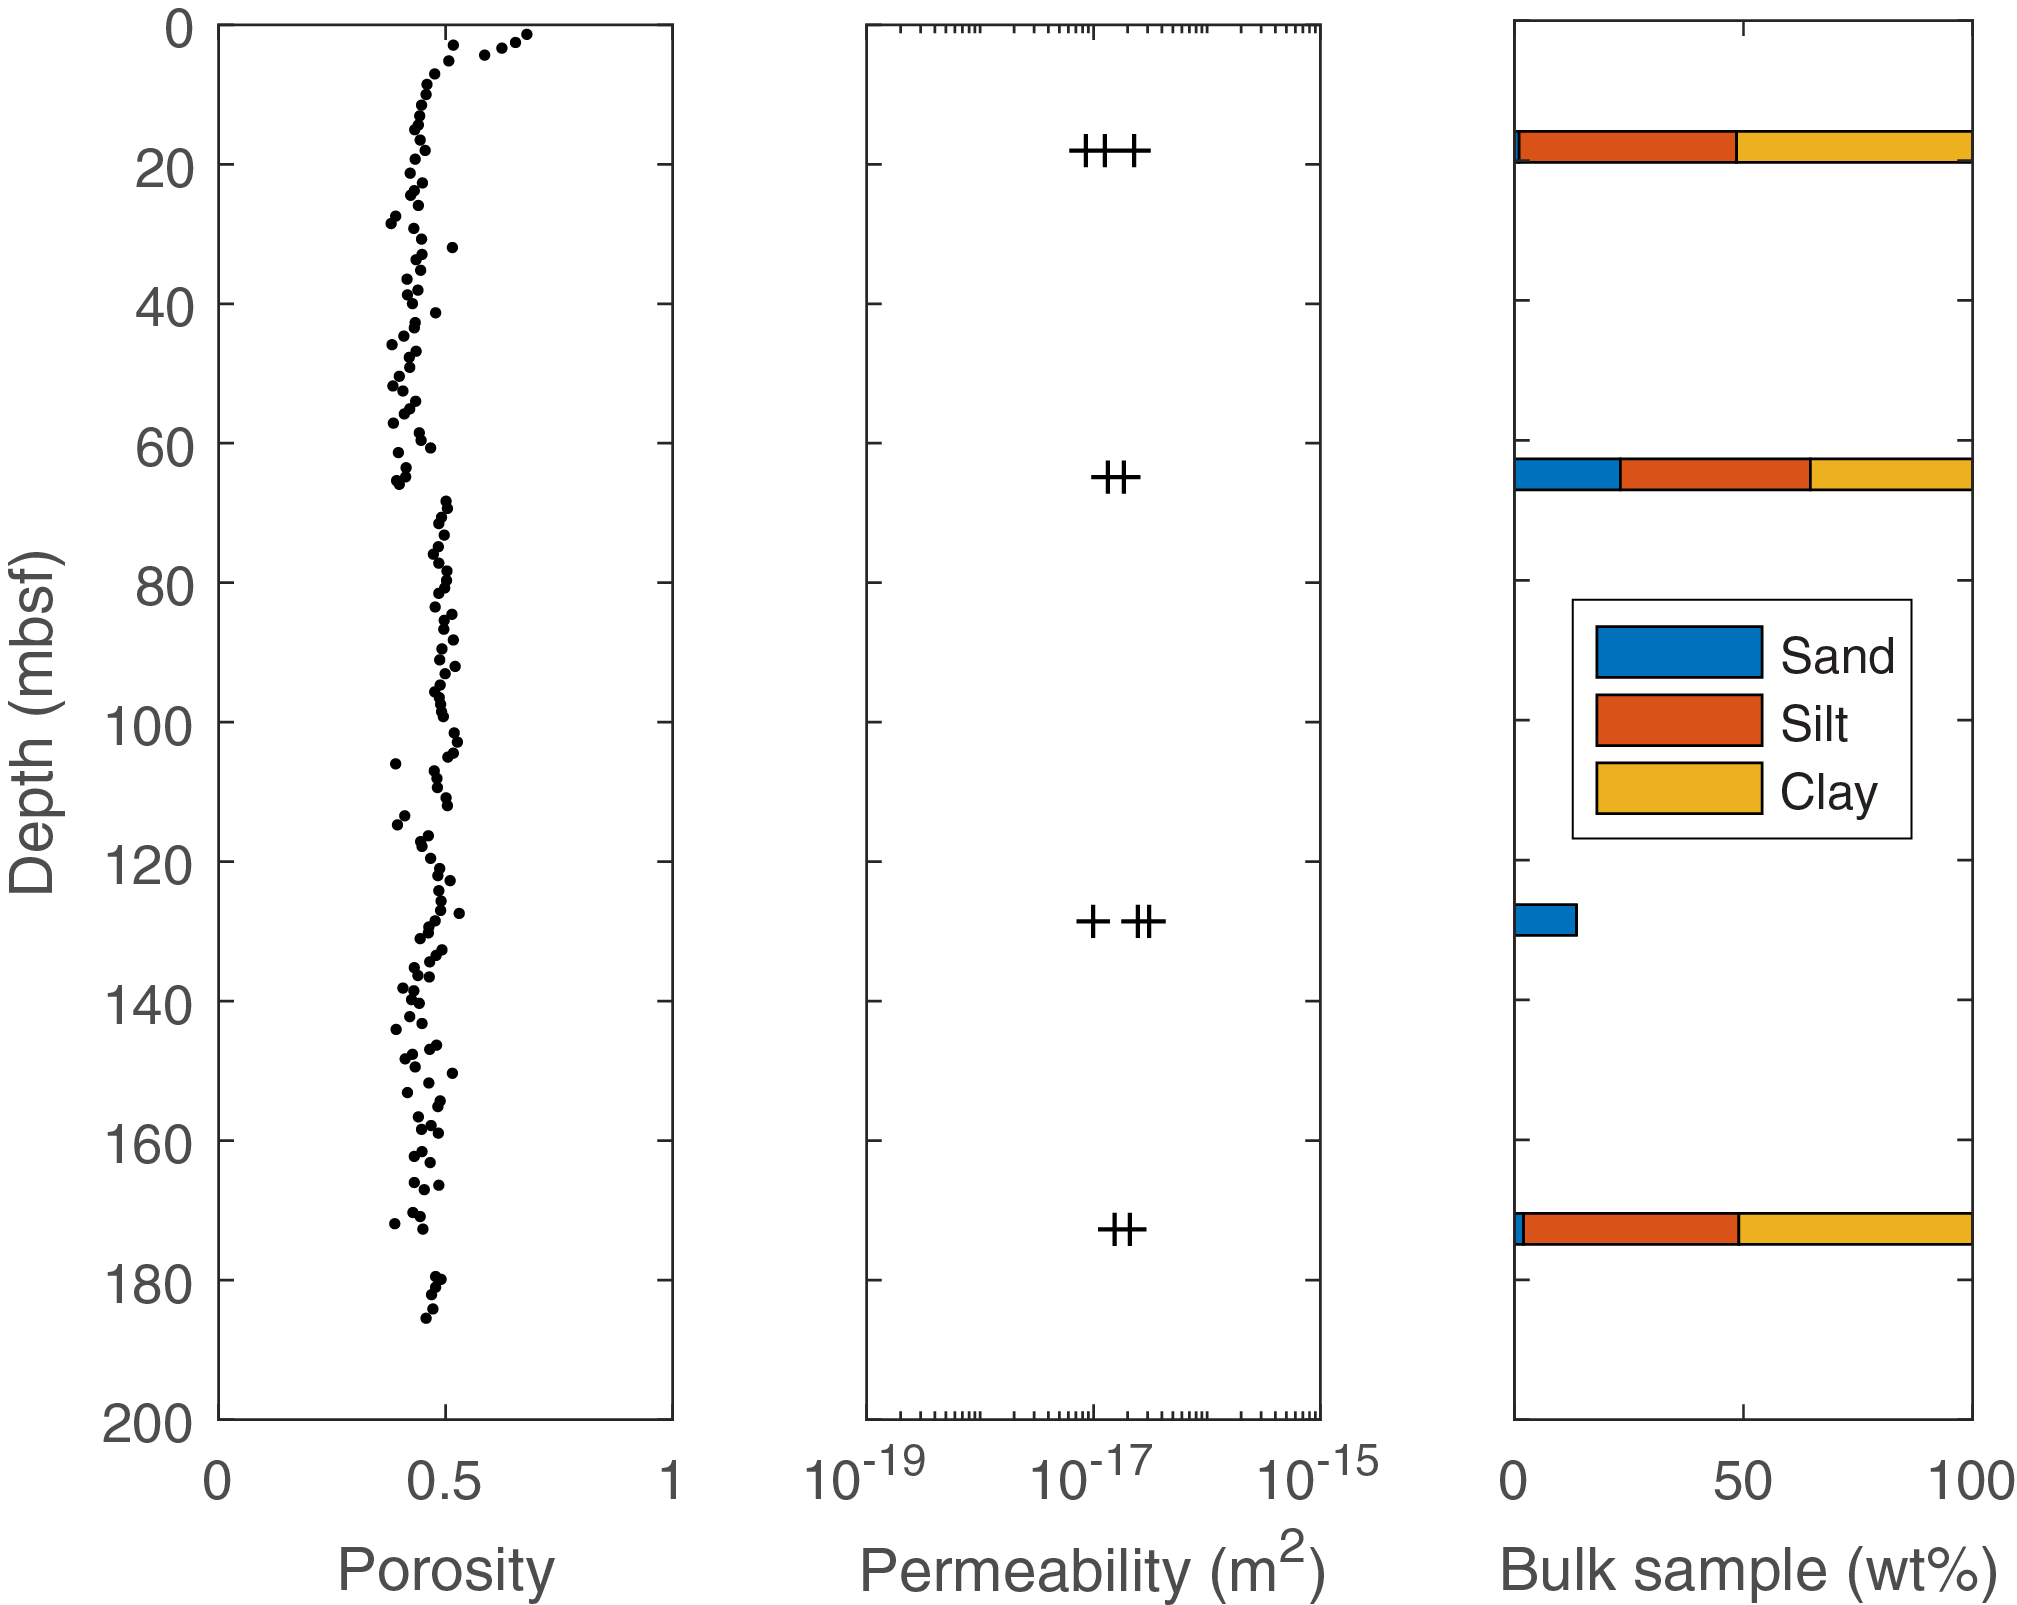
Figure F3. Porosity, permeability, and grain size, Site U1517.
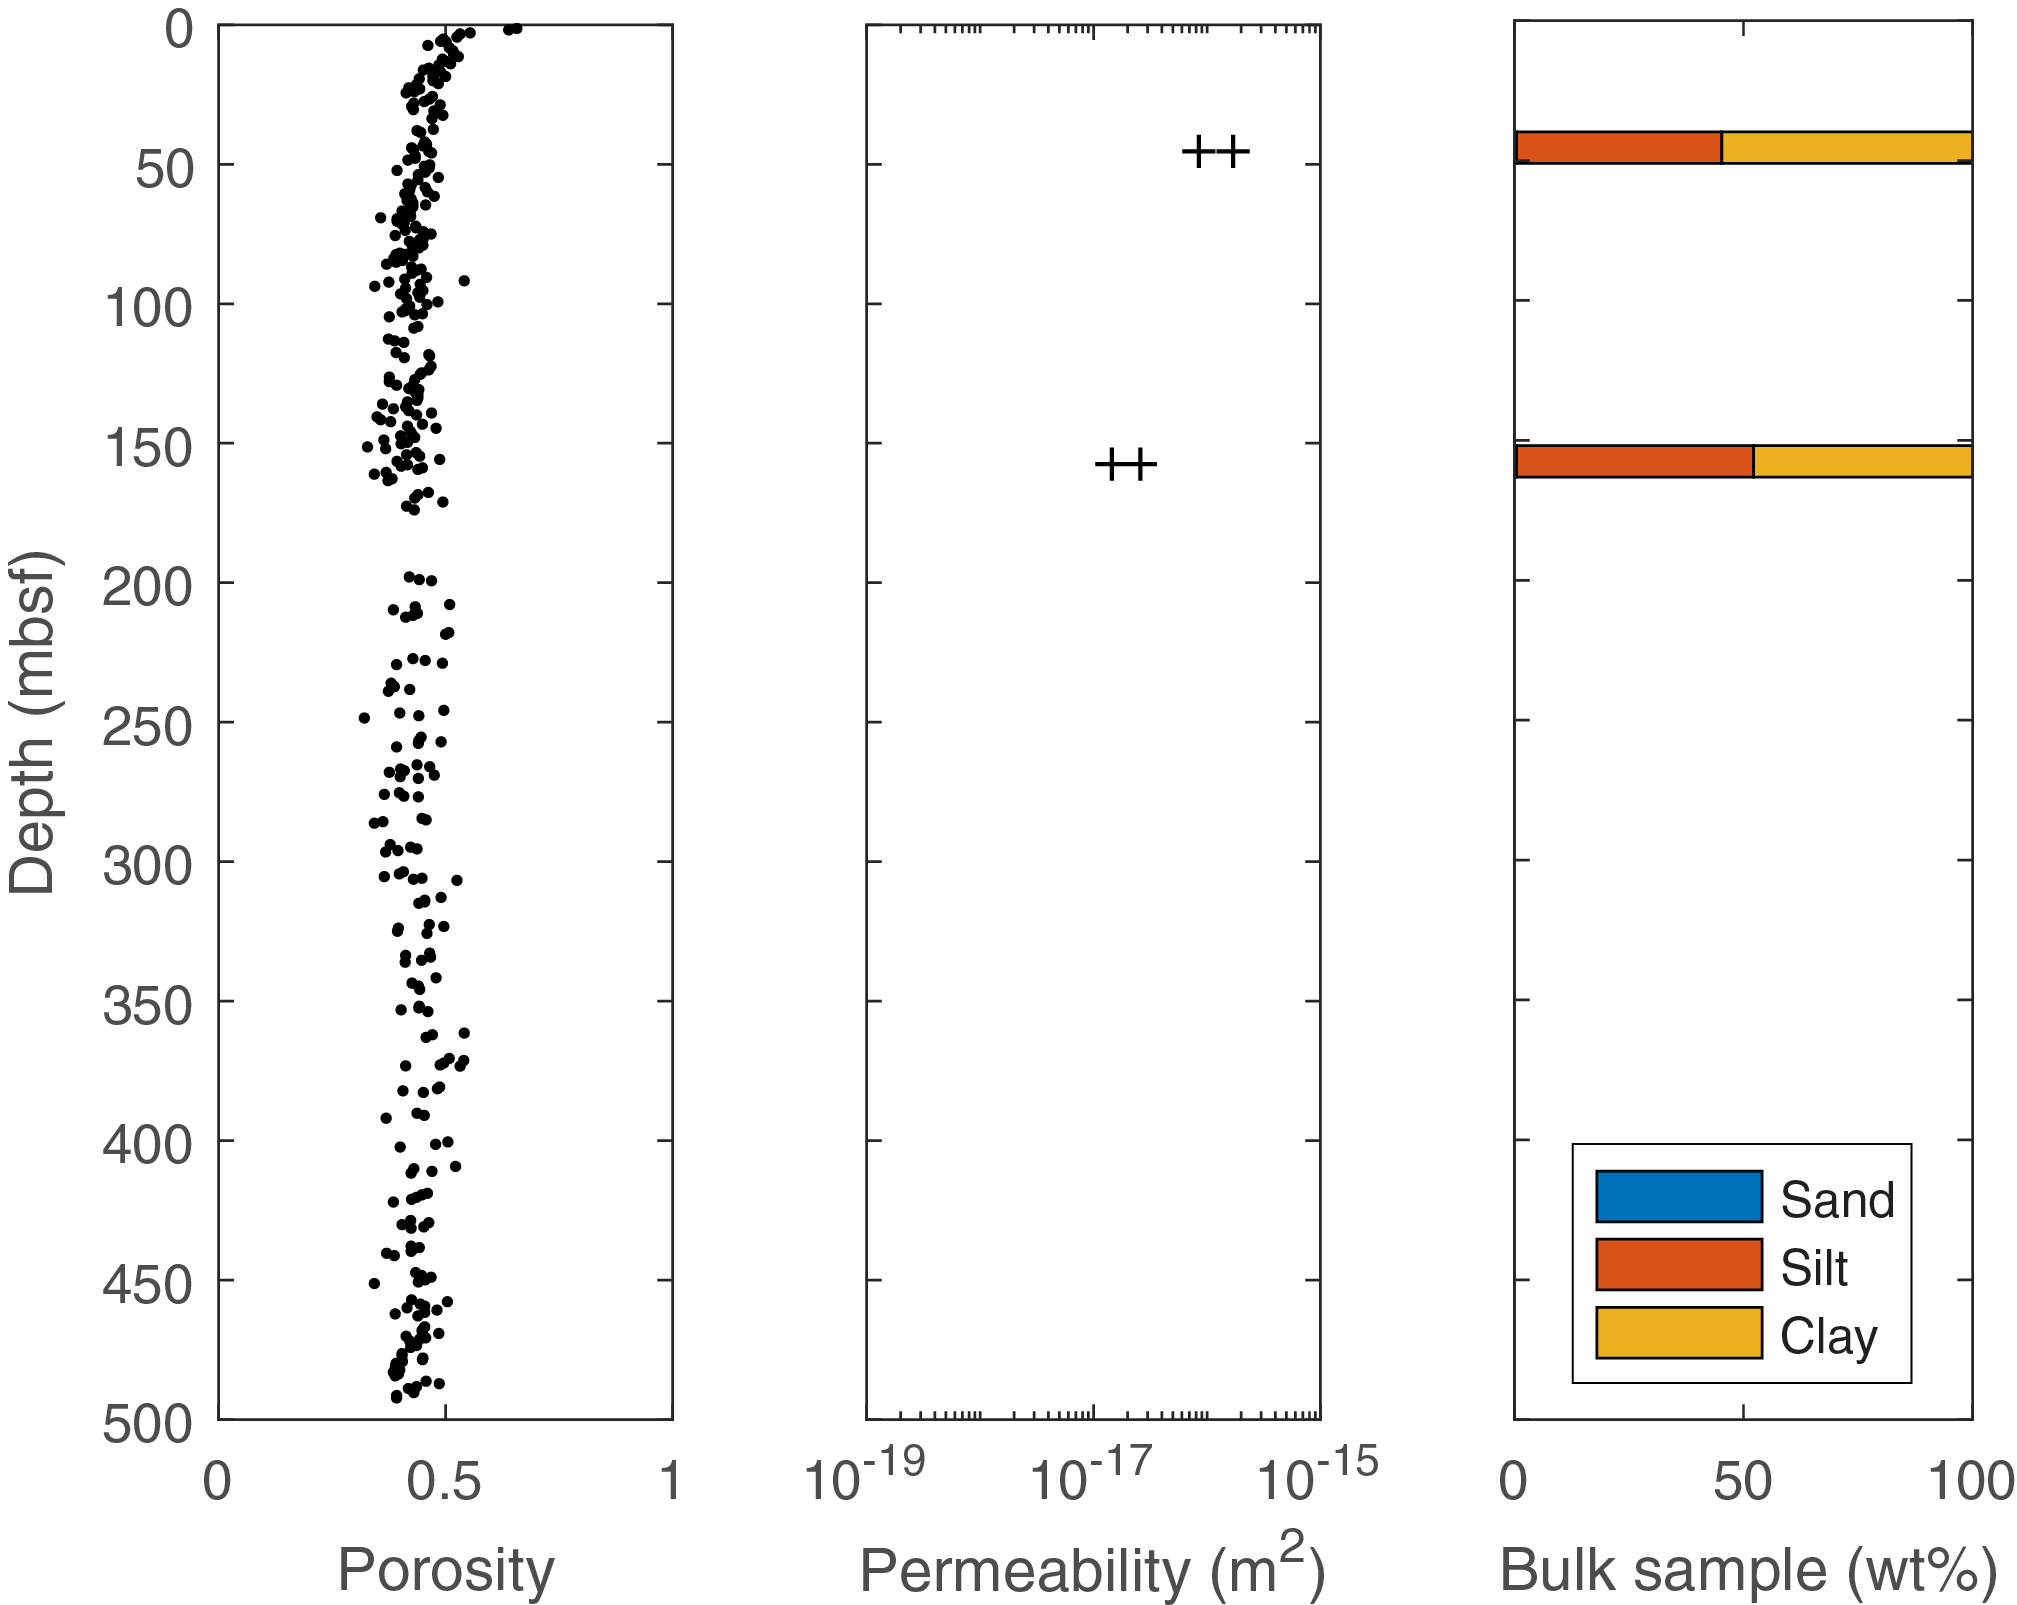
Figure F4. Porosity, permeability, and grain size, Site U1518.
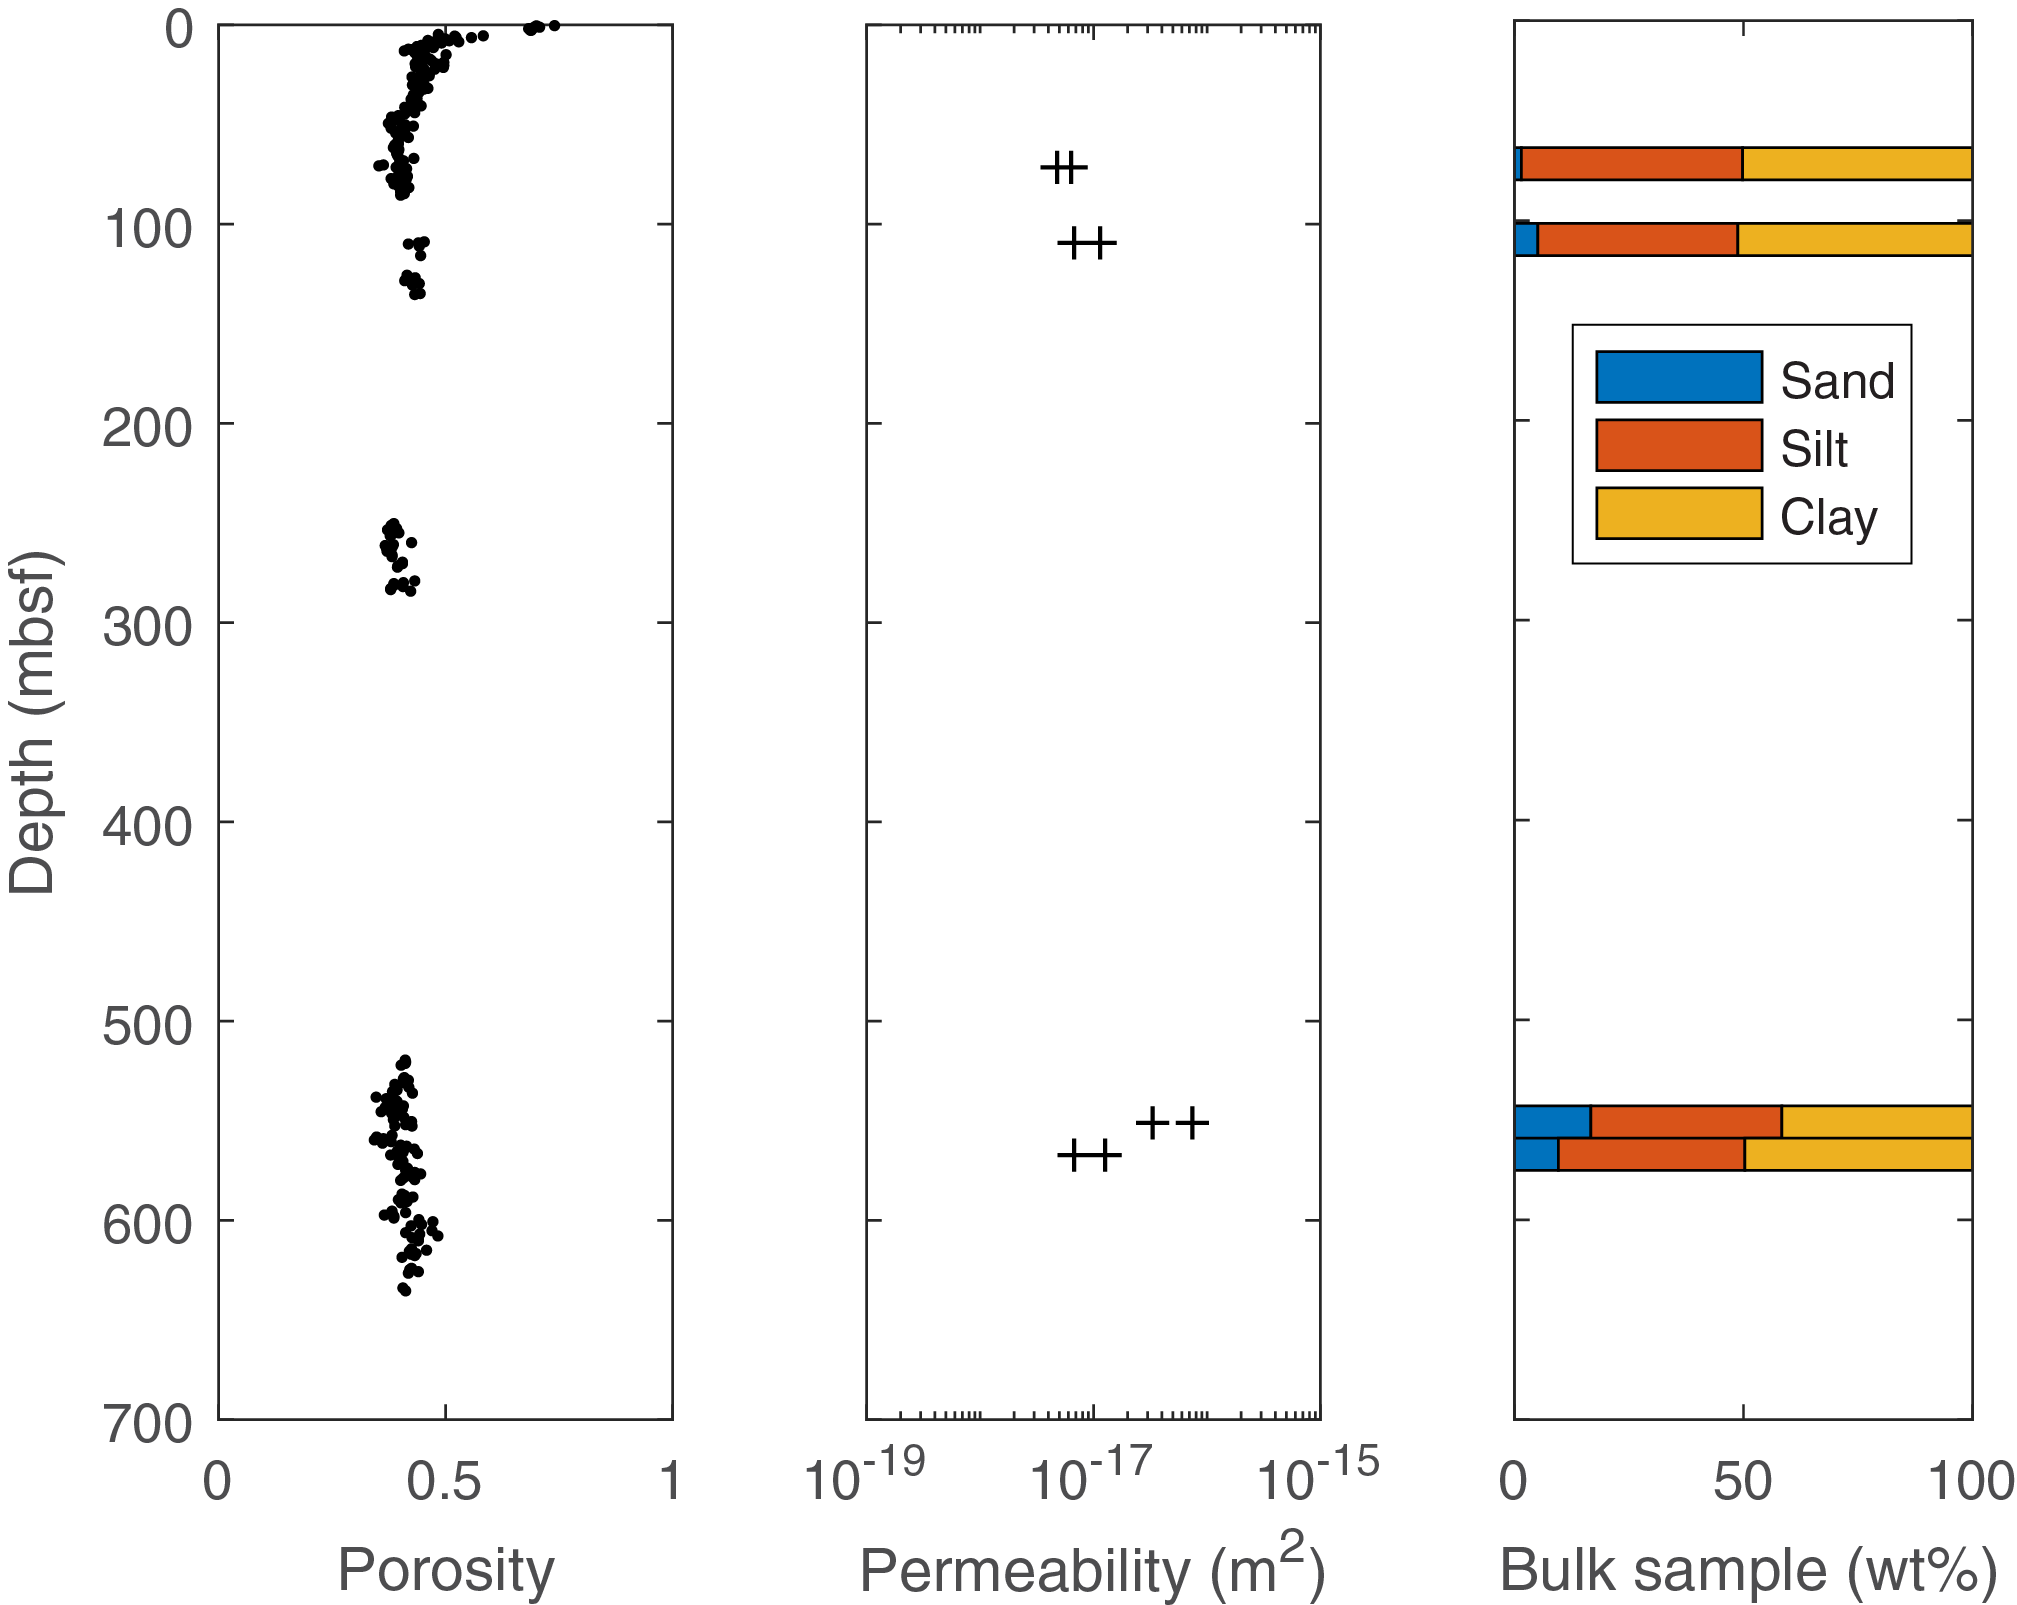
Figure F5. Porosity, permeability, and grain size, Site U1519.
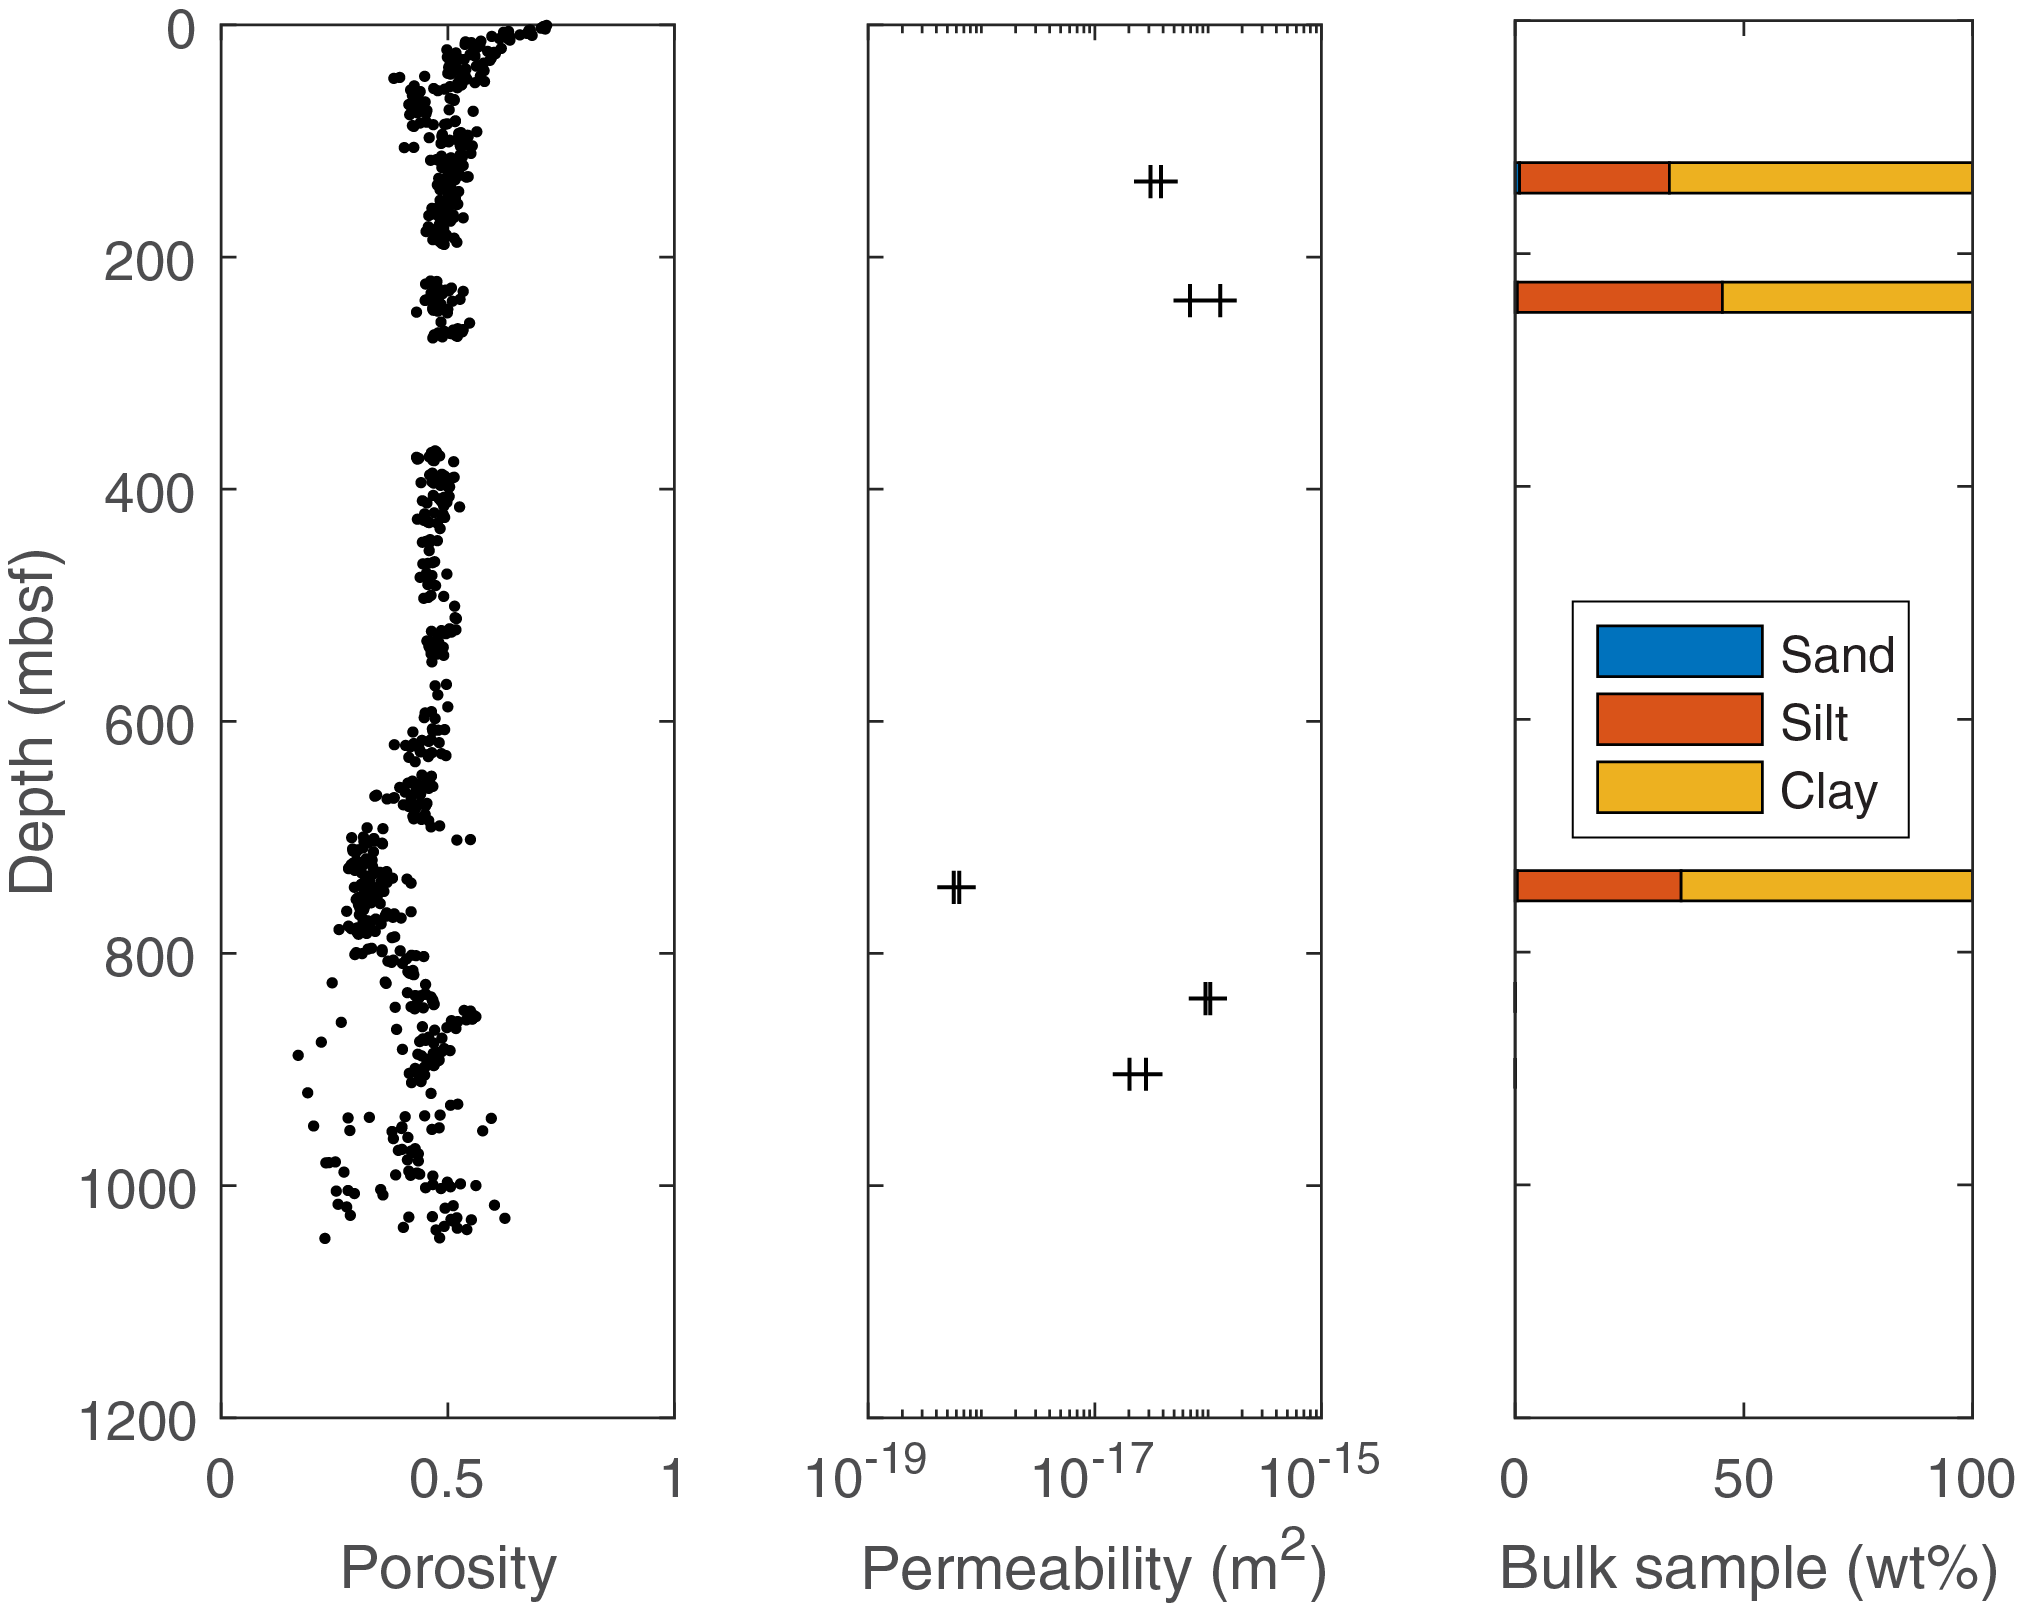
Figure F6. Porosity, permeability, and grain size, Site U1520.
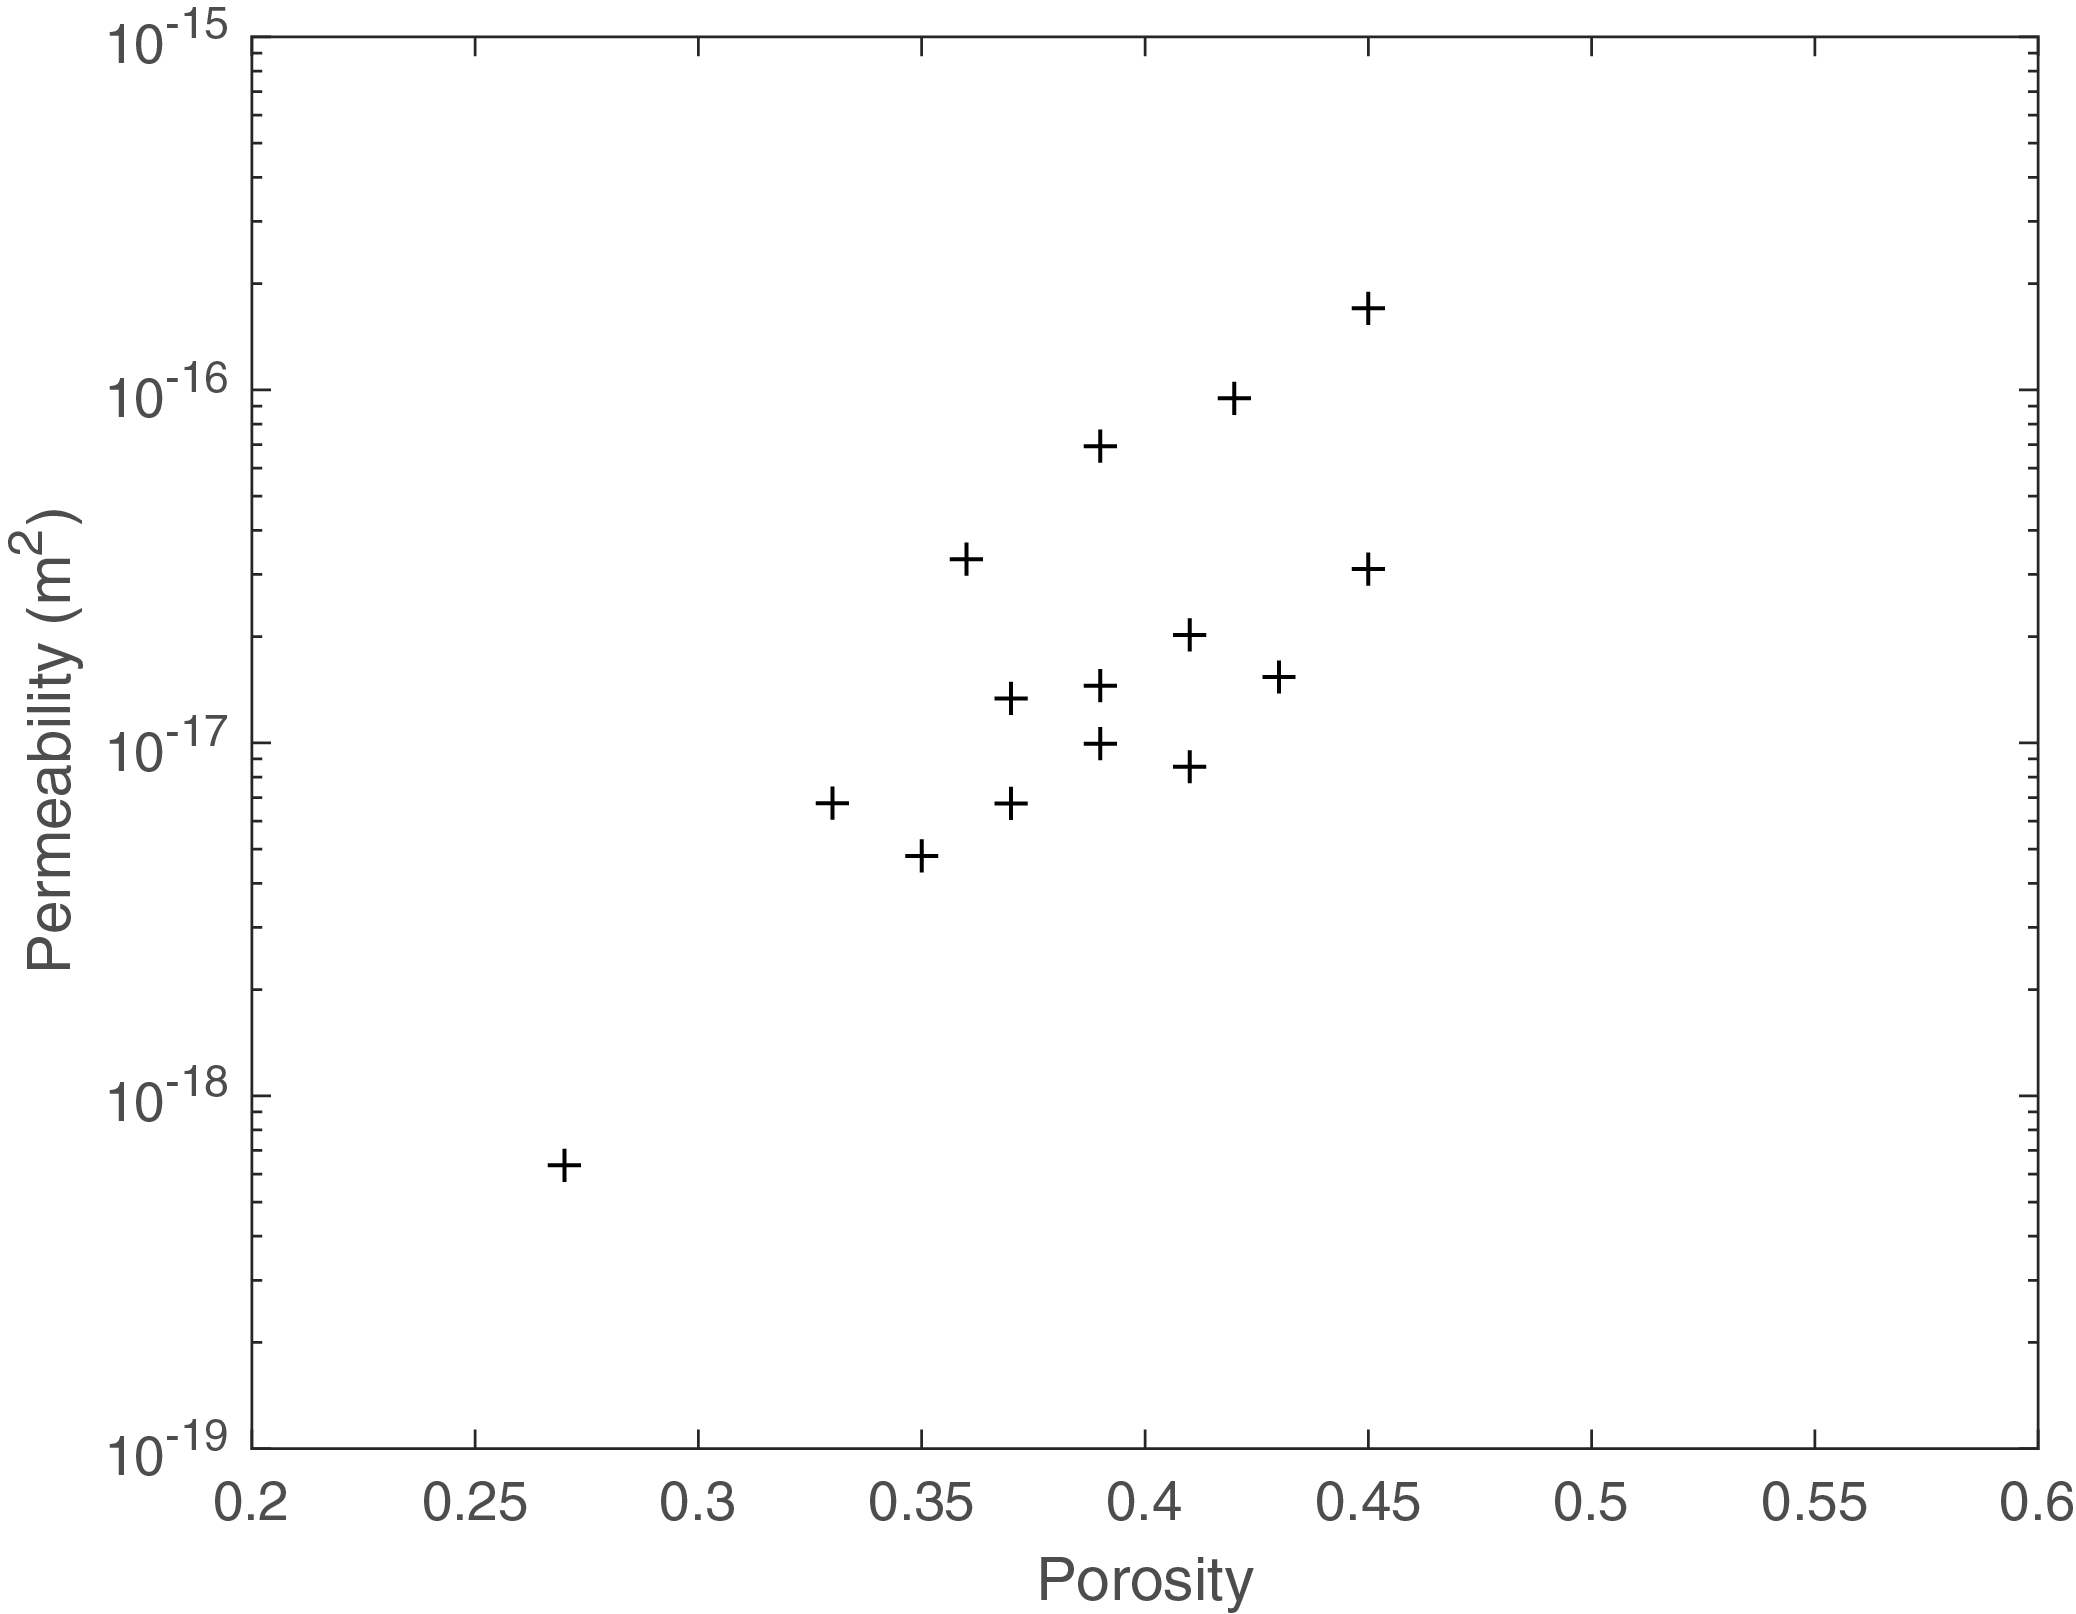
Figure F7. Permeability as a function of porosity.
Acknowledgments
This research used samples and data provided by the International Ocean Discovery Program. Funding for this research was provided by a postcruise grant to E. Screaton from the U.S. Science Support Program. We thank the crew and technical staff of the JOIDES Resolution and the Expedition 372 and 375 scientific parties. Comments from an anonymous reviewer improved this manuscript.
References
ASTM International, 1990. Standard test methods for measurement of hydraulic conductivity of saturated porous materials using a flexible wall permeameter (Standard D5084). In Annual Book of ASTM Standards for Soil and Rock (Volume 04.08): Philadelphia (American Society for Testing Materials).
Barnes, P.M., Pecher, I.A., LeVay, L.J., Bourlange, S.M., Brunet, M.M.Y., Cardona, S., Clennell, M.B., Cook, A.E., Crundwell, M.P., Dugan, B., Elger, J., Gamboa, D., Georgiopoulou, A., Greve, A., Han, S., Heeschen, K.U., Hu, G., Kim, G.Y., Kitajima, H., Koge, H., Li, X., Machado, K.S., McNamara, D.D., Moore, G.F., Mountjoy, J.J., Nole, M.A., Owari, S., Paganoni, M., Petronotis, K.E., Rose, P.S., Screaton, E.J., Shankar, U., Shepherd, C.L., Torres, M.E., Underwood, M.B., Wang, X., Woodhouse, A.D., and Wu, H.-Y., 2019. Expedition 372A summary. In Pecher, I.A., Barnes, P.M., LeVay, L.J., and the Expedition 372A Scientists, Creeping Gas Hydrate Slides. Proceedings of the International Ocean Discovery Program, 372A: College Station, TX (International Ocean Discovery Program). https://doi.org/10.14379/iodp.proc.372A.101.2019
Coakley, J.P., and Syvitski, J.P.M., 1991. SediGraph technique. In Syvitski, J.P.M. (Ed.), Principles, Methods, and Application of Particle Size Analysis: New York (Cambridge University Press), 129–142. https://doi.org/10.1017/CBO9780511626142.013
Daigle, H., and Screaton, E.J., 2015. Evolution of sediment permeability during burial and subduction. Geofluids, 15(1–2):85–105. https://doi.org/10.1111/gfl.12090
James, S.R., and Screaton, E.J., 2015. Data report: permeability of Expedition 344 sediments from the Costa Rica Seismogenesis Project. In Harris, R.N., Sakaguchi, A., Petronotis, K., and the Expedition 344 Scientists, Proceedings of the Integrated Ocean Drilling Program, 344: College Station, TX (Integrated Ocean Drilling Program). https://doi.org/10.2204/iodp.proc.344.202.2015
Ryan, W.B.F., Carbotte, S.M., Coplan, J.O., O'Hara, S., Melkonian, A., Arko, R., Weissel, R.A., Ferrini, V., Goodwillie, A., Nitsche, F., Bonczkowski, J., and Zemsky, R., 2009. Global multi-resolution topography synthesis. Geochemistry, Geophysics, Geosystems, 10:Q03014. https://doi.org/10.1029/2008GC002332
Saffer, D.M., Wallace, L.M., Barnes, P.M., Pecher, I.A., Petronotis, K.E., LeVay, L.J., Bell, R.E., Crundwell, M.P., Engelmann de Oliveira, C.H., Fagereng, A., Fulton, P.M., Greve, A., Harris, R.N., Hashimoto, Y., Hüpers, A., Ikari, M.J., Ito, Y., Kitajima, H., Kutterolf, S., Lee, H., Li, X., Luo, M., Malie, P.R., Meneghini, F., Morgan, J.K., Noda, A., Rabinowitz, H.S., Savage, H.M., Shepherd, C.L., Shreedharan, S., Solomon, E.A., Underwood, M.B., Wang, M., Woodhouse, A.D., Bourlange, S.M., Brunet, M.M.Y., Cardona, S., Clennell, M.B., Cook, A.E., Dugan, B., Elger, J., Gamboa, D., Georgiopoulou, A., Han, S., Heeschen, K.U., Hu, G., Kim, G.Y., Koge, H., Machado, K.S., McNamara, D.D., Moore, G.F., Mountjoy, J.J., Nole, M.A., Owari, S., Paganoni, M., Rose, P.S., Screaton, E.J., Shankar, U., Torres, M.E., Wang, X., and Wu, H.-Y., 2019. Expedition 372B/375 summary. In Wallace, L.M., Saffer, D.M., Barnes, P.M., Pecher, I.A., Petronotis, K.E., LeVay, L.J., and the Expedition 372/375 Scientists, Hikurangi Subduction Margin Coring and Observatories. Proceedings of the International Ocean Discovery Program, 372B/375: College Station, TX (International Ocean Discovery Program). https://doi.org/10.14379/iodp.proc.372B375.101.2019
Sharqawy, M.H., Lienhard, J.H., and Zubair, S.M., 2010. The thermophysical properties of seawater: a review of existing correlations and data. Desalination and Water Treatment, 16:354–380. http://hdl.handle.net/1721.1/69157
Wang, H.F., 2000. Theory of Linear Poroelasticity with Applications to Geomechanics and Hydrogeology: Princeton, New Jersey (Princeton University Press). https://www.jstor.org/stable/j.ctt1jktrr4
1 Screaton, E.J., Summerfield, C., Jaeger, J.M., and Whipple, J., 2021. Data report: permeability and grain size of sediments, IODP Expeditions 372 and 375. In Wallace, L.M., Saffer, D.M., Barnes, P.M., Pecher, I.A., Petronotis, K.E., LeVay, L.J., and the Expedition 372/375 Scientists, Hikurangi Subduction Margin Coring and Observatories. Proceedings of the International Ocean Discovery Program, 372B/375: College Station, TX (International Ocean Discovery Program). https://doi.org/10.14379/iodp.proc.372B375.205.2021
2 Department of Geological Sciences, University of Florida, USA. Correspondence author: [email protected]
This work is distributed under the Creative Commons Attribution 4.0 International (CC BY 4.0) license. 