Wallace, L.M., Saffer, D.M., Barnes, P.M., Pecher, I.A., Petronotis, K.E., LeVay, L.J., and the Expedition 372/375 Scientists
Proceedings of the International Ocean Discovery Program Volume 372B/375
publications.iodp.org
https://doi.org/10.14379/iodp.proc.372B375.211.2024
Data report: permeability, porosity, pore size, grain size, and microporosity of sediments from IODP Expedition 372/375 Sites U1517, U1518, and U15191
Michael Nole2 and Hugh Daigle3
1 Nole, M., and Daigle, H., 2024. Data report: permeability, porosity, pore size, grain size, and microporosity of sediments from IODP Expedition 372/375 Sites U1517, U1518, and U1519. In Wallace, L.M., Saffer, D.M., Barnes, P.M., Pecher, I.A., Petronotis, K.E., LeVay, L.J., and the Expedition 372/375 Scientists, Hikurangi Subduction Margin Coring, Logging, and Observatories. Proceedings of the International Ocean Discovery Program, 372B/375: College Station, TX (International Ocean Discovery Program). https://doi.org/10.14379/iodp.proc.372B375.211.2024
2 Pacific Northwest National Laboratory, USA. Correspondence author: michael.nole@pnnl.gov
3 University of Texas at Austin, USA.
Abstract
Constant rate-of-strain consolidation, nuclear magnetic resonance transverse relaxation time distribution, mercury injection capillary pressure, grain size distribution, and nitrogen adsorption microporosity measurements were performed on 13 whole-round core samples from International Ocean Discovery Program (IODP) Expedition 372/375 along the Hikurangi margin offshore New Zealand. In this report, whole-round core samples were analyzed from three different sites along the Hikurangi margin subduction zone: Sites U1517 and U1519 on the upper slope and Site U1518 near the Hikurangi Trench. All samples were composed of mostly silty clay to clayey silt sediments. Measurements were used to constrain in situ permeability, porosity, pore size distribution, and consolidation characteristics. Across seven samples from Site U1517, in situ permeability of clayey silts ranged 3.0 × 10⁻¹⁷ to 1.5 × 10⁻¹⁵ m2 and median pore sizes ranged 180–246 nm. A transition from overconsolidated to underconsolidated sediments as expressed by the overconsolidation ratio was identified between 50 and 73 meters below seafloor that aligned with the observed base of the Tuaheni Landslide Complex. Across samples at Site U1518, in situ permeability of silty clays ranged 3.7 × 10⁻¹⁶ to 5.5 × 10⁻¹⁵ m2 and median pore sizes ranged 140–320 nm. Across samples at Site U1519, permeability of silty clays ranged 6.4 × 10⁻¹⁶ to 6.0 × 10⁻¹⁴ m2 and median pore sizes ranged 187–300 nm.
1. Introduction
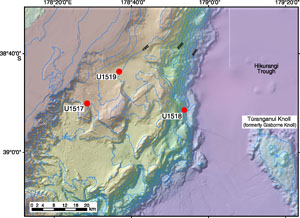
International Ocean Discovery Program (IODP) Expedition 372/375 Sites U1517–U1519 were drilled along the Hikurangi subduction margin offshore New Zealand to study relationships between slow slip events, gas hydrates, and submarine landslides (Figure F1). Logging-while-drilling (LWD) measurements and whole-round core samples were obtained at these sites (Barnes et al., 2019a; Saffer et al., 2019a). The sites cored during Expedition 372/375 include Site U1517 through a submarine landslide complex undergoing slow creep, Site U1518 on the frontal accretionary wedge near the deformation front of the subduction zone, and the landward Site U1519 on the upper continental slope (Pecher et al., 2018).
Site U1517 was selected to obtain data within and beneath an actively creeping landslide within the gas hydrate stability zone (GHSZ), where the abundance and morphology of methane hydrate (i.e., how it occupies pore space) could potentially be affecting landslide behavior. This site sits at approximately 720 m water depth; from previously acquired seismic data, the base of the landslide complex was interpreted to occur at 59 meters below seafloor (mbsf) and the base of the GHSZ was interpreted to occur at 162 mbsf (Mountjoy et al., 2014). The LWD data and shipboard coring were consistent with these interpretations and identified the base of the Tuaheni Landslide Complex (TLC) at 66 mbsf and base of gas hydrate occurrence at 170 mbsf (Barnes et al., 2019b). Physical properties measurements at this site can elucidate the potential for gas hydrate accumulation and methane transport within and beneath the TLC.
At Site U1518, drilling targeted a thrust fault to better understand relationships between shallow faulting and potential fluid flow transients associated with strain propagation from landslide deformation. The site is located at 2630 m water depth; coring and logging identified a main brittle fault at 304 mbsf and a subsidiary fault at approximately 370 mbsf associated with an abrupt change in physical properties (Saffer et al., 2019b). Further physical properties measurements can shed light on the fluid flow properties in and around this fault zone.
Site U1519 on the upper continental slope was selected to characterize physical properties and monitor thermal, hydrologic, and stress state changes in hanging wall sediments above the slow slip event source region. The site is located at 1000 m water depth. LWD was performed to 650 mbsf during Expedition 372; Expedition 375 returned to Site U1519 to complete coring and install a borehole observatory (Barnes et al., 2019c). Physical properties measurements from core samples at this site are important for understanding borehole measurements as well as parameterizing hydrologic and geomechanical models at this site.
2. Methods and materials
Physical properties measurements were performed on a total of seven whole-round core samples from Hole U1517C, three whole-round core samples from Hole U1518E, two whole-round core samples from Hole U1519C, and one whole-round core sample from Hole U1519E. Samples were first taken from the whole-round cores for constant rate-of-strain (CRS) measurements, and then those specimens were subsampled for subsequent measurements. Therefore, lithology is assumed to be consistent between each measurement for a given whole-round core sample. Shipboard measurements were taken immediately adjacent to the whole-round samples, so shipboard measurements are also assumed to be of a lithology that is consistent with the measurements taken from the whole-round cores.
2.1. Constant rate-of-strain consolidation characteristics
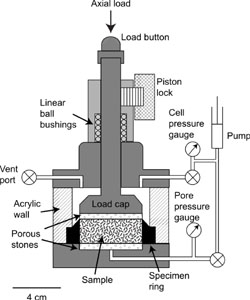
CRS consolidation tests were performed using a GeoTAC Sigma-1 Automated Load Testing System (Figure F2) following American Society for Testing and Materials (ASTM) Standard D4186 (ASTM International, 2007). In this test, samples were confined laterally and exposed to vertical loading from above at a constant strain rate.
Samples were prepared by first extruding them from the core liner and trimming them with a wire saw, followed by fitting the samples into a confining ring to be staged on the equipment. A porous stone was placed between the sample and the loading piston, and filter paper was placed on the bottom of the sample base of the CRS stage to contain the soil during drainage. The system was then closed and pressurized, and data were continuously logged while the piston applied a constant strain rate over time on the sample.
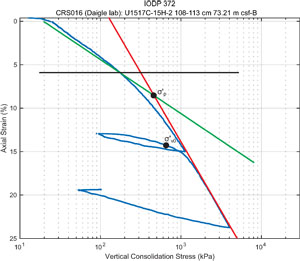
The top of the specimen was exposed to the pressure of the cell, which was pressurized to 56 psi (386 kPa) and held overnight. All specimens were loaded at a strain rate of 0.5%/h to 15% strain. Specimens were then unloaded at a strain rate of 0.5%/h to a limit stress of 5889 psf followed by a creep time of 1080 min. Finally, specimens underwent reloading at a strain rate of 0.5%/h to 25% strain and then unloaded. Pressure at the bottom of the cell and sample height were monitored continuously to produce a stress-strain curve (Figure F3), from which consolidation characteristics were calculated.
Data on sample deformation was used to compute sample permeability as follows:
- k = sample permeability (in m2),
- = strain rate (in s−1),
- H = sample height (in m),
- H0 = initial sample height (in m),
- µ = fluid viscosity (assumed to be 0.001 Pa·s), and
- ΔP = difference between the pore pressure at the base of the sample and the cell pressure.
This equation is only valid when excess pore pressure has built up at the base of the specimen, which was the case for all data reported here.
The graph of the stress-strain curve was used to compute the overconsolidation ratio (OCR) as follows:
where σ′p is the preconsolidation stress and σ′v0 is the in situ overburden stress. The OCR is a ratio of the maximum stress experienced by a soil to its current in situ overburden stress. The maximum stress experienced by the soil sample, σ′p, was determined using the Casagrande graphical method (Casagrande, 1936), and the in situ overburden stress, σ′v0, was determined to be the point at which the sample began to undergo normal consolidation.
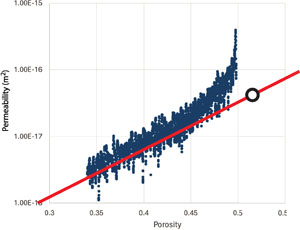
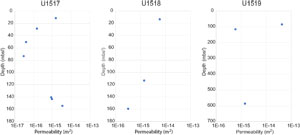
At the end of the test, samples were weighed, oven-dried at 105°C for at least 24 h, and reweighed to determine the sample porosity at the end of the test. Porosity throughout the test was computed by adding the change in volume of the sample to this porosity. A plot of porosity versus permeability during virgin consolidation was used to estimate permeability of the sediments in situ by extrapolating permeability at the shipboard moisture and density (MAD) porosity measurements at these locations (Figure F4).
2.2. Nuclear magnetic resonance T2 distribution
We used 1H nuclear magnetic resonance (NMR) to measure the transverse relaxation time, T2, of the pore fluid in our samples. T2 is the time constant that describes the decay of the transverse component of spin echoes of protons exposed to a pulsed magnetic field. In a single pore, the spin echo amplitude A(t) decays with time as
where A0 is the initial amplitude. In typical sediment pores, the bulk relaxation time due to interactions among protons in the pore fluid is much longer than the measured T2 values, and assuming the measurement is designed to minimize diffusion in internal field gradients between successive magnetic field pulses (Kleinberg and Horsfield, 1990), T2 can be approximated in a cylindrical pore with radius, r, as
where ρ2 is a constant of proportionality called the surface relaxivity, which is related to the concentration of paramagnetic ions on the pore wall. For a porous medium with a distribution of pore sizes, the measured amplitude is
where the subscript i refers to the response in the ith pore. The initial amplitudes are proportional to the volume of pores with the corresponding T2 value and are inverted from the measured signal by regularization (Gallegos and Smith, 1988; Fordham et al., 1995). The result is a volumetrically weighted distribution of T2 values—the T2 distribution—that can be mapped directly to a pore size distribution with some knowledge of the surface relaxivity.
NMR T2 distributions were measured at ambient conditions using an Oxford Instruments GeoSpec2 benchtop 1H NMR device with an operating frequency of 2.14 MHz. A cylindrical sample roughly 5 cm long by 2.5 cm in diameter was cut from the core and wrapped in plastic wrap. Although the plastic wrap contains hydrogen, previous testing has confirmed that the particular brand of plastic wrap we use introduces a negligible amount of extra signal to the measurement (Daigle et al., 2014). The sample was loaded into the NMR instrument and we ran a T2 measurement using a standard Carr-Purcell-Meiboom-Gill (CPMG) pulse sequence (Carr and Purcell, 1954; Meiboom and Gill, 1958) with an echo half-spacing of 0.054 ms, a recycle delay of 7.5 s, and 46,296 echoes acquired. Scans were run until a signal-to-noise ratio of 100 was obtained.
2.3. Mercury injection capillary pressure
Mercury injection capillary pressure (MICP) tests were run with a Micromeritics AutoPore IV instrument. An aliquot of 1–2 g of dried sample (taken from CRS specimens and oven-dried at 105°C for 24 h) was placed in the sample chamber, which was evacuated at the start of the test. Mercury was introduced to the sample chamber in controlled pressure increments with 30 s equilibration time between each step. Intrusion proceeded to 414 MPa (60,000 psia). The data were corrected for conformance following the method described in Daigle et al. (2022). We used Washburn's equation to convert pressure to corresponding pore size:
- r = pore throat radius,
- σHg = interfacial tension between liquid mercury and mercury vapor,
- θHg = contact angle of the liquid mercury-mercury vapor interface on solid grains, and
- PHg = mercury pressure.
We assumed σHg = 0.48 N/m and θHg = 140° (Purcell, 1949).
2.4. Low-pressure nitrogen adsorption
We used a Micromeritics 3Flex surface analyzer to measure surface area and micropore size distribution. An aliquot of 1–2 g of dried sample (taken from CRS specimens and oven-dried at 105°C for 24 h) was placed in a glass sample tube and degassed under a nitrogen stream at 80°C for 4 h. Following this, the sample tubes were connected to the vacuum manifold on the instrument. We measured the free space in each tube using ultrahigh purity helium: once at ambient conditions (23°C) and once immersed in liquid nitrogen (−196°C). These two steps were necessary to characterize the dead volume in the tubes with respect to temperature because the tops of the tubes where they were connected to the vacuum manifold were exposed to ambient air even when the tubes were immersed in liquid nitrogen. Polytetrafluoroethylene (PTFE) sleeves were placed around each tube to minimize heat transfer from the exposed tops of the tubes to the bottoms where the samples were.
Following the free space measurement, the samples tubes were immersed in liquid nitrogen and evacuated. Adsorption measurement proceeded by dosing the tubes with ultrahigh purity nitrogen in prescribed pressure increments with equilibration time between each step (30 s for pressures less than 0.05 atm; 10 s for all other pressures). This process continued to a pressure of 1 atm, after which desorption was measured by stepwise reductions in pressure. Desorption steps were at the same pressures as the adsorption steps but terminated at a pressure of 0.14 atm, which was sufficient to capture adsorption-desorption hysteresis.
The pore size distribution can be determined from the adsorption isotherm because the condensation pressure in a particular pore scales with the pore size. In pores smaller than about 7 nm diameter, there is no analytic expression for pore size as a function of condensation pressure because molecules adsorbed on the pore wall will experience an overlapping interaction field from the opposite pore wall (Lastoskie et al., 1993). Because of the presence of pores of this size in our samples, we used density functional theory (DFT) to determine pore size distribution (Tarazona, 1985a, 1985b). DFT calculates an adsorption isotherm kernel for pores of each size, and the volume distribution of pores is determined by an inversion process that matches the volumetrically weighted sum of the kernels to the measured isotherm.
2.5. Grain size
Grain size measurements were conducted at ambient conditions using a hydrometer following ASTM Standard D422-63 (ASTM International, 2007). We oven-dried trimmings from the CRS tests at 105°C for 24 h and then crushed them to a fine powder using a mortar and pestle. Previous tests in our laboratory have shown that this does not alter the grain size distribution compared to simply soaking the trimmings but greatly reduces the time for disaggregation. Between 20 and 50 g of powder was then mixed with deionized water (Barnstead E-Pure, >17 MΩ·cm) and 5 g of sodium hexametaphosphate deflocculant (Fisher Chemical, laboratory grade) and left to sit for at least 16 h. After this soaking period, we dispersed the samples with a milkshake mixer and poured the mixture into a 1 L glass cylinder. Enough deionized water was then added to make the total volume 1 L. To start the measurement, we agitated the cylinder for 60 s and then measured the density of the mixture as a function of time using ASTM hydrometer 151H. The density is related to the mass fraction of particles remaining in suspension by
- mp = mass fraction of particles remaining in suspension,
- ρs = sediment grain density (in kg/m3),
- V = solution volume (in m3),
- ρ = measured density (in kg/m3),
- ρf = density of the water + sodium hexametaphosphate solution without sediment (in kg/m3), and
- ms = dry sample mass (in kg).
The maximum diameter of particles remaining in suspension is
- D = maximum particle diameter (in m),
- µ = solution fluid viscosity (in Pa·s),
- L = depth to the center of the hydrometer bulb (in m),
- t = time since the start of the test (in s), and
- g = gravitational acceleration (in m2/s).
L varies with solution density and is tabulated in ASTM International (2007). We assumed µ = 0.000961 Pa·s.
2.6. Combining MICP and NMR data
Combining the MICP and NMR data allows the determination of the surface relaxivity, which relates T2 and pore size. However, because the MICP data are affected by pore network connectivity in addition to size distribution (Chatzis and Dullien, 1977), one cannot simply cross correlate the apparent pore size distribution from MICP with the NMR T2 distribution (e.g., Marschall et al., 1995). Daigle and Johnson (2016) developed a method for correlating NMR and MICP data that honors the physics of the MICP process while also correcting the MICP data for the effects of finite percolation cluster size.
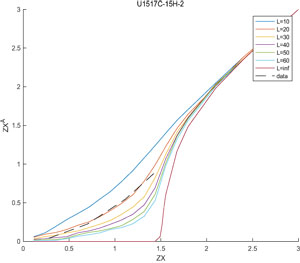
In the bond percolation framework, pores are represented as cylindrical bonds that are connected to each other. Let X be the probability that a particular bond is occupied and XA be the probability that a bond is part of a sample-spanning, percolating cluster of bonds or a cluster of bonds connected to the sample's surface. In the context of an MICP test, X(r) is the volume fraction of pores with radius larger than r and XA(r) is the volume fraction of pores intruded by mercury at the mercury pressure corresponding to r from Washburn's equation. X(r) and XA(r) are universally related to each other by a family of accessibility functions, which are plots of ZXA(r) as a function of ZX(r) where Z is the average pore coordination number (Figure F5); the shape of the accessibility functions depends only on the length of the sample-spanning percolating pore cluster (Mishra and Sharma, 1988; Liu et al., 1993).
In our analysis, Z was determined as 1.5/pc where pc is the percolation threshold (Sahimi, 1993), which we found from the point of minimum slope in the capillary drainage curve. Assuming that the cumulative T2 distribution represents X(r) and the cumulative volume intruded by mercury represents XA(r), we found the values of surface relaxivity and percolating cluster length that gave the best match to an accessibility function through least-squares minimization.
3. Results
3.1. Consolidation characteristics
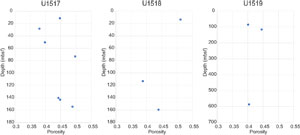
CRS consolidation tests were performed on seven samples from Site U1517, three samples from U1518, and three samples from U1519. Here we report the depth of the top of each sample in meters below seafloor, porosity (ϕ) of soil at that depth from shipboard MAD measurements, measured porosity of the sample after the consolidation test, σ′v0, σ′p, OCR, permeability (k) predicted from extrapolation to the shipboard MAD measured porosity, and measured permeability of the sample. MAD measurements were taken adjacent to whole-round samples, so MAD sample depth and whole-round sample depth are considered to be the same for whole-round and MAD measurements at each sample location. Samples are reported in order of depth beneath the seafloor (see CRS in Supplementary material). Summaries of permeability extrapolated to shipboard MAD porosity and MAD porosity versus depth at each site are reported in Figures F6 and F7.
3.1.1. Site U1517
At Site U1517, there is a clear decrease in permeability between 11.4 and 73.2 mbsf (Table T1). Then, a sharp increase in permeability is observed in sediments at greater depths. These data align with the interpreted thickness of the TLC at this location and coincide roughly with a shift in the OCR from overconsolidated to normally or underconsolidated. Therefore, it is likely that the shallow samples from 11.4 to 73.2 mbsf are all landslide sediments that were transported from their original location of deposition. Because the landslide sediments are mostly overconsolidated, their permeability reflects being exposed to a higher stress state than the underlying soil. There is no clear trend in porosity with depth.
3.1.2. Site U1518
At Site U1518, permeabilities show a generally decreasing trend with depth (Table T2). Permeabilities span roughly an order of magnitude from 3 × 10⁻¹⁶ to over 5 × 10⁻¹⁵ m2 and porosities range 0.38–0.51 between 13.622 and 159.4 mbsf. The shallowest sample appears to be overconsolidated.
3.1.3. Site U1519
At Site U1519, permeabilities roughly decrease with depth (Table T3). Permeabilities span roughly 2 orders of magnitude from 6 × 10⁻¹⁶ to over 4 × 10⁻¹⁴ m2 and porosities range 0.40–0.51 between 85.166 and 115.85 mbsf.
3.2. Mercury injection capillary pressure
3.2.1. Site U1517
MICP measurements were performed on seven samples from Site U1517 (Figure F8). Median pore radius (r50) ranges 160–246 nm, and 90th percentile pore radius (r90) ranges 306 nm to 2.66 µm (Table T4; see MICP in Supplementary material).
3.2.2. Site U1518
MICP measurements were performed on three samples from Site U1518 (Figure F9). Median pore radius (r50) ranges 72–168 nm, and 90th percentile pore size (r90) ranges 156–682 nm (Table T5).
3.2.3. Site U1519
Site U1519 MICP measurements were performed on three samples from Site U1519 (Figure F10). Median pore radius (r50) ranges 90–153 nm, and 90th percentile pore size (r90) ranges 190–259 nm (Table T6).
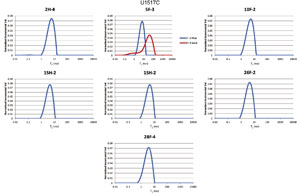
3.3. NMR
Using the method of Daigle and Johnson (2016), surface relaxivities were derived for all samples to correlate T2 distribution to grain size (see NMR in Supplementary material).
3.3.1. Site U1517
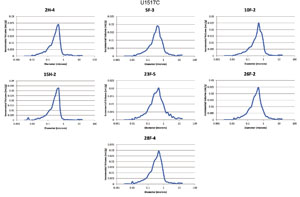
NMR measurements were performed on seven samples from Site U1517 (Figure F11). For Sample 372-U1517C-5F-3, a sand unit in the core sample was also present and NMR measurements were run on the mud and sand separately. NMR-derived median pore radius ranges 115–161 nm at Site U1517, and 90th percentile pore radius ranges 240–320 nm (Table T4). NMR generally shows smaller pore sizes than MICP, and this trend is consistent across all samples in this analysis.
3.3.2. Site U1518
NMR measurements were performed on three samples from Site U1518 (Figure F12). NMR-derived median pore radius ranges 38–61 nm at Site U1518, and 90th percentile pore radius ranges 81–139 nm (Table T5). NMR generally shows smaller pore sizes than MICP, and this trend is consistent across all samples in this analysis.
3.3.3. Site U1519
NMR measurements were performed on three samples from Site U1519 (Figure F13). Using the method of Daigle and Johnson (2016), surface relaxivities were derived for all samples to correlate T2 distribution to grain size. NMR-derived median pore radius ranges 43–102 nm at Site U1519, and 90th percentile pore radius ranges 104–203 nm (Table T6). NMR generally shows smaller pore sizes than MICP, and this trend is consistent across all samples in this analysis.
3.4. Grain size
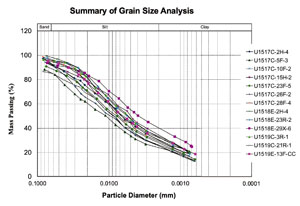
Grain size measurements were obtained on all seven samples from Site U1517, all three samples from Site U1518, and all three samples from Site U1519 (Figure F14; Table T7). Most samples fall between silty clay or clayey silt categorization from grain size analysis, which is consistent with pore size distribution analyses (see GRAINSIZE in Supplementary material).
3.5. N2 adsorption
Nitrogen adsorption measurements indicate consistent percentages of microporosity across all samples, ranging 0.5%–1.4% (Table T7; see GASSORPTION in Supplementary material).
4. Conclusions
We performed a suite of physical properties measurements on 13 whole-round core samples from Expedition 372/375 along the Hikurangi margin offshore New Zealand. These measurements included CRS consolidation, NMR T2 distribution, MICP, grain size distribution, and nitrogen adsorption microporosity. We found the most variability in permeability with depth at Site U1517, where samples were taken within and below the TLC. CRS consolidation data suggest a transition from overconsolidated to underconsolidated across the base of the landslide complex. Nearly all samples were composed of silty clay to clayey silt with typical grain size and pore size distributions consistent with these lithologies.
5. Acknowledgments
This work was performed on samples provided by the International Ocean Discovery Program (IODP) Expeditions 372 and 375. Funding for this work was provided by a postexpedition grant from the U.S. Science Support Program (USSSP). We would like to thank the crew and science parties of Expeditions 372 and 375. The Pacific Northwest National Laboratory is operated for the U.S. Department of Energy by Battelle Memorial Institute under Contract DE‐AC05‐76RL01830. This paper describes objective technical results and analysis. Any subjective views or opinions that might be expressed in the paper do not necessarily represent the views of the U.S. Department of Energy or the United States Government.
References
ASTM International, 2007. Standard test method for particle-size analysis of soils (Standard D422-63[2007]). In Annual Book of ASTM Standards (Vol. 04.08): West Conshohocken, PA (ASTM International). https://doi.org/10.1520/D0422-63R07
Barnes, P.M., Pecher, I.A., LeVay, L.J., Bourlange, S.M., Brunet, M.M.Y., Cardona, S., Clennell, M.B., Cook, A.E., Crundwell, M.P., Dugan, B., Elger, J., Gamboa, D., Georgiopoulou, A., Greve, A., Han, S., Heeschen, K.U., Hu, G., Kim, G.Y., Kitajima, H., Koge, H., Li, X., Machado, K.S., McNamara, D.D., Moore, G.F., Mountjoy, J.J., Nole, M.A., Owari, S., Paganoni, M., Petronotis, K.E., Rose, P.S., Screaton, E.J., Shankar, U., Shepherd, C.L., Torres, M.E., Underwood, M.B., Wang, X., Woodhouse, A.D., and Wu, H.-Y., 2019a. Expedition 372A summary. In Pecher, I.A., Barnes, P.M., LeVay, L.J., and the Expedition 372A Scientists, Creeping Gas Hydrate Slides. Proceedings of the International Ocean Discovery Program, 372A: College Station, TX (International Ocean Discovery Program). https://doi.org/10.14379/iodp.proc.372A.101.2019
Barnes, P.M., Pecher, I.A., LeVay, L.J., Bourlange, S.M., Brunet, M.M.Y., Cardona, S., Clennell, M.B., Cook, A.E., Crundwell, M.P., Dugan, B., Elger, J., Gamboa, D., Georgiopoulou, A., Greve, A., Han, S., Heeschen, K.U., Gaowei, H., Kim, G.Y., Kitajima, H., Koge, H., Xuesen, L., Machado, K.S., McNamara, D.D., Moore, G.F., Mountjoy, J.J., Nole, M.A., Owari, S., Paganoni, M., Petronotis, K.E., Rose, P.S., Screaton, E.J., Shankar, U., Shepherd, C.L., Torres, M.E., Underwood, M.B., Xiujuan, W., Woodhouse, A.D., and Wu, H.-Y., 2019b. Site U1517. In Pecher, I.A., Barnes, P.M., LeVay, L.J., and the Expedition 372A Scientists, Creeping Gas Hydrate Slides. Proceedings of the International Ocean Discovery Program, 372A: College Station, TX (International Ocean Discovery Program). https://doi.org/10.14379/iodp.proc.372A.103.2019
Barnes, P.M., Wallace, L.M., Saffer, D.M., Pecher, I.A., Petronotis, K.E., LeVay, L.J., Bell, R.E., Crundwell, M.P., Engelmann de Oliveira, C.H., Fagereng, A., Fulton, P.M., Greve, A., Harris, R.N., Hashimoto, Y., Hüpers, A., Ikari, M.J., Ito, Y., Kitajima, H., Kutterolf, S., Lee, H., Li, X., Luo, M., Malie, P.R., Meneghini, F., Morgan, J.K., Noda, A., Rabinowitz, H.S., Savage, H.M., Shepherd, C.L., Shreedharan, S., Solomon, E.A., Underwood, M.B., Wang, M., Woodhouse, A.D., Bourlange, S.M., Brunet, M.M.Y., Cardona, S., Clennell, M.B., Cook, A.E., Dugan, B., Elger, J., Gamboa, D., Georgiopoulou, A., Han, S., Heeschen, K.U., Hu, G., Kim, G.Y., Koge, H., Machado, K.S., McNamara, D.D., Moore, G.F., Mountjoy, J.J., Nole, M.A., Owari, S., Paganoni, M., Rose, P.S., Screaton, E.J., Shankar, U., Torres, M.E., Wang, X., and Wu, H.-Y., 2019c. Site U1519. In Wallace, L.M., Saffer, D.M., Barnes, P.M., Pecher, I.A., Petronotis, K.E., LeVay, L.J., and the Expedition 372/375 Scientists, Hikurangi Subduction Margin Coring, Logging, and Observatories. Proceedings of the International Ocean Discovery Program, 372B/375: College Station, TX (International Ocean Discovery Program). https://doi.org/10.14379/iodp.proc.372B375.104.2019
Carr, H.Y., and Purcell, E.M., 1954. Effects of diffusion on free precession in nuclear magnetic resonance experiments. Physical Review, 94(3):630–638. https://doi.org/10.1103/PhysRev.94.630
Casagrande, A., 1936. The determination of the preconsolidation load and its practical significance. Proceedings of the First International Conference on Soil Mechanics and Foundation Engineering:3–60.
Chatzis, I., and Dullien, F.A.L., 1977. Modelling pore structure by 2-D and 3-D networks with application to sandstones. Journal of Canadian Petroleum Technology, 16(01). https://doi.org/10.2118/77-01-09
Daigle, H., Fang, Y., Phillips, S.C., and Flemings, P.B., 2022. Pore structure of sediments from Green Canyon 955 determined by mercury intrusion. AAPG Bulletin, 106(5):1051–1069. https://doi.org/10.1306/02262120123
Daigle, H., and Johnson, A., 2016. Combining mercury intrusion and nuclear magnetic resonance measurements using percolation theory. Transport in Porous Media, 111(3):669–679. https://doi.org/10.1007/s11242-015-0619-1
Daigle, H., Thomas, B., Rowe, H., and Nieto, M., 2014. Nuclear magnetic resonance characterization of shallow marine sediments from the Nankai Trough, Integrated Ocean Drilling Program Expedition 333. Journal of Geophysical Research: Solid Earth, 119(4):2631–2650. https://doi.org/10.1002/2013JB010784
Fordham, E.J., Sezginer, A., and Hall, L.D., 1995. Imaging multiexponential relaxation in the (y, LogeT1) plane, with application to clay filtration in rock cores. Journal of Magnetic Resonance, Series A, 113(2):139–150. https://doi.org/10.1006/jmra.1995.1073
Gallegos, D.P., and Smith, D.M., 1988. A NMR technique for the analysis of pore structure: determination of continuous pore size distributions. Journal of Colloid and Interface Science, 122(1):143–153. https://doi.org/10.1016/0021-9797(88)90297-4
Kleinberg, R.L., and Horsfield, M.A., 1990. Transverse relaxation processes in porous sedimentary rock. Journal of Magnetic Resonance (1969), 88(1):9–19. https://doi.org/10.1016/0022-2364(90)90104-H
Lastoskie, C., Gubbins, K.E., and Quirke, N., 1993. Pore size distribution analysis of microporous carbons: a density functional theory approach. The Journal of Physical Chemistry, 97(18):4786–4796. https://doi.org/10.1021/j100120a035
Liu, H., Zhang, L., and Seaton, N.A., 1993. Analysis of sorption hysteresis in mesoporous solids using a pore network model. Journal of Colloid and Interface Science, 156(2):285–293. https://doi.org/10.1006/jcis.1993.1113
Marschall, D., Gardner, J.S., Mardon, D., and Coates, G.R., 1995. Method for correlating NMR relaxometry and mercury injection data. Presented at the Society of Core Analysts Conference 1995, San Francisco, CA. https://www.jgmaas.com/SCA/1995/SCA1995-11.pdf
Meiboom, S., and Gill, D., 1958. Modified spin‐echo method for measuring nuclear relaxation times. Review of Scientific Instruments, 29(8):688–691. https://doi.org/10.1063/1.1716296
Mishra, B.K., and Sharma, M.M., 1988. Measurement of pore size distributions from capillary pressure curves. AIChE Journal, 34(4):684–687. https://doi.org/10.1002/aic.690340420
Mountjoy, J.J., Pecher, I., Henrys, S., Crutchley, G., Barnes, P.M., and Plaza-Faverola, A., 2014. Shallow methane hydrate system controls ongoing, downslope sediment transport in a low-velocity active submarine landslide complex, Hikurangi Margin, New Zealand. Geochemistry, Geophysics, Geosystems, 15(11):4137–4156. https://doi.org/10.1002/2014GC005379
Nole, M., and Daigle, H., 2024. Supplementary material, https://doi.org/10.14379/iodp.proc.372B375.211supp.2024. In Nole, M., and Daigle, H., Data report: permeability, porosity, pore size, grain size, and microporosity of sediments from IODP Expedition 372/375 Sites U1517, U1518, and U1519. In Wallace, L.M., Saffer, D.M., Barnes, P.M., Pecher, I.A., Petronotis, K.E., LeVay, L.J., and the Expedition 372/375 Scientists, Hikurangi Subduction Margin Coring, Logging, and Observatories. Proceedings of the International Ocean Discovery Program, 372B/375: College Station, TX (International Ocean Discovery Program).
Pecher, I.A., Barnes, P.M., LeVay, L.J., and the Expedition 372 Scientists, 2018. Expedition 372 Preliminary Report: Creeping Gas Hydrate Slides and Hikurangi LWD: College Station, TX, United States https://doi.org/10.14379/iodp.pr.372.2018
Purcell, W.R., 1949. Capillary pressures - their measurement using mercury and the calculation of permeability therefrom. Journal of Petroleum Technology, 1(02):39–48. https://doi.org/10.2118/949039-G
Saffer, D.M., Wallace, L.M., Barnes, P.M., Pecher, I.A., Petronotis, K.E., LeVay, L.J., Bell, R.E., Crundwell, M.P., Engelmann de Oliveira, C.H., Fagereng, A., Fulton, P.M., Greve, A., Harris, R.N., Hashimoto, Y., Hüpers, A., Ikari, M.J., Ito, Y., Kitajima, H., Kutterolf, S., Lee, H., Li, X., Luo, M., Malie, P.R., Meneghini, F., Morgan, J.K., Noda, A., Rabinowitz, H.S., Savage, H.M., Shepherd, C.L., Shreedharan, S., Solomon, E.A., Underwood, M.B., Wang, M., Woodhouse, A.D., Bourlange, S.M., Brunet, M.M.Y., Cardona, S., Clennell, M.B., Cook, A.E., Dugan, B., Elger, J., Gamboa, D., Georgiopoulou, A., Han, S., Heeschen, K.U., Hu, G., Kim, G.Y., Koge, H., Machado, K.S., McNamara, D.D., Moore, G.F., Mountjoy, J.J., Nole, M.A., Owari, S., Paganoni, M., Rose, P.S., Screaton, E.J., Shankar, U., Torres, M.E., Wang, X., and Wu, H.-Y., 2019a. Expedition 372B/375 summary. In Wallace, L.M., Saffer, D.M., Barnes, P.M., Pecher, I.A., Petronotis, K.E., LeVay, L.J., and the Expedition 372/375 Scientists, Hikurangi Subduction Margin Coring, Logging, and Observatories. Proceedings of the International Ocean Discovery Program, 372B/375: College Station, TX (Proceedings of the International Ocean Discovery Program). https://doi.org/10.14379/iodp.proc.372B375.101.2019
Saffer, D.M., Wallace, L.M., Barnes, P.M., Pecher, I.A., Petronotis, K.E., LeVay, L.J., Bell, R.E., Crundwell, M.P., Engelmann de Oliveira, C.H., Fagereng, A., Fulton, P.M., Greve, A., Harris, R.N., Hashimoto, Y., Hüpers, A., Ikari, M.J., Ito, Y., Kitajima, H., Kutterolf, S., Lee, H., Li, X., Luo, M., Malie, P.R., Meneghini, F., Morgan, J.K., Noda, A., Rabinowitz, H.S., Savage, H.M., Shepherd, C.L., Shreedharan, S., Solomon, E.A., Underwood, M.B., Wang, M., Woodhouse, A.D., Bourlange, S.M., Brunet, M.M.Y., Cardona, S., Clennell, M.B., Cook, A.E., Dugan, B., Elger, J., Gamboa, D., Georgiopoulou, A., Han, S., Heeschen, K.U., Hu, G., Kim, G.Y., Koge, H., Machado, K.S., McNamara, D.D., Moore, G.F., Mountjoy, J.J., Nole, M.A., Owari, S., Paganoni, M., Rose, P.S., Screaton, E.J., Shankar, U., Torres, M.E., Wang, X., and Wu, H.-Y., 2019b. Site U1518. In Wallace, L.M., Saffer, D.M., Barnes, P.M., Pecher, I.A., Petronotis, K.E., LeVay, L.J., and the Expedition 372/375 Scientists, Hikurangi Subduction Margin Coring, Logging, and Observatories. Proceedings of the International Ocean Discovery Program, 372B/375: College Station, TX (International Ocean Discovery Program). https://doi.org/10.14379/iodp.proc.372B375.103.2019
Sahimi, M., 1993. Applications of Percolation Theory: Bristol, England (Taylor and Francis). https://doi.org/10.1007/978-3-031-20386-2
Tarazona, P., 1985a. Free-energy density functional for hard spheres. Physical Review A, 31(4):2672–2679. https://doi.org/10.1103/PhysRevA.31.2672
Tarazona, P., 1985b. Erratum: free-energy density functional for hard spheres. Physical Review A, 32(5):3148. https://doi.org/10.1103/PhysRevA.32.3148
