Weber, M.E., Raymo, M.E., Peck, V.L., Williams, T., and the Expedition 382 Scientists
Proceedings of the International Ocean Discovery Program Volume 382
publications.iodp.org
Data report: using XRF scanning–derived grain size analysis for rapid assessment of bottom current velocities on long drill cores from the southern Scotia Sea, IODP Expedition 3821
Thomas A. Ronge2 and Sharon Dbritto3
1 Ronge, T.A., and Dbritto, S., 2024. Data report: using XRF scanning–derived grain size analysis for rapid assessment of bottom current velocities on long drill cores from the southern Scotia Sea, IODP Expedition 382. In Weber, M.E., Raymo, M.E., Peck, V.L., Williams, T., and the Expedition 382 Scientists, Iceberg Alley and Subantarctic Ice and Ocean Dynamics. Proceedings of the International Ocean Discovery Program, 382: College Station, TX (International Ocean Discovery Program). https://doi.org/10.14379/iodp.proc.382.201.2024
2 International Ocean Discovery Program, Texas A&M University, USA. Correspondence author: ronge@iodp.tamu.edu
3 FB5 Geosciences, Bremen University, Germany.
Abstract
Past bottom current velocities are usually determined from the sortable silt (SS) fraction of sediments. This method yields precise results, but the work associated with the preparation for and analysis of SS is very time consuming. Using data and samples from Site U1537, which was drilled during International Ocean Discovery Program (IODP) Expedition 382 (Iceberg Alley and Subantarctic Ice and Ocean Dynamics), we followed a method that allows for the reconstruction of bottom current velocities on long and highly resolved sediment records, as typically recovered during an IODP expedition. Here, we present discrete measurements of SS from Site U1537 that were used to convert X-ray fluorescence (XRF) core scanner Zr/Rb data into SS and ultimately into bottom current velocities. The use of XRF-derived SS data and current speeds allows us to generate a near-continuous high-resolution record for the past 200 ky. Because Site U1537 is located close to the Southern Antarctic Circumpolar Current Front (SACCF), this long-term reconstruction allows us to analyze and understand changes in the location of the SACCF.
1. Introduction
The sortable silt (SS) fraction of sediments is reliably used to reconstruct past bottom current velocities (McCave and Hall, 2006, 2017; Wu et al., 2021). However, the conventional method of measuring SS requires a lengthy sediment treatment, Atterberg settling, and measurements using laser counters or SediGraph. This involved process makes it difficult and rather time consuming to work with very long drill cores retrieved by the International Ocean Discovery Program (IODP). Measurements of X-ray fluorescence (XRF) have been routinely performed on conventional and IODP sediment cores (e.g., Ronge et al., 2016; Penkrot et al., 2017). Measuring XRF on sediment core sections requires minimal sample preparation, is nondestructive, and requires only between 45 min and 2 h per section, depending on the scanner settings. Thus, an entire IODP splice record of several hundred meters can be analyzed in a reasonable time of a few days. The resulting element count records and ratios can be used to answer a multitude of paleoceanographic questions, among them the reconstruction of sediment grain size and thus bottom current velocities.
To infer grain sizes, the ratio of zirconium (Zr) to rubidium (Rb) is of particular importance (Cuven et al., 2010). Because of the high resilience of zircon minerals (Zr[SiO4]), Zr tends to be enriched in coarser sediments. Rb, on the other hand, is predominantly associated with softer minerals, such as mica, clay minerals, or K-feldspars. This association leads to a relative enrichment of Rb in smaller grain sizes. Hence, the ratio of Zr and Rb can give us quick yet precise information about the sediment grain size parameters (Cuven et al., 2010; Wu et al., 2020). The enormous advantage of the XRF method is not only the quick turnover rate but to a higher extent the fact that we will be able to generate continuous records for entire IODP cores.
Here, we apply this method to a sediment record retrieved in the Antarctic Iceberg Alley during IODP Expedition 382. First, we selected a sediment interval for discrete SS measurements to groundtruth the XRF measurements. Then we used these discrete data as well as an additional data set from Drake Passage (Wu et al., 2020) to calibrate the Zr/Rb XRF record to SS along the splice of Site U1537. Lastly, we converted the XRF-derived SS values into a continuous record of bottom current velocities for the last 200 ky.
2. Materials and methods
2.1. Drill site and setting
The samples and cores analyzed for our study were collected during Expedition 382 (Iceberg Alley and Subantarctic Ice and Ocean Dynamics). Site U1537 is located in the Antarctic Scotia Sea at 59°6.65′S, 40°54.37′W about 280 km northeast of the South Orkney Islands (Figure F1). The site is located in the Dove Basin at 3713 meters below sea level (mbsl) and consists of a 1 km thick contourite drift (Weber et al., 2019). Site U1537 is situated 2° south of the Southern Antarctic Circumpolar Current Front (SACCF; Orsi et al., 1995), making it an interesting target for paleoceanographic studies of shifts in the Antarctic Circumpolar Current (ACC). Being under the influence of the Southern Westerly Winds and Iceberg Alley, the terrigenous fraction at Site U1537 consists of ice-rafted debris (IRD) and eolian dust (Weber et al., 2022). Thus, lateral advection of sediment by bottom currents such as Antarctic Bottom Water (AABW) and Weddell Sea Deep Water (WSDW) (Maldonado et al., 2003) as well as grain size sorting as a function of current velocity are expected to be the characterizing factors, influenced by latitudinal shifts in the location of the ACC. As shown in Figure F2, the prevailing water masses at Site U1537 from shallow to deep are Antarctic Intermediate Water, North Atlantic Deep Water, and AABW/WSDW (Gouretski and Koltermann, 2004). Throughout Antarctic winter, WSDW is formed in the coastal Weddell polynya (Paul et al., 2015), and winter sea ice extends up to the location of Site U1537 (Gordon, 2009).
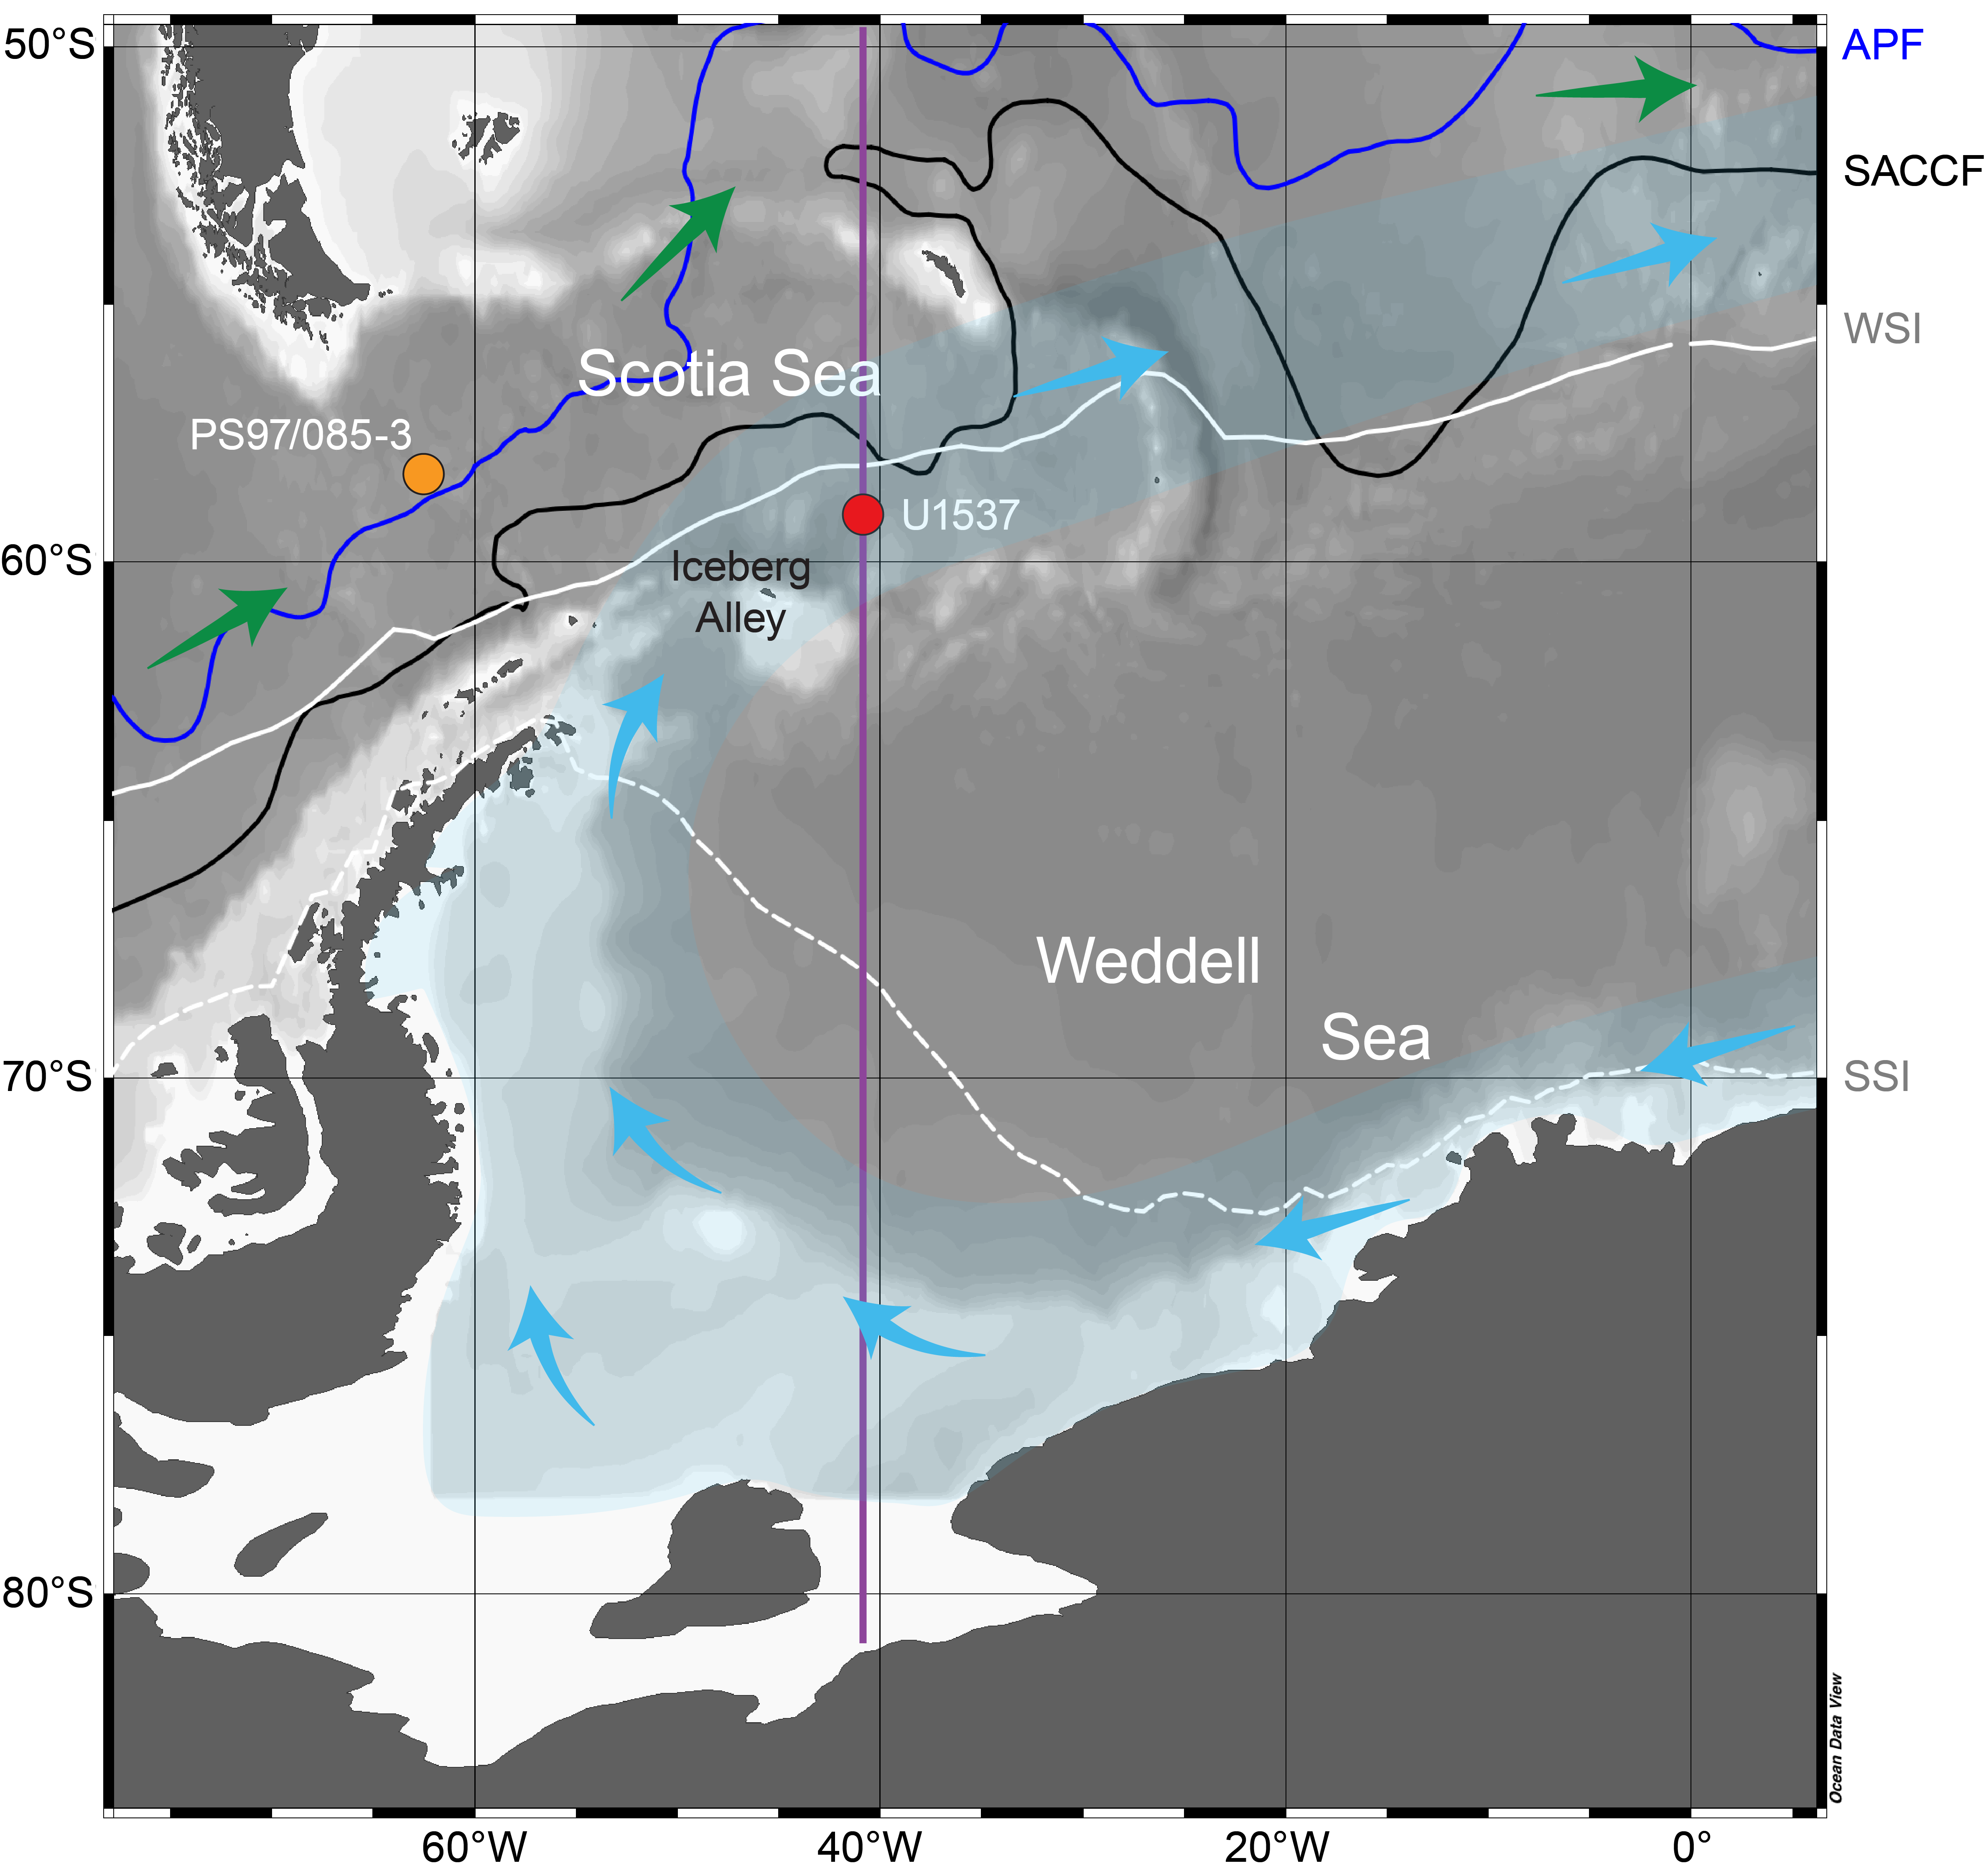
Figure F1. Overview map.
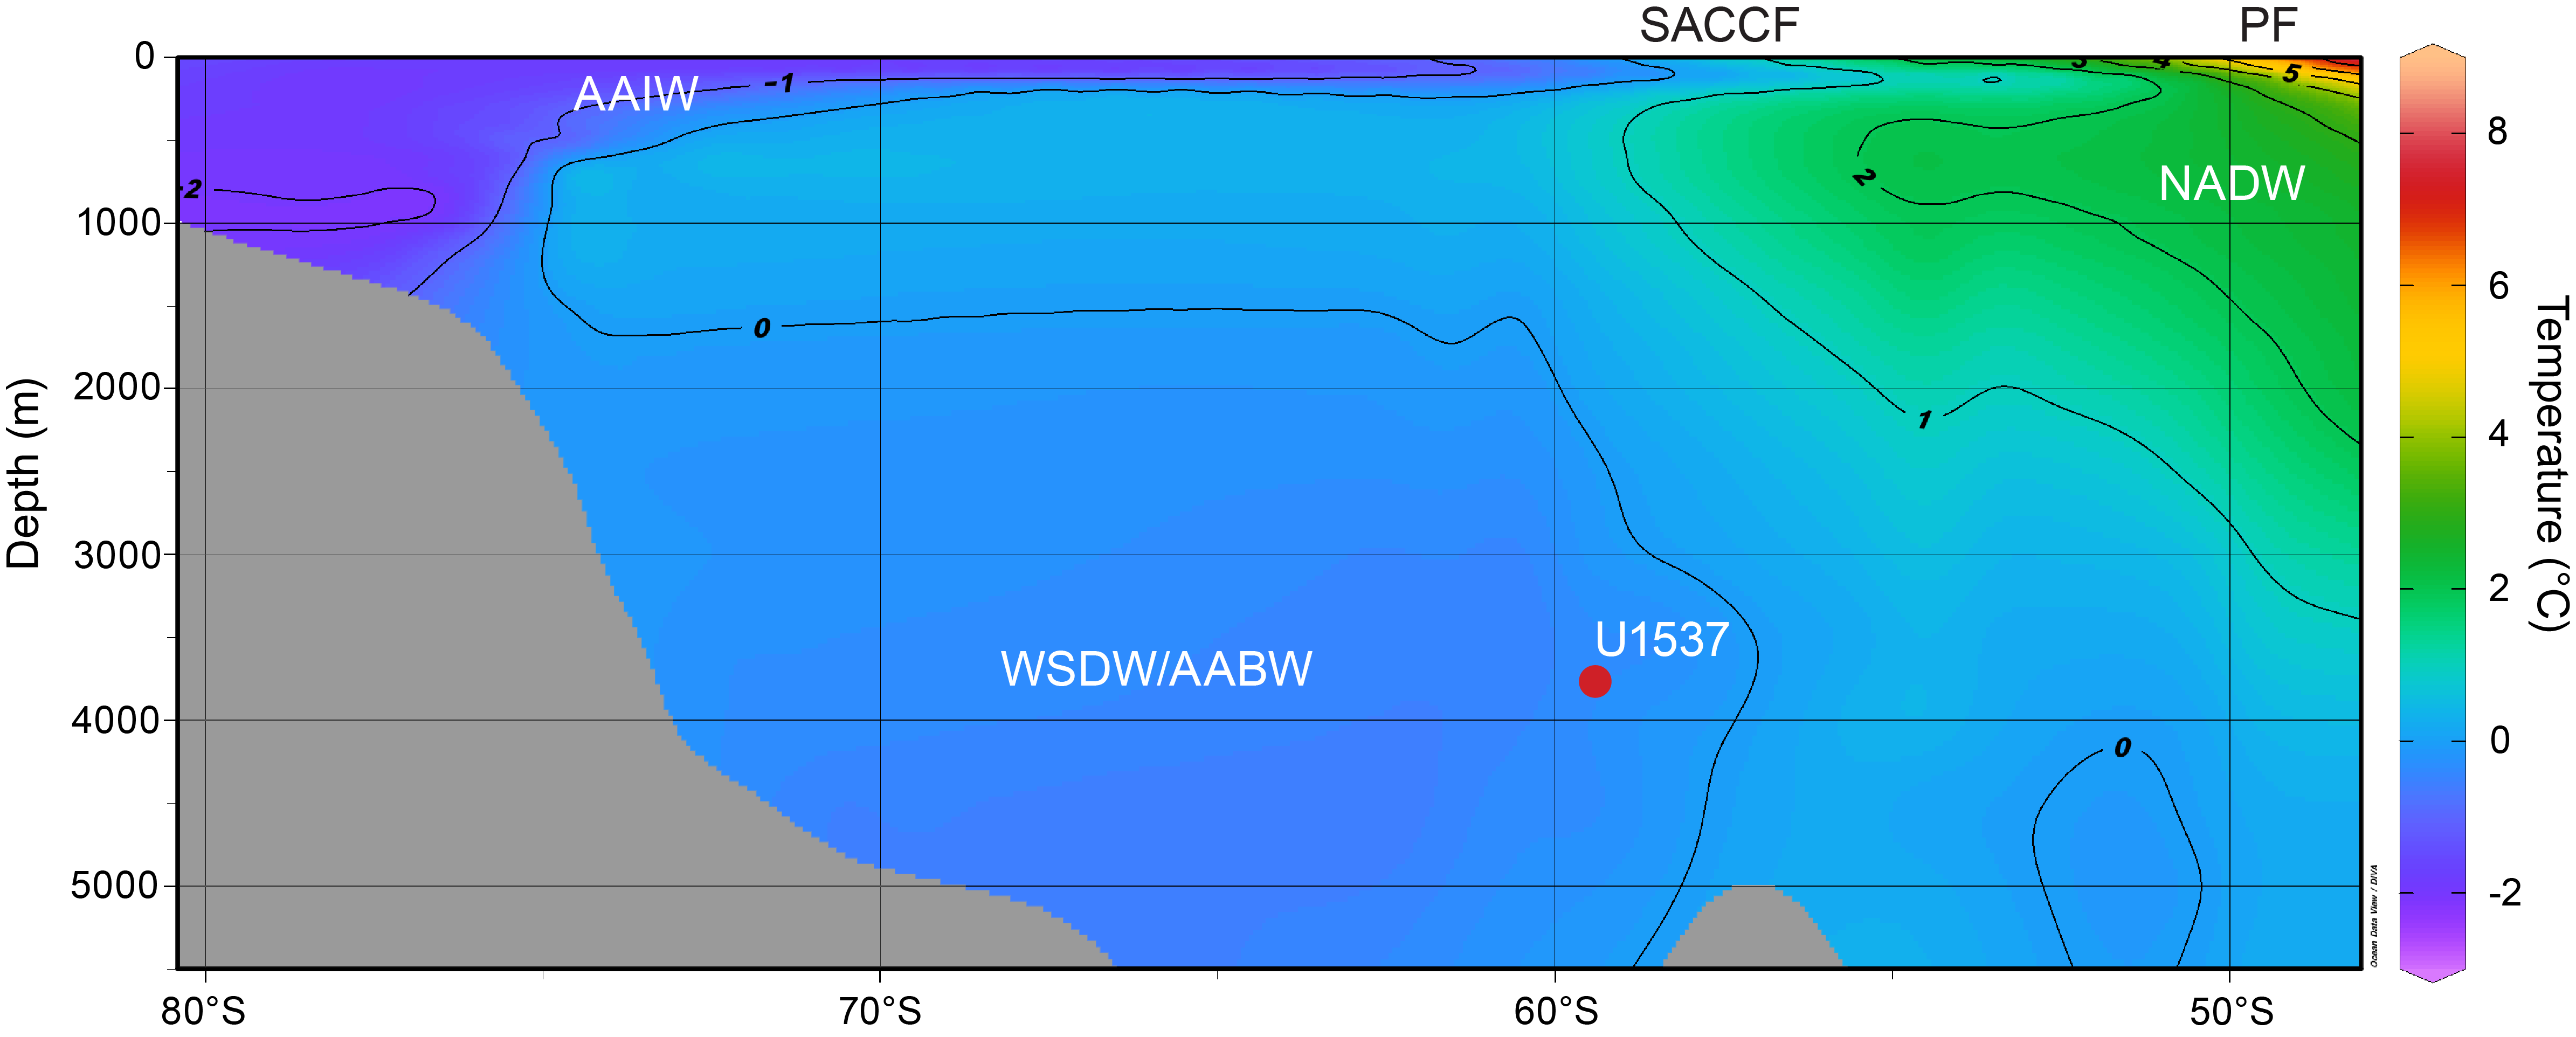
Figure F2. Temperature section and major water masses.
2.2. XRF core scanning
XRF scanning on all cores was conducted at the IODP Gulf Coast Repository in College Station, Texas (USA). Rubidium (Rb) and zirconium (Zr) analyses were performed on the split core surface of archive halves using an AVAATECH XRF core scanner at 30 kV and a step interval of 1 cm.
Because Rb is often associated with softer minerals such as K-feldspars, micas, and clay minerals and Zr is often associated with harder zircon (ZrSiO4) minerals (Dypvik and Harris, 2001), Rb tends to be relatively enriched in smaller grain sizes and Zr tends to be relatively enriched in coarser grain sizes. Thus, the elemental ratio of Zr/Rb can be used as a proxy for XRF-derived grain size analysis (Cuven et al., 2010) and can facilitate the rapid acquisition of grain size information on long sediment cores (Croudace et al., 2019). Most studies using the Zr/Rb proxy for grain size interpretation are conducted on terrestrial loess-paleosol sequences (Chen et al., 2006), but there is a growing field of studies using it in the marine environment in Drake Passage west of our research area (Toyos et al., 2020; Wu et al., 2020).
Wu et al. (2020) successfully implemented this method on sediment records from Drake Passage upstream of Site U1537. We chose to use ln(Zr/Rb) rather than Zr/Rb because the log ratio provides a more readily interpretable signal of relative changes (Weltje and Tjallingii, 2008).
2.3. Sample processing
In a first step, the sand fraction >63 µm was separated from the silt (2–63 µm) and clay (<2 µm) fractions. After wet sieving, the silt and clay fractions were collected in 5 L beakers and settled over 5–7 days. Subsequently, the water was siphoned off, and the remaining sediment was dried in a freeze drier for 2–3 days.
2.4. Removal of organic material, calcium carbonate, and biogenic opal
The presence of organic and/or biogenic material carries species-specific sizes and might thus interfere with the grain size measurement of the terrigenous fraction attempted here (McCave and Hall, 2006). To remove any organic material, the samples were boiled in 200 mL of water, 10 mL of 35% H2O2 (until the reaction ceased), and subsequently 10 mL of 10% HCl for 1 min to remove any CaCO3 (Wengler et al., 2019).
Following the removal of organic material and CaCO3, biogenic opal was alkaline leached (van der Does et al., 2021). For 60 min, the samples were mixed with 200 mL of 20% sodium hydroxide (NaOH) and heated to 80°–85°C under constant stirring. After 1 h, cold deionized (DI) water was added to stop the reaction and cool down the suspension. The sediment-NaOH mixture was neutralized by rinsing it with DI water and centrifuging it at 20°C and 5050 revolutions for 5 min. The overlying solution was tested for its pH and decanted. These steps were repeated until the overlying solution had the same pH as the DI water used to neutralize it, usually 5 or 6 runs. Once neutralized, the samples were transferred into beakers and placed in an oven at 50°C until most (but not all) of the overlying water evaporated. After evaporating most of the water, the samples were frozen and freeze-dried for 3 days.
Finally, the samples were checked under a microscope to check if the removal of organic material, CaCO3, and biogenic SiO2 was successful.
2.5. Size fraction separation
The clay fraction was separated from the terrigenous noncohesive SS (10–63 µm; McCave and Hall, 2006) using Atterberg settling. The samples were added into 5 L cylinders and brought into suspension with DI water and, to avoid coagulation, 0.1% sodium polyphosphate. Room temperature and fill height were measured and noted and used to calculate the time when the clay suspension had to be siphoned off the next day. The settling and siphoning procedures were repeated about 9–12 times in general until SS and clay had been completely separated.
2.6. Discrete grain size measurements
At the Alfred Wegener Institute in Bremerhaven (Germany), we used a Micromeritics SediGraph 5100 for discrete grain size measurements. Instrument precision for known standards was ±0.3% to 1.9%. After setting up the instrument (X-rays constant between 90,000 and 95,000 counts/s; water temperature of 35°C), tetrasodium pyrophosphate (Na4P2O7) was added to suppress aggregate formation. Once setup was complete, the samples were inserted and individually measured. After each sample, the SediGraph was rinsed and cleaned several times to prevent cross-contamination.
The SediGraph’s measurements range 14.6φ–1.32φ (phi scale in 0.1φ steps), which corresponds to a grain size range of 0.04–2500 µm. After the size separation described above, the φ values of our samples range 4–9 (62.5–1.95 µm).
The SediGraph data were processed and corrected for sand and clay fractions to calculate SS and SS% for each sample (Tables T1, T2, T3, T4, T5) (McCave and Hall, 2006). SS% is calculated as the sum between 10 and 63 µm divided by the total fine fraction (percentage <63 µm) (McCave and Andrews, 2019).
The bottom current velocity was calculated as SS = 0.515U + 12.73 (where U = scalar flow speed), following the approach of McCave et al. (2017) for the Weddell-Scotia Sea sector.
3. Age model
We adjusted the shipboard age model (Weber et al., 2019) and the updated version (Weber et al., 2022) by correlating the ln(Zr/Rb) data to the δ18O record of the EPICA Dronning Maud Land (EDML) ice core on the Antarctic ice core chronology (AICC) 2012 age scale (Bazin et al., 2013) back to 200 ka, using the correlation software AnalySeries (Paillard et al., 1996) (Figure F3). We furthermore correlated our ln(Zr/Rb) data to the δD record of the EPICA Dome C (EDC) ice core on the AICC2012 age scale (Jouzel et al., 2007) and the LR04 δ18O stack (Lisiecki and Raymo, 2005). Although some Southern Ocean studies indicate a correlation between zonal current strength maxima and increasing atmospheric temperatures (Shi et al., 2021), the true phase relationship is unknown. Thus, it is possible that the age model used here has an error of several thousand years. However, sediments at Site U1537 consist predominantly of biogenic opal with fractions ranging 5%–55% (Weber et al., 2019). The magnetic susceptibility (MS) of these sediments was assumed to be driven by changes in eolian dust input (Weber et al., 2022). However, maxima in biological productivity coincide with minima in MS (Weber et al., 2022). Hence, it is also possible that biological productivity (opal) is the dominant pacemaker for changes in MS in addition to changing dust fluxes. Being located in a major sediment drift, the lateral advection and grain size sorting of terrigenous sediment by bottom currents can potentially influence the siliciclastic composition at Site U1537.
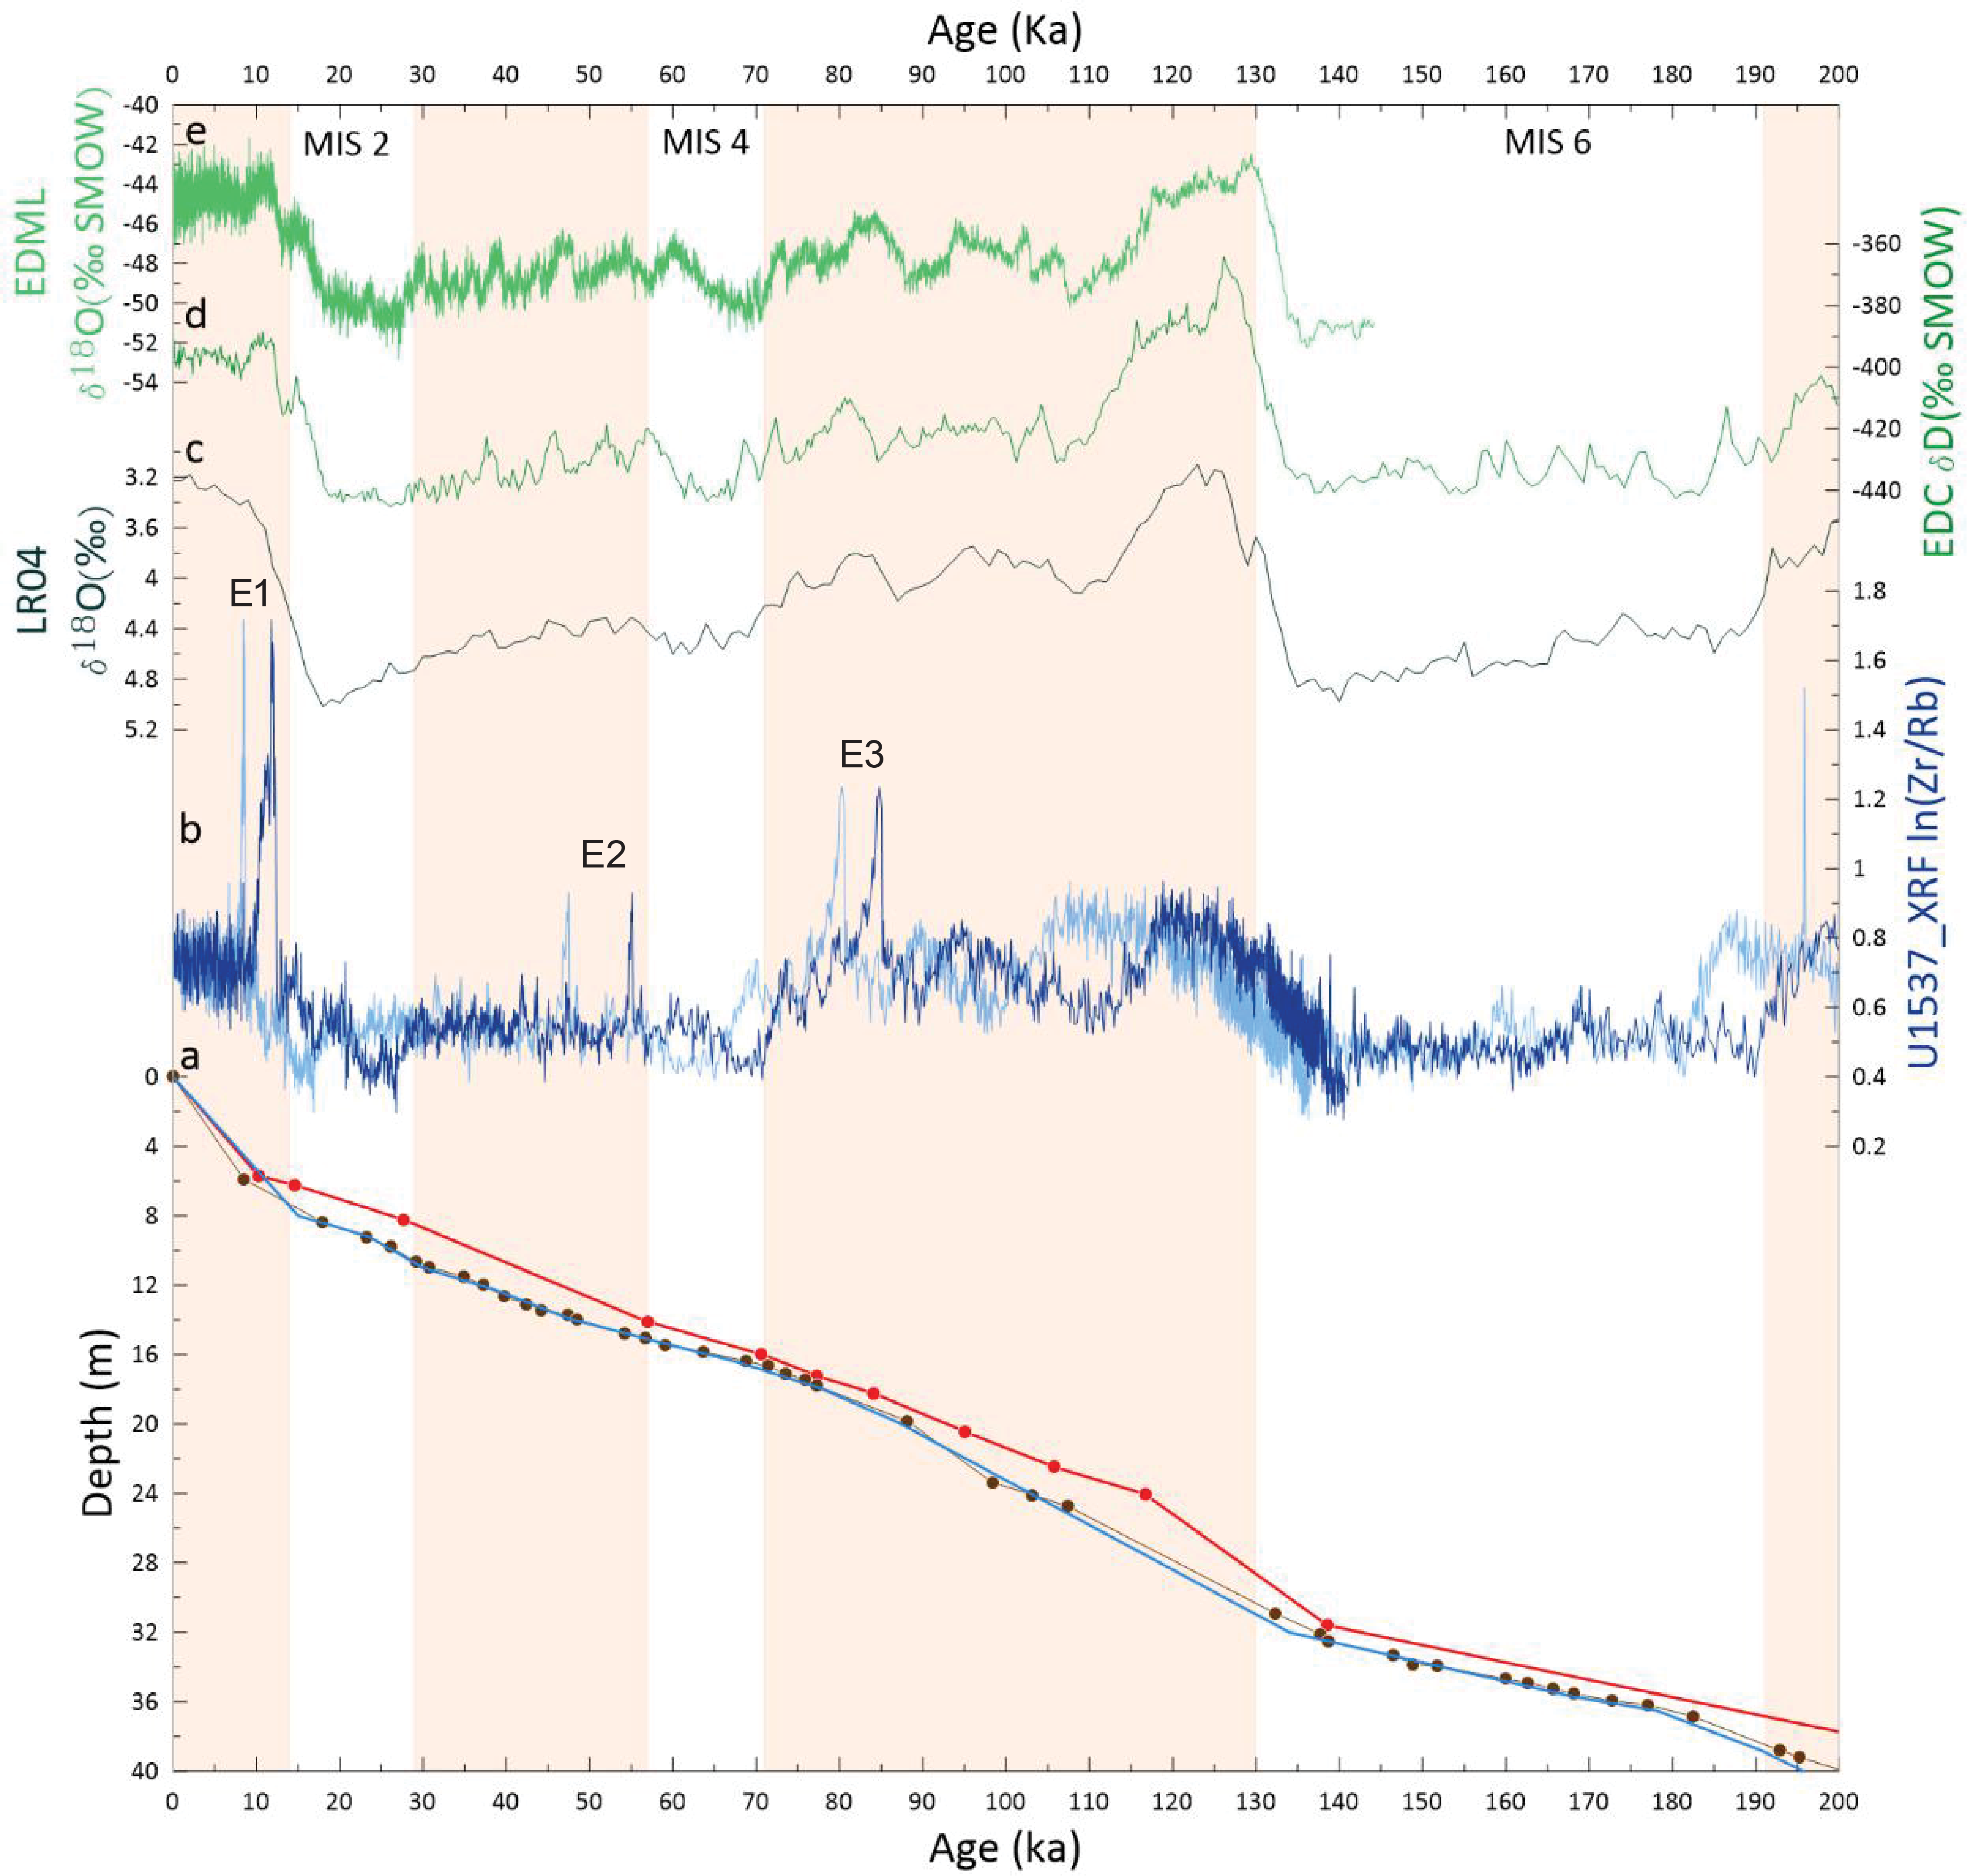
Figure F3. Age model.
Nevertheless, no matter the age model used in this study, the correlation of XRF-derived Zr/Rb values and grain size remains robust.
4. Results
4.1. X-ray fluorescence
Over the last 200 ky, the XRF record of Zr and Rb shows a significant variability between glacial and interglacial states (Figure F4), with both Zr and Rb higher during cold marine isotope stages (MISs), with only a short spike in MIS 2 that coincides with the Last Glacial Maximum. For most of the 200 ky record, Zr and Rb patterns show a strong correlation. However, a few intervals with a pronounced deviation from this correlation can be identified in the Zr/Rb and ln(Zr/Rb) records (Figure F4C, F4D). Three distinct events were identified where the ln(Zr/Rb) ratio increases dramatically over the background signal (we name them Events E1 [12 ka], E2 [55 ka], and E3 [85 ka]; please note the offset the different age models have on the timing of Events E1–E3; Figure F3). Events E1–E3 mark deviations in the correlation of Zr and Rb. This sudden deviation could be the result of a change in the Zr/Rb ratio, which would indicate an IRD overprint. The visual core description and X-ray scans from Site U1537 (see Figure F1 from the Site U1537 chapter [Weber et al., 2021]) highlight that grains >2 mm occur at the intervals 8–9 and 12–16 m in Hole U1537A and at 6–20 m in Hole U1537D. These intervals correspond to peaks observed in the Zr/Rb signals, suggesting that the extreme spikes (Events E1–E3) might represent a potential bias in the XRF-based current speed interpretation during times of pronounced IRD input (Wu et al., 2020). Cold stages MISs 2, 4, and 6 are marked by lower ln(Zr/Rb) values than warm stages MISs 1, 5, and 7. MIS 3 is only slightly elevated compared to the minima of MISs 2 and 4 (Figure F4D).
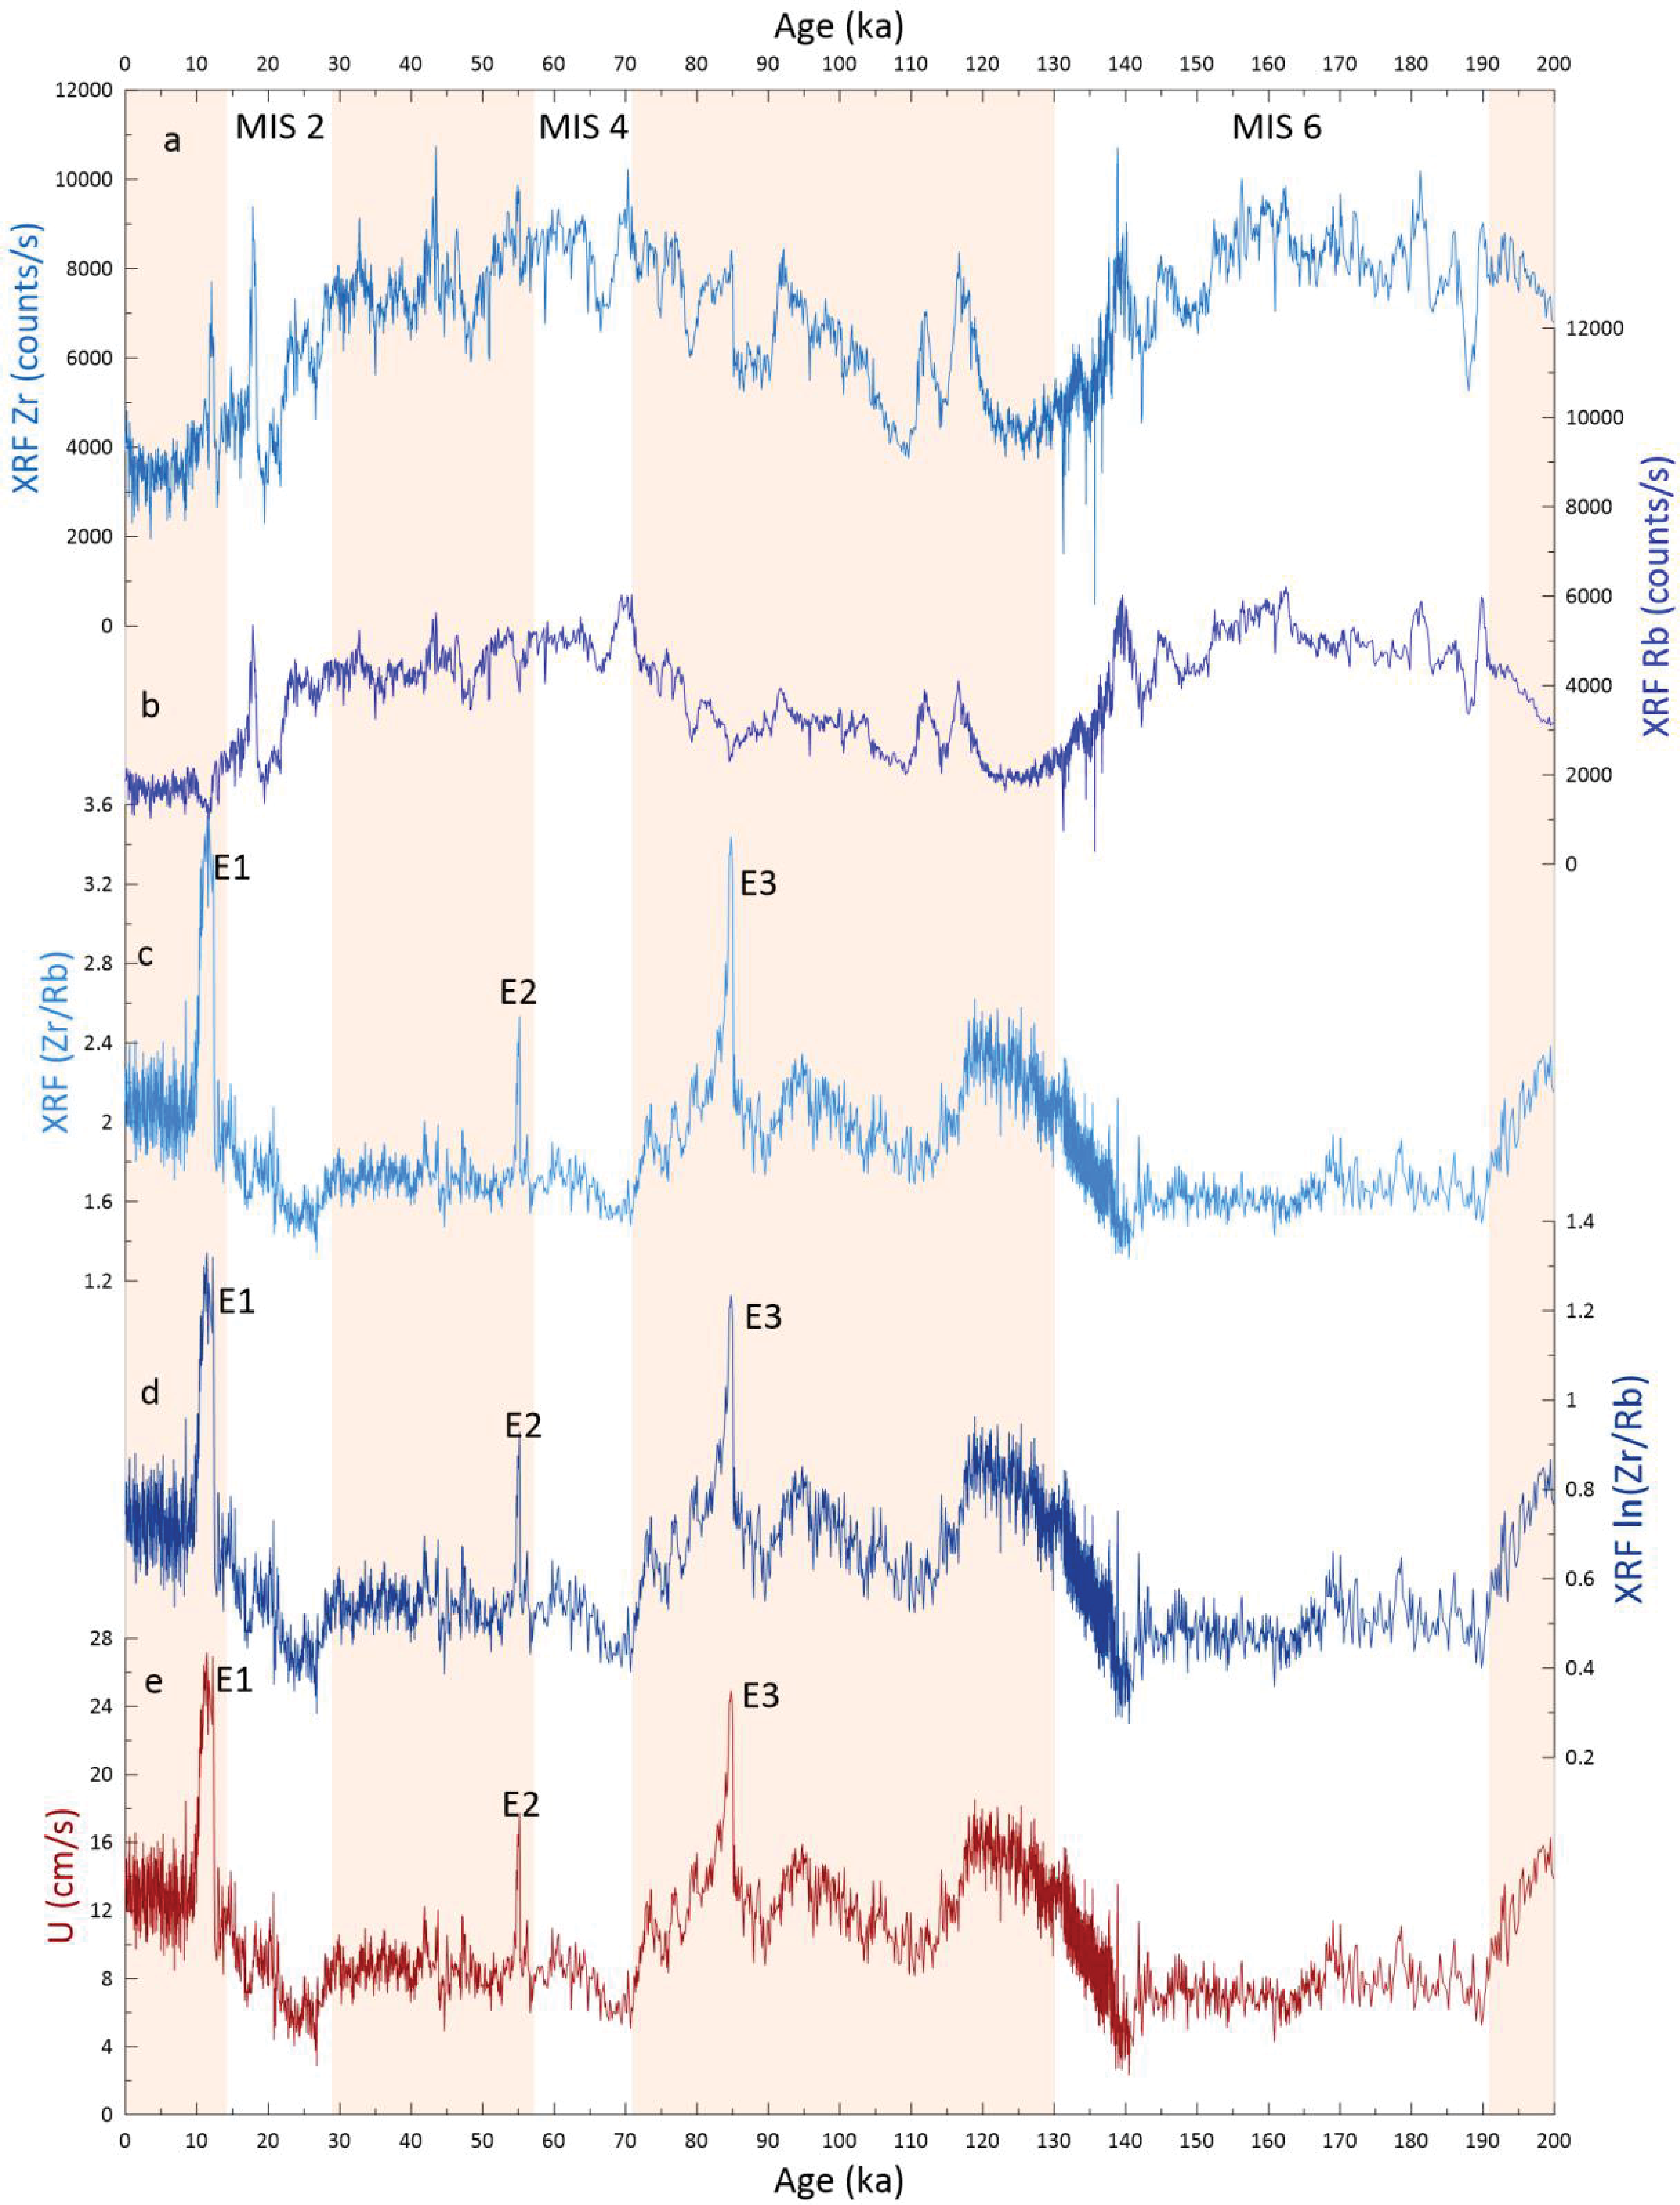
Figure F4. Downcore data and current speed.
Both glacial Terminations TI and TII are characterized by a progressive increase in ln(Zr/Rb). Throughout Terminations TI and TII, ln(Zr/Rb) increases from 0.46 to 0.73 and from 0.49 to 0.81, respectively.
4.2. Sortable silt (10–63 µm)
In a regime sorted by bottom currents, the correlation between SS and SS% is positive, whereas no correlation is obvious in unsorted sediments (McCave and Hall, 2006). At Site U1537, the values measured show a significant positive correlation during MIS 6 (191–130 ka) and MIS 5 (130–119 ka) (R = 0.8, N = 71; Figure F5A). SS ranges from 16.06 µm to a maximum of 21.47 µm, with SS% between 25.96% and 52.17%. Glacial values (blue dots in Figure F5A) are in general lower than interglacial values (red dots in Figure F5A). In the Drake Passage sediment Core PS97/085-3, a similar trend is observed, although both SS and SS% have higher values (Figure F5B; Wu et al., 2021). A combination of both Site U1537 and Core PS97/085-3 data (Figure F5B) reveals that Site U1537 marks the lower energy end-member, with higher energies and bottom current speeds in Drake Passage marked by Core PS97/085-3. Combining both records significantly improves the correlation coefficient to R = 0.97 (N = 319).
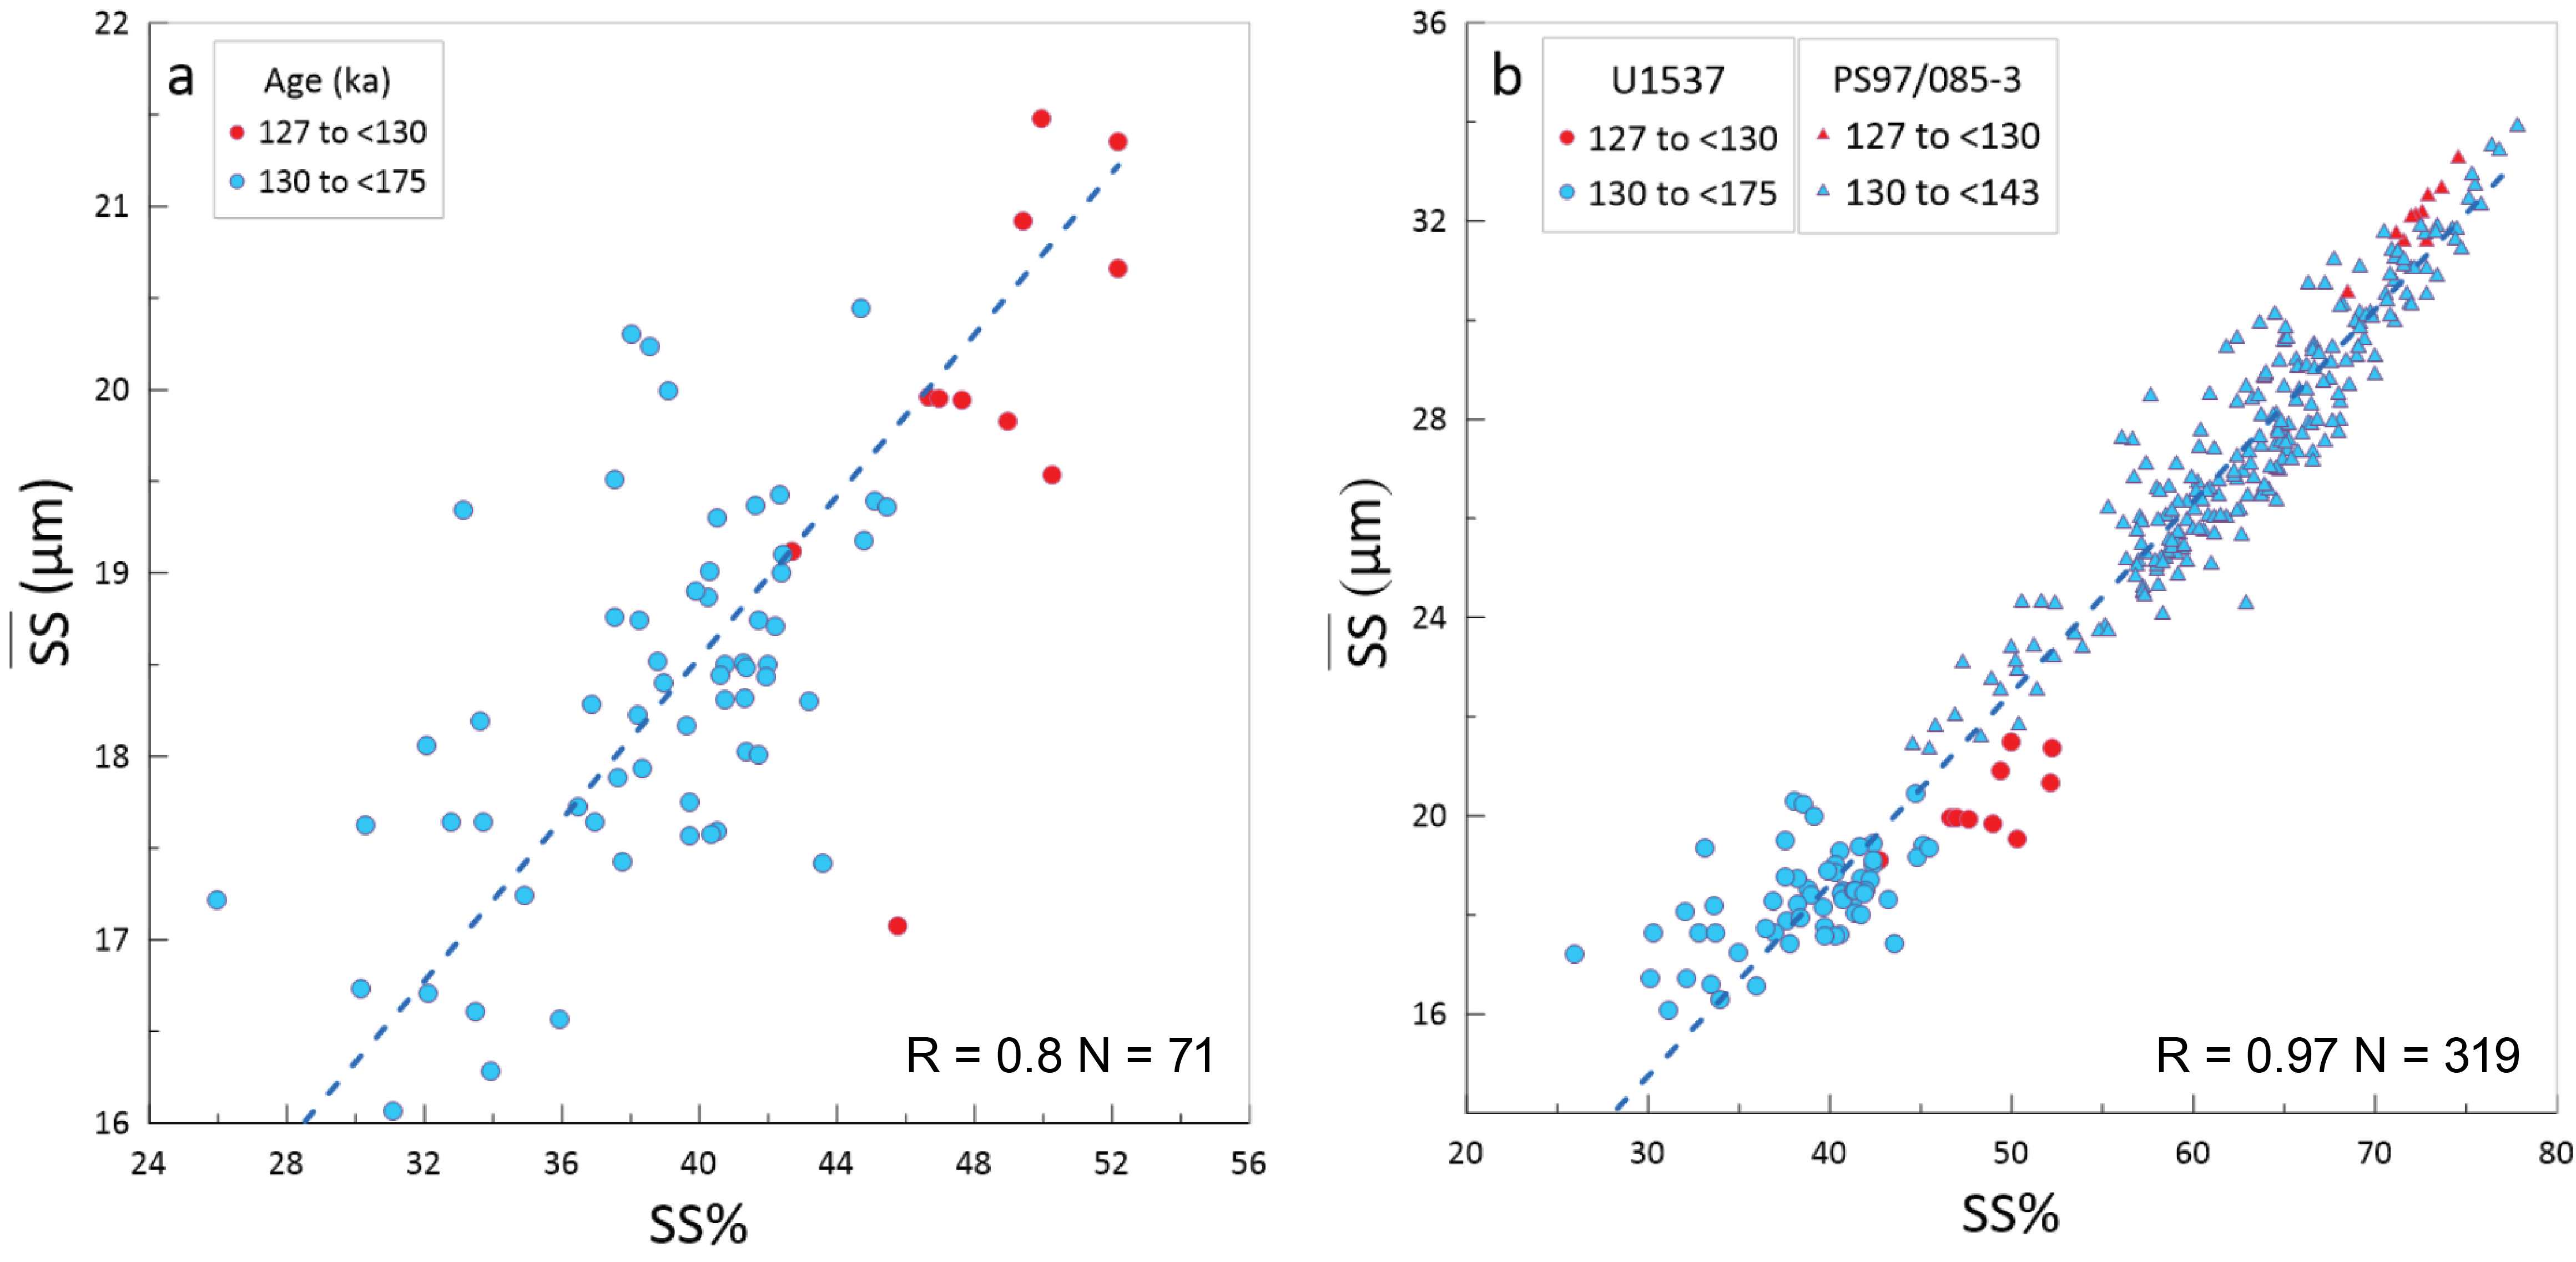
Figure F5. Reduced major axis regression between SS and SS%.
To calculate the bottom current velocities, we used SS = 0.515U + 12.73 as defined for the Weddell and Scotia Seas (McCave et al., 2017). Glacial (MIS 6) bottom current velocities are lower than during the early interglacial of MIS 5, with 6–14.5 and 12–17 cm/s, respectively (Figure F5). To generate a high-resolution data set spanning the entire record, we used SS derived from ln(Zr/Rb) measurements.
4.3. ln(Zr/Rb)-derived SSXRF data
Correlation of the XRF ln(Zr/Rb) data with discrete SS measurements of Site U1537 results in a weak positive correlation of R = 0.62 (Figure F6A). However, as described above, the Site U1537 data mark the low-energy end-member and thus yield a lower signal-to-noise ratio. Thus, we added the high energy data set of Core PS97/085-3 (Wu et al., 2021) to our calculation. This more complete data set significantly improves the correlation to R = 0.89 (Figure F6B). To calculate SS from paired ln(Zr/Rb) and SS data, we performed a reduced major axis regression analysis:
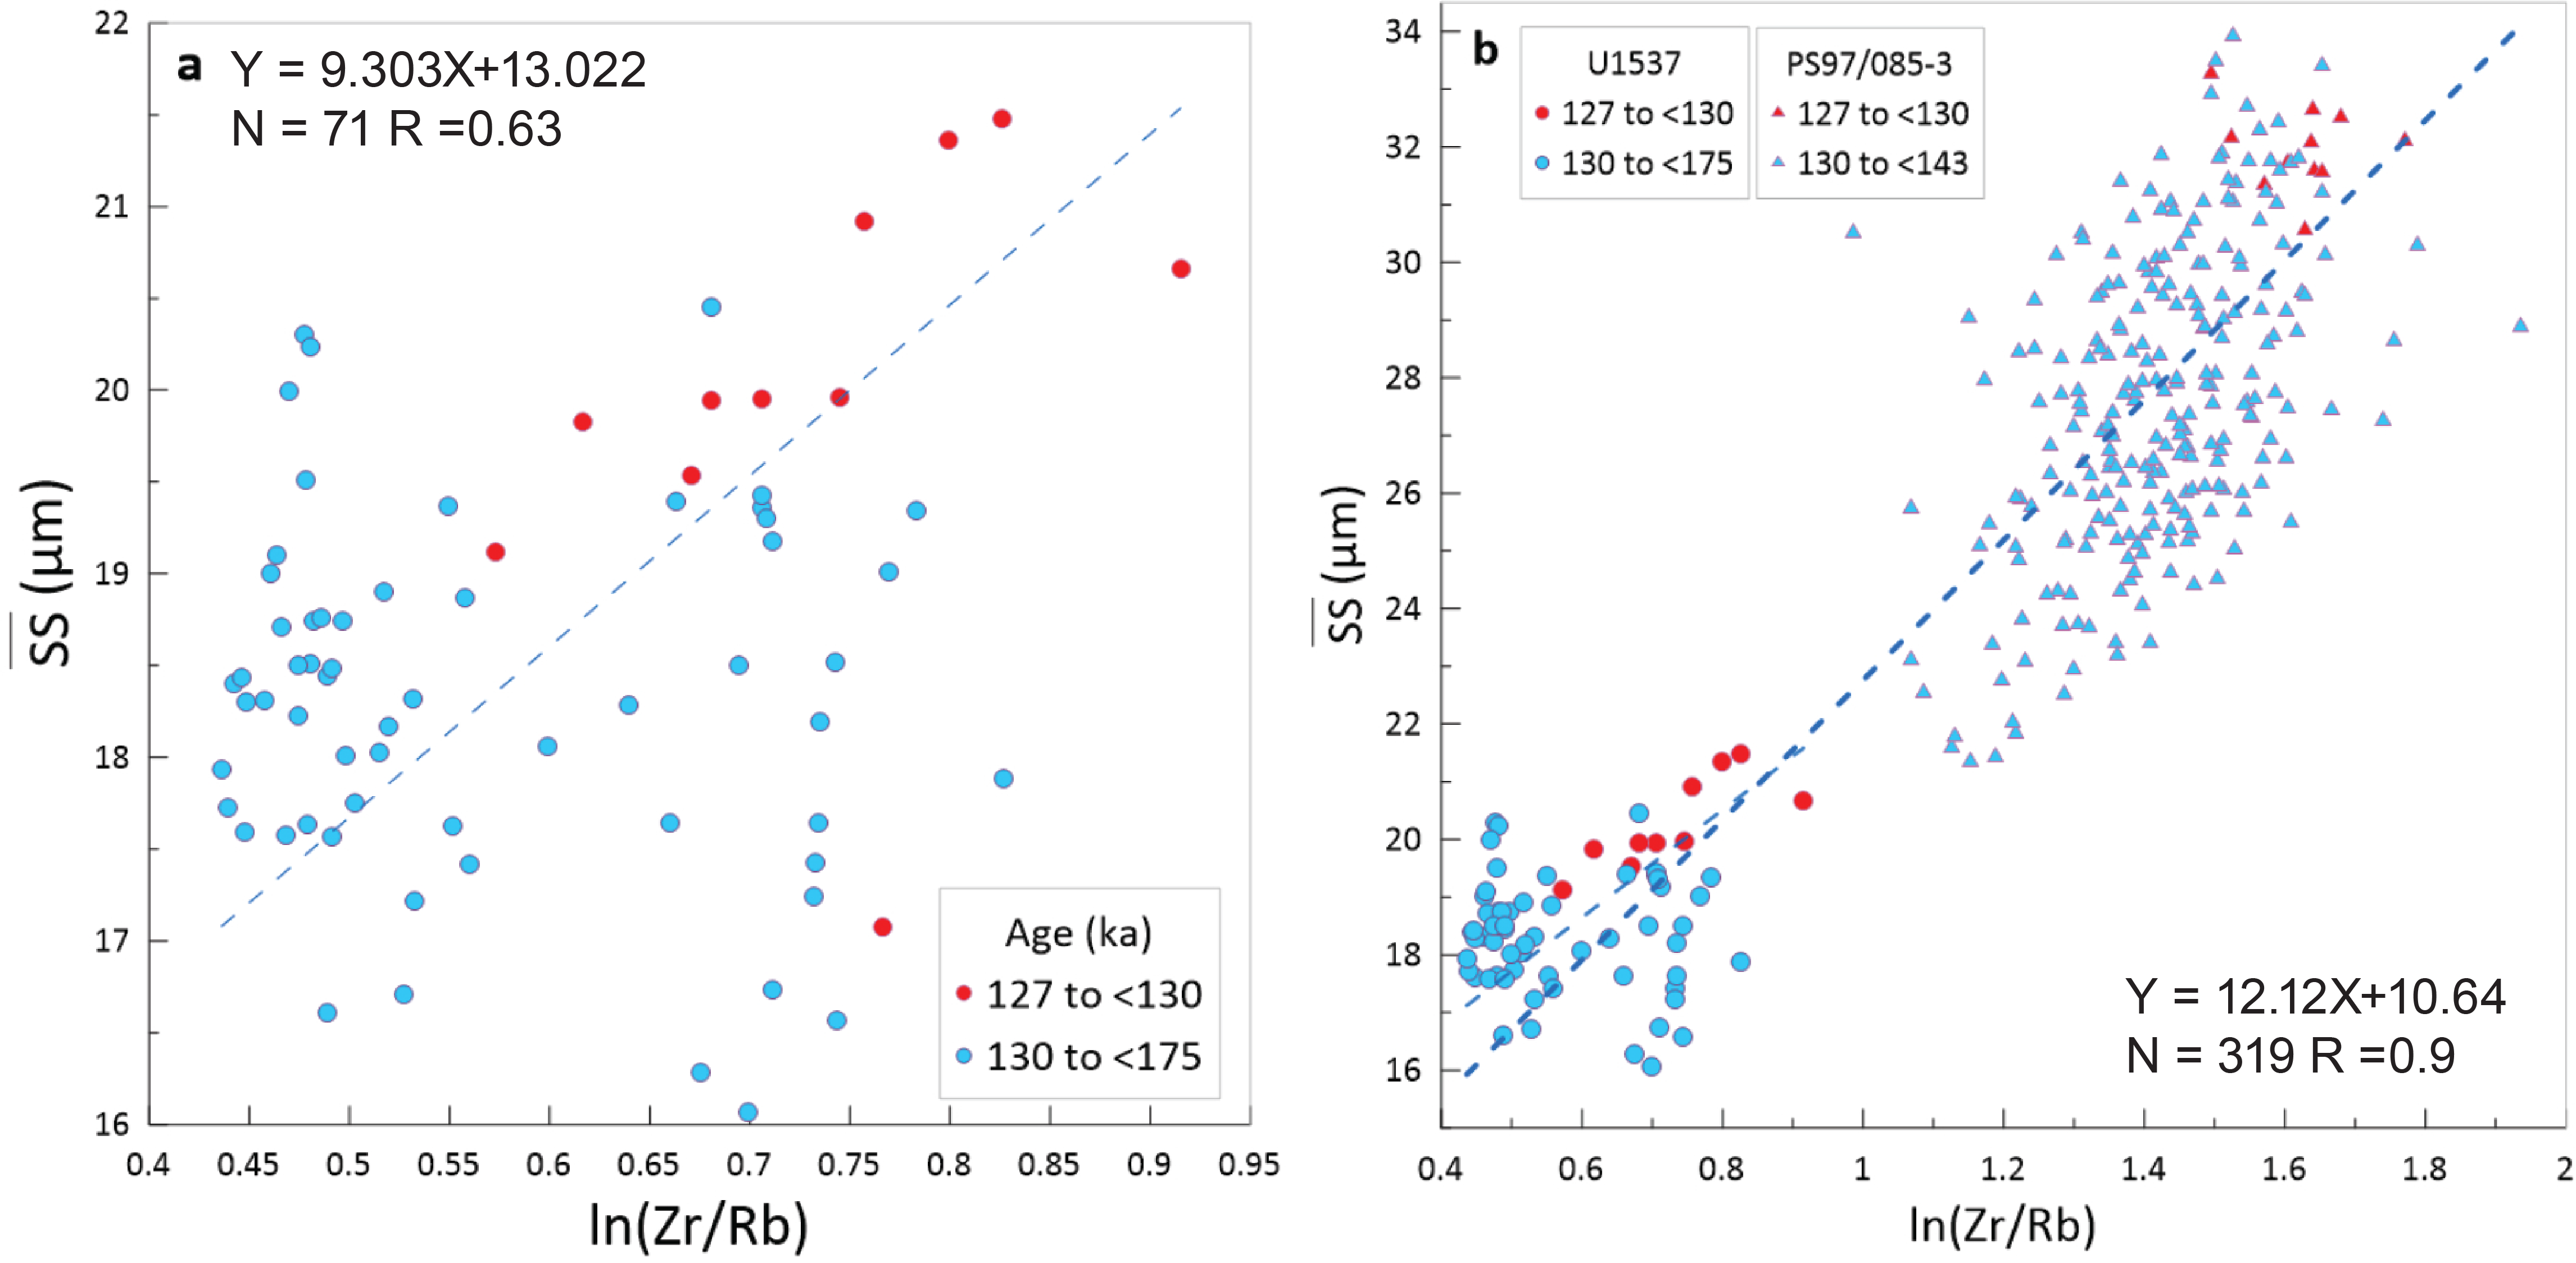
Figure F6. Reduced major axis regression between SS and ln(Zr/Rb).
Ultimately, we used the SS values to calculate current speeds for the entire record presented here using the method described above (McCave et al., 2017). Over the past 200 ky, bottom current velocities range 2–27 cm/s (Figure F7). Glacial values are consistently lower than those throughout the interglacials with pronounced increases marking Terminations TI and TII (Figure F7).
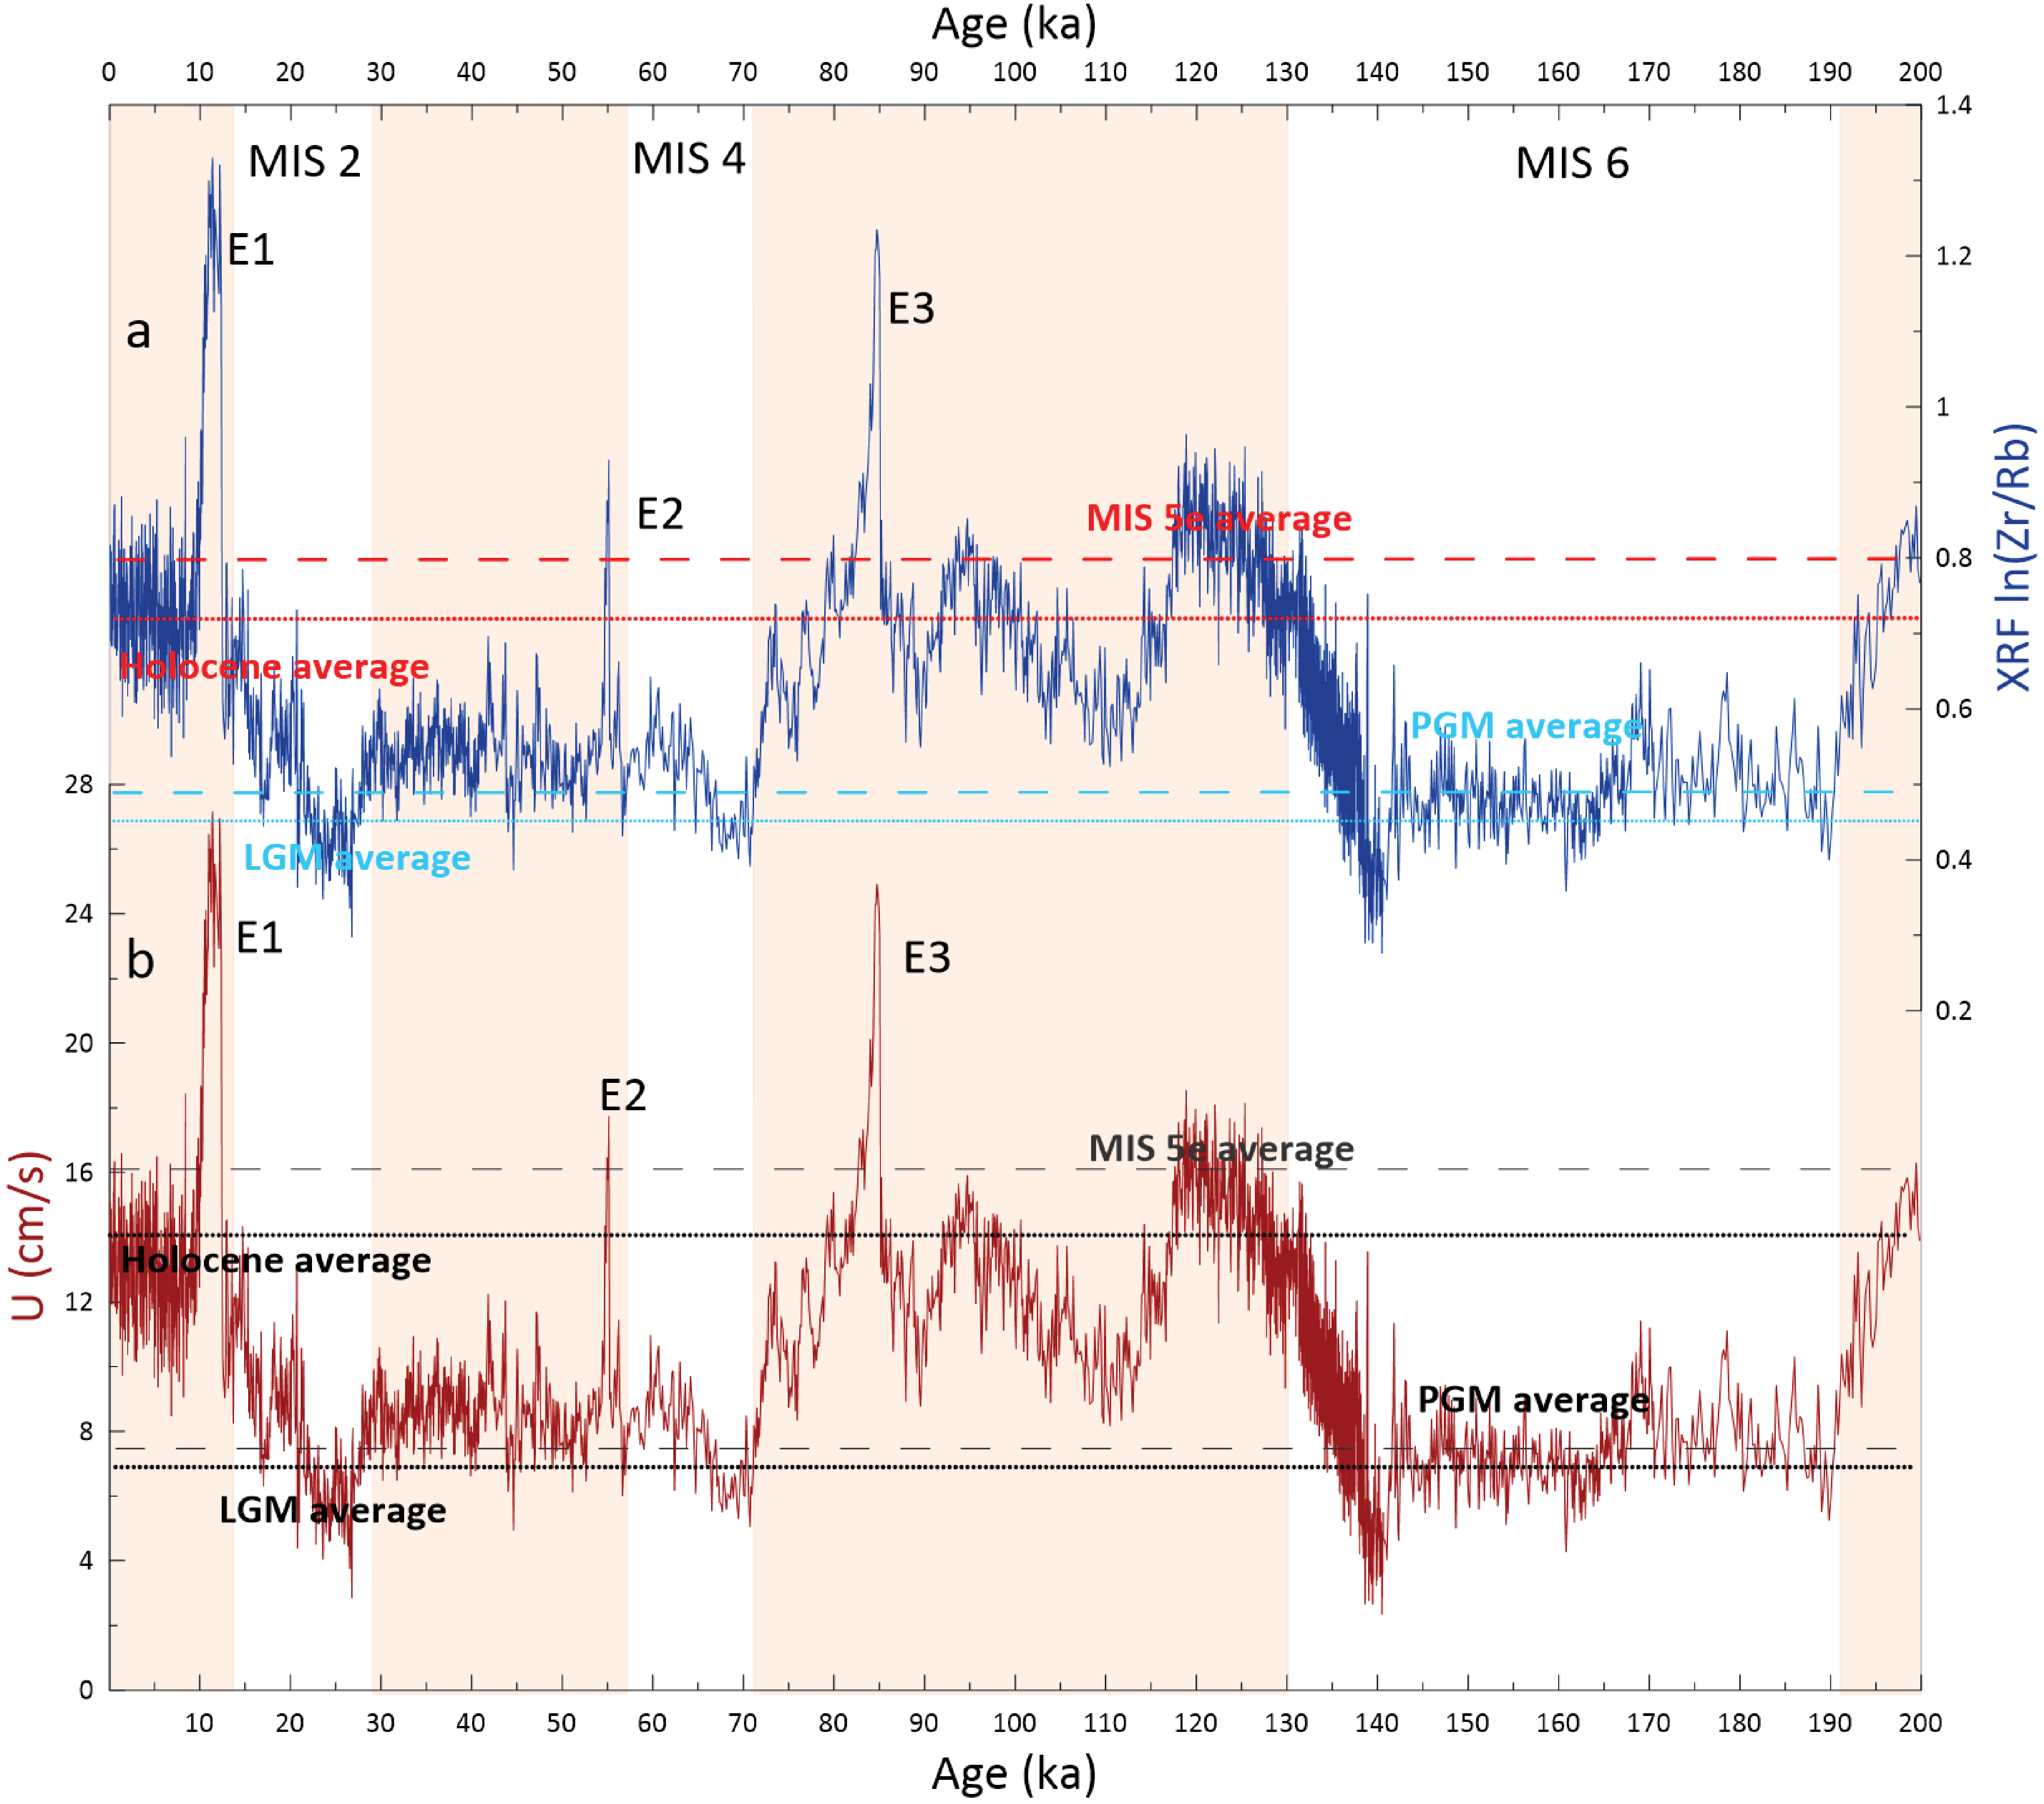
Figure F7. XRF ln(Zr/Rb) and XRF-derived current strength.
The pattern observed in Figure F7 indicates that a southward shift of about 2° might have moved the SACCF closer to or above the location of Site U1537 (Figure F1), increasing bottom current velocities during peak interglacial conditions. However, more detailed analyses are needed to fully investigate this process.
5. Acknowledgments
This research used samples and/or data provided by the International Ocean Discovery Program (IODP). Funding for this research was provided by the SFG SPP527 and Helmholtz Society project POSY. We would like to thank R. Tiedemann and F. Lamy for their valuable advice during the writing period of S. Dbritto’s master’s thesis. We appreciate the constructive and helpful comments by reviewer R. Wang and editor T. Williams. We would like to thank the Expedition 382 JOIDES Resolution Science Operator technical staff, scientists, and the crew and catering staff of the R/V JOIDES Resolution for facilitating our research. In addition, we would like to thank V. Schumacher and S. Wiebe of the Alfred Wegener Institute for technical laboratory support in particular during the height of the Coronavirus Disease 2019 (COVID-19) pandemic in 2020. All data are accessible at https://doi.pangaea.de/10.1594/PANGAEA.958599.
References
Bazin, L., Landais, A., Lemieux-Dudon, B., Toyé Mahamadou Kele, H., Veres, D., Parrenin, F., Martinerie, P., Ritz, C., Capron, E., Lipenkov, V., Loutre, M.F., Raynaud, D., Vinther, B., Svensson, A., Rasmussen, S.O., Severi, M., Blunier, T., Leuenberger, M., Fischer, H., Masson-Delmotte, V., Chappellaz, J., and Wolff, E., 2013. An optimized multi-proxy, multi-site Antarctic ice and gas orbital chronology (AICC2012): 120–800 ka. Climate of the Past, 9(4):1715–1731. https://doi.org/10.5194/cp-9-1715-2013
Chen, J., Chen, Y., Liu, L., Ji, J., Balsam, W., Sun, Y., and Lu, H., 2006. Zr/Rb ratio in the Chinese loess sequences and its implication for changes in the East Asian winter monsoon strength. Geochimica et Cosmochimica Acta, 70(6):1471–1482. https://doi.org/10.1016/j.gca.2005.11.029
Croudace, I.W., Löwemark, L., Tjallingii, R., and Zolitschka, B., 2019. Current perspectives on the capabilities of high resolution XRF core scanners. Quaternary International, 514:5–15. https://doi.org/10.1016/j.quaint.2019.04.002
Cuven, S., Francus, P., and Lamoureux, S.F., 2010. Estimation of grain size variability with micro X-ray fluorescence in laminated lacustrine sediments, Cape Bounty, Canadian High Arctic. Journal of Paleolimnology, 44(3):803–817. https://doi.org/10.1007/s10933-010-9453-1
Dypvik, H., and Harris, N.B., 2001. Geochemical facies analysis of fine-grained siliciclastics using Th/U, Zr/Rb and (Zr+Rb)/Sr ratios. Chemical Geology, 181(1–4):131–146. https://doi.org/10.1016/S0009-2541(01)00278-9
Gordon, A.L., 2009. Bottom water formation. In Steele, J.H., Thorpe, S.A., and Turekian, K.K. (Eds.), Ocean Currents. Cambridge, MA (Elsevier Academic Press).
Gouretski, V., and Koltermann, K.P., 2004. WOCE global hydrographic climatology. Berichte des Bundesamt fur Seeschifffahrt und Hydrographie, 35.
Jouzel, J., Masson-Delmotte, V., Cattani, O., Dreyfus, G., Falourd, S., Hoffmann, G., Minster, B., Nouet, J., Barnola, J.M., Chappellaz, J., Fischer, H., Gallet, J.C., Johnsen, S., Leuenberger, M., Loulergue, L., Luethi, D., Oerter, H., Parrenin, F., Raisbeck, G., Raynaud, D., Schilt, A., Schwander, J., Selmo, E., Souchez, R., Spahni, R., Stauffer, B., Steffensen, J.P., Stenni, B., Stocker, T.F., Tison, J.L., Werner, M., and Wolff, E.W., 2007. Orbital and millennial Antarctic climate variability over the past 800,000 years. Science, 317(5839):793–796. https://doi.org/10.1126/science.1141038
Lisiecki, L.E., and Raymo, M.E., 2005. A Pliocene-Pleistocene stack of 57 globally distributed benthic δ18O records. Paleoceanography, 20(1):PA1003. https://doi.org/10.1029/2004PA001071
Maldonado, A., Barnolas, A., Bohoyo, F., Galindo-Zaldívar, J., Hernández-Molina, J., Lobo, F., Rodríguez-Fernández, J., Somoza, L., and Tomás Vázquez, J., 2003. Contourite deposits in the central Scotia Sea: the importance of the Antarctic Circumpolar Current and the Weddell Gyre flows. Palaeogeography, Palaeoclimatology, Palaeoecology, 198(1–2):187–221. https://doi.org/10.1016/S0031-0182(03)00401-2
McCave, I.N., and Andrews, J.T., 2019. Distinguishing current effects in sediments delivered to the ocean by ice. I. Principles, methods and examples. Quaternary Science Reviews, 212:92–107. https://doi.org/10.1016/j.quascirev.2019.03.031
McCave, I.N., and Hall, I.R., 2006. Size sorting in marine muds: Processes, pitfalls, and prospects for paleoflow-speed proxies. Geochemistry, Geophysics, Geosystems, 7(10):Q10N05. https://doi.org/10.1029/2006GC001284
McCave, I.N., Thornalley, D.J.R., and Hall, I.R., 2017. Relation of sortable silt grain-size to deep-sea current speeds: calibration of the ‘Mud Current Meter’. Deep Sea Research, Part I: Oceanographic Research Papers, 127:1–12. https://doi.org/10.1016/j.dsr.2017.07.003
Orsi, A.H., Whitworth, T., and Nowlin, W.D., 1995. On the meridional extent and fronts of the Antarctic Circumpolar Current. Deep Sea Research, Part I: Oceanographic Research Papers, 42(5):641–673. https://doi.org/10.1016/0967-0637(95)00021-W
Paillard, D., Labeyrie, L., and Yiou, P., 1996. Macintosh Program performs time-series analysis. Eos, Transactions of the American Geophysical Union, 77(39):379. https://doi.org/10.1029/96EO00259
Paul, S., Willmes, S., and Heinemann, G., 2015. Long-term coastal-polynya dynamics in the southern Weddell Sea from MODIS thermal-infrared imagery. The Cryosphere, 9(6):2027–2041. https://doi.org/10.5194/tc-9-2027-2015
Penkrot, M., Levay, L.J., and Jaeger, J.M., Gulick, S.P.S., LeVay, L.J., and the Expedition 341 Scientists, 2017. Data report: X-ray florescence scanning of sediment cores, Site U1419, Gulf of Alaska. In Jaeger, J.M., Gulick, S.P.S., LeVay, L.J., and the Expedition 341 Scientists, Proceedings of the Integrated Ocean Drilling Program. 341: College Station, TX (Integrated Ocean Drilling Program). https://doi.org/10.2204/iodp.proc.341.203.2017
Ronge, T.A., Tiedemann, R., Lamy, F., Köhler, P., Alloway, B.V., De Pol-Holz, R., Pahnke, K., Southon, J., and Wacker, L., 2016. Radiocarbon constraints on the extent and evolution of the South Pacific glacial carbon pool. Nature Communications, 7(1):11487. https://doi.org/10.1038/ncomms11487
Shi, J.-R., Talley, L.D., Xie, S.-P., Peng, Q., and Liu, W., 2021. Ocean warming and accelerating Southern Ocean zonal flow. Nature Climate Change, 11(12):1090–1097. https://doi.org/10.1038/s41558-021-01212-5
Toyos, M.H., Lamy, F., Lange, C.B., Lembke-Jene, L., Saavedra-Pellitero, M., Esper, O., and Arz, H.W., 2020. Antarctic Circumpolar Current dynamics at the Pacific entrance to the Drake Passage over the past 1.3 million years. Paleoceanography and Paleoclimatology, 35(7):e2019PA003773. https://doi.org/10.1029/2019PA003773
van der Does, M., Wengler, M., Lamy, F., Martínez-García, A., Jaccard, S.L., Kuhn, G., Lanny, V., Stuut, J.-B.W., and Winckler, G., 2021. Opposite dust grain-size patterns in the Pacific and Atlantic sectors of the Southern Ocean during the last 260,000 years. Quaternary Science Reviews, 263:106978. https://doi.org/10.1016/j.quascirev.2021.106978
Weber, M.E., Raymo, M.E., Peck, V.L., Williams, T., Armbrecht, L.H., Bailey, I., Brachfeld, S.A., Cardillo, F.G., Du, Z., Fauth, G., García, M., Glüder, A., Guitard, M.E., Gutjahr, M., Hemming, S.R., Hernández-Almeida, I., Hoem, F.S., Hwang, J.-H., Iizuka, M., Kato, Y., Kenlee, B., Martos, Y.M., O’Connell, S., Pérez, L.F., Reilly, B.T., Ronge, T.A., Seki, O., Tauxe, L., Tripathi, S., Warnock, J.P., and Zheng, X., 2021. Site U1537. In Weber, M.E., Raymo, M.E., Peck, V.L., Williams, T., and the Expedition 382 Scientists, Iceberg Alley and Subantarctic Ice and Ocean Dynamics. Proceedings of the International Ocean Discovery Program, 382: College Station, TX (International Ocean Discovery Program). https://doi.org/10.14379/iodp.proc.382.106.2021
Weber, M.E., Bailey, I., Hemming, S.R., Martos, Y.M., Reilly, B.T., Ronge, T.A., Brachfeld, S., Williams, T., Raymo, M., Belt, S.T., Smik, L., Vogel, H., Peck, V.L., Armbrecht, L., Cage, A., Cardillo, F.G., Du, Z., Fauth, G., Fogwill, C.J., Garcia, M., Garnsworthy, M., Glüder, A., Guitard, M., Gutjahr, M., Hernández-Almeida, I., Hoem, F.S., Hwang, J.-H., Iizuka, M., Kato, Y., Kenlee, B., Oconnell, S., Pérez, L.F., Seki, O., Stevens, L., Tauxe, L., Tripathi, S., Warnock, J., and Zheng, X., 2022. Antiphased dust deposition and productivity in the Antarctic Zone over 1.5 million years. Nature Communications, 13(1):2044. https://doi.org/10.1038/s41467-022-29642-5
Weber, M.E., Raymo, M., Peck, V.L., Williams, T., and the Expedition 382 Scientists, 2019. Expedition 382 Preliminary Report: Iceberg Alley and Subantarctic Ice and Ocean Dynamics: International Ocean Discovery Program https://doi.org/10.14379/iodp.pr.382.2019
Weltje, G.J., and Tjallingii, R., 2008. Calibration of XRF core scanners for quantitative geochemical logging of sediment cores: theory and application. Earth and Planetary Science Letters, 274(3–4):423–438. https://doi.org/10.1016/j.epsl.2008.07.054
Wengler, M., Lamy, F., Struve, T., Borunda, A., Böning, P., Geibert, W., Kuhn, G., Pahnke, K., Roberts, J., Tiedemann, R., and Winckler, G., 2019. A geochemical approach to reconstruct modern dust fluxes and sources to the South Pacific. Geochimica et Cosmochimica Acta, 264:205–223. https://doi.org/10.1016/j.gca.2019.08.024
Wu, L., Wilson, D.J., Wang, R., Yin, X., Chen, Z., Xiao, W., and Huang, M., 2020. Evaluating Zr/Rb ratio from XRF scanning as an indicator of grain-size variations of glaciomarine sediments in the Southern Ocean. Geochemistry, Geophysics, Geosystems, 21(11):e2020GC009350. https://doi.org/10.1029/2020GC009350
Wu, S., Lembke-Jene, L., Lamy, F., Arz, H.W., Nowaczyk, N., Xiao, W., Zhang, X., Hass, H.C., Titschack, J., Zheng, X., Liu, J., Dumm, L., Diekmann, B., Nürnberg, D., Tiedemann, R., and Kuhn, G., 2021. Orbital- and millennial-scale Antarctic Circumpolar Current variability in Drake Passage over the past 140,000 years. Nature Communications, 12(1):3948. https://doi.org/10.1038/s41467-021-24264-9