Lamy, F., Winckler, G., Alvarez Zarikian, C.A., and the Expedition 383 Scientists
Proceedings of the International Ocean Discovery Program Volume 383
publications.iodp.org

https://doi.org/10.14379/iodp.proc.383.101.2021
Expedition 383 summary1
G. Winckler, F. Lamy, C.A. Alvarez Zarikian, H.W. Arz, C. Basak, A. Brombacher, O.M. Esper, J.R. Farmer, J. Gottschalk, L.C. Herbert, S. Iwasaki, V.J. Lawson, L. Lembke-Jene, L. Lo, E. Malinverno, E. Michel, J.L. Middleton, S. Moretti, C.M. Moy, A.C. Ravelo, C.R. Riesselman, M. Saavedra-Pellitero, I. Seo, R.K. Singh, R.A. Smith, A.L. Souza, J.S. Stoner, I.M. Venancio, S. Wan, X. Zhao, and N. Foucher McColl2
Keywords: International Ocean Discovery Program, IODP, JOIDES Resolution, Expedition 383, Dynamics of the Pacific Antarctic Circumpolar Current, Site U1539, Site U1540, Site U1541, Site U1542, Site U1543, Site U1544, Southern Ocean, South Pacific, Chilean margin, paleoceanography, Antarctic Circumpolar Current, oceanic fronts, Circumpolar Deep Water, Antarctic Intermediate Water, marine carbon cycle, dust, biological productivity, iron fertilization, southern westerly winds, Patagonian ice sheet, West Antarctic ice sheet
MS 383-101: Published 18 July 2021
Abstract
The Antarctic Circumpolar Current (ACC), the world’s strongest zonal current system, connects all three major ocean basins of the global ocean and therefore integrates and responds to global climate variability. Its flow is largely driven by strong westerly winds and is constricted to its narrowest extent in the Drake Passage. Fresh and cold Pacific surface and intermediate water flowing through the Drake Passage (cold-water route) and warm Indian Ocean water masses flowing through the Agulhas region (warm-water route) are critical for the South Atlantic contribution to Meridional Overturning Circulation changes. Furthermore, physical and biological processes associated with the ACC affect the strength of the ocean carbon pump and therefore are critical to feedbacks linking atmospheric CO2 concentrations, ocean circulation, and climate/cryosphere on a global scale. In contrast to the Atlantic and Indian sectors of the ACC, and with the exception of drill cores from the Antarctic continental margin and off New Zealand, there are no deep-sea drilling paleoceanographic records from the Pacific sector of the ACC. To advance our understanding of Miocene to Holocene atmosphere-ocean-cryosphere dynamics in the Pacific and their implications for regional and global climate and atmospheric CO2, International Ocean Discovery Program Expedition 383 recovered sedimentary sequences at (1) three sites in the central South Pacific (CSP) (U1539, U1540, and U1541), (2) two sites at the Chilean margin (U1542 and U1544), and (3) one site from the pelagic eastern South Pacific (U1543) close to the entrance to the Drake Passage. Because of persistently stormy conditions and the resulting bad weather avoidance, we were not successful in recovering the originally planned Proposed Site CSP-3A in the Polar Frontal Zone of the CSP. The drilled sediments at Sites U1541 and U1543 reach back to the late Miocene, and those at Site U1540 reach back to the early Pliocene. High sedimentation rate sequences reaching back to the early Pleistocene (Site U1539) and the late Pleistocene (Sites U1542 and U1544) were recovered in both the CSP and at the Chilean margin. Taken together, the sites represent a depth transect from ~1100 m at Chilean margin Site U1542 to ~4070 m at CSP Site U1539 and allow investigation of changes in the vertical structure of the ACC, a key issue for understanding the role of the Southern Ocean in the global carbon cycle. The sites are located at latitudes and water depths where sediments will allow the application of a wide range of siliciclastic-, carbonate-, and opal-based proxies to address our objectives of reconstructing, with unprecedented stratigraphic detail, surface to deep-ocean variations and their relation to atmosphere and cryosphere changes.
Introduction
Our prior knowledge of southern high latitude paleoceanography comes from conventional sediment coring and Deep Sea Drilling Project (DSDP)/Ocean Drilling Program (ODP) drilling in the Atlantic and Indian sectors of the Antarctic Circumpolar Current (ACC). A prominent example is ODP Leg 177, which drilled sites along a north–south transect across the major ACC fronts and documented the Cenozoic history of the Atlantic sector of the Southern Ocean. These sites revealed, for example, linked changes in dust supply, marine productivity, and biological nutrient consumption (Martínez-Garcia et al., 2009, 2011, 2014), opposing changes in productivity in the Antarctic compared to the Subantarctic Zone on glacial–interglacial cycles (Jaccard et al., 2013) and in the ACC compared to the Antarctic margin on longer timescales (Cortese et al., 2004), marked steps in sea-surface temperature (SST) evolution since the Pliocene (Martínez-García et al., 2010), and Antarctic Ice Sheet (AIS) dynamics during the late Quaternary (Kanfoush et al., 2002; Teitler et al., 2010, 2015; Venz and Hodell, 2002; Hayes et al., 2014).
In contrast, studies of the Pacific sector of the ACC have been limited mainly to regions close to the Antarctic continental margin south of the ACC (e.g., Ross Sea during DSDP Leg 28 and Antarctic Peninsula during ODP Leg 178). Integrated Ocean Discovery Program Leg 318 drilled Cenozoic sediments off Wilkes Land (eastern Indian Southern Ocean) and revealed significant vulnerability of the East Antarctic Ice Sheet (EAIS) to Pliocene warming (Cook et al., 2013; Expedition 318 Scientists, 2010). A substantial advance in constraining the history and stability of the West Antarctic Ice Sheet (WAIS) and Ross Ice Shelf came from the Antarctic Geological Drilling (ANDRILL) project (e.g., Naish et al., 2009; Florindo et al. 2008), which documented ice sheets that were expanded and stable between 13 and 11 Ma and more dynamic in the late Miocene–late Pliocene (10–2.5 Ma) with cyclic expansion of grounded ice sheets over the coring site after 2.5 Ma.
These on- and near-shore drilling programs have significantly advanced our understanding of AIS dynamics during the Cenozoic. However, to understand how these ice sheet changes are ultimately linked to climate, atmospheric CO2 levels, and ocean circulation requires constraints on the strength, latitudinal extent, and overall nature of the ACC (i.e., the current system that connects Antarctica to the rest of the globe). In this context, the results of Expedition 383 in the Pacific ACC will be closely linked to the recently completed International Ocean Discovery Program (IODP) expeditions to the Ross Sea (Expedition 374), Amundsen Sea (Expedition 379), and Scotia Sea (Expedition 382). These expeditions targeted Antarctic near-shore records, which will likely be incomplete due to glacial erosion, and the potential for analyses of paleoceanographic proxies may be limited. Therefore, Expedition 383, Dynamics of the Pacific Antarctic Circumpolar Current (DYNAPACC), pelagic sites were selected to provide critical paleoceanographic baseline information, including rates of change, for improving the understanding of reconstructed AIS changes and testing ice sheet models.
Background
The ACC, the world’s largest current system, connects all three major basins of the global ocean (i.e., the Pacific, Atlantic, and Indian Oceans; Figure F1) and therefore integrates and responds to climate signals throughout the globe (e.g., Talley, 2013). Through deep mixing, upwelling, and water mass formation, the ACC is fundamentally tied to the global Meridional Overturning Circulation (MOC; Marshall and Speer, 2012) and the stability of Antarctica’s ice sheets.
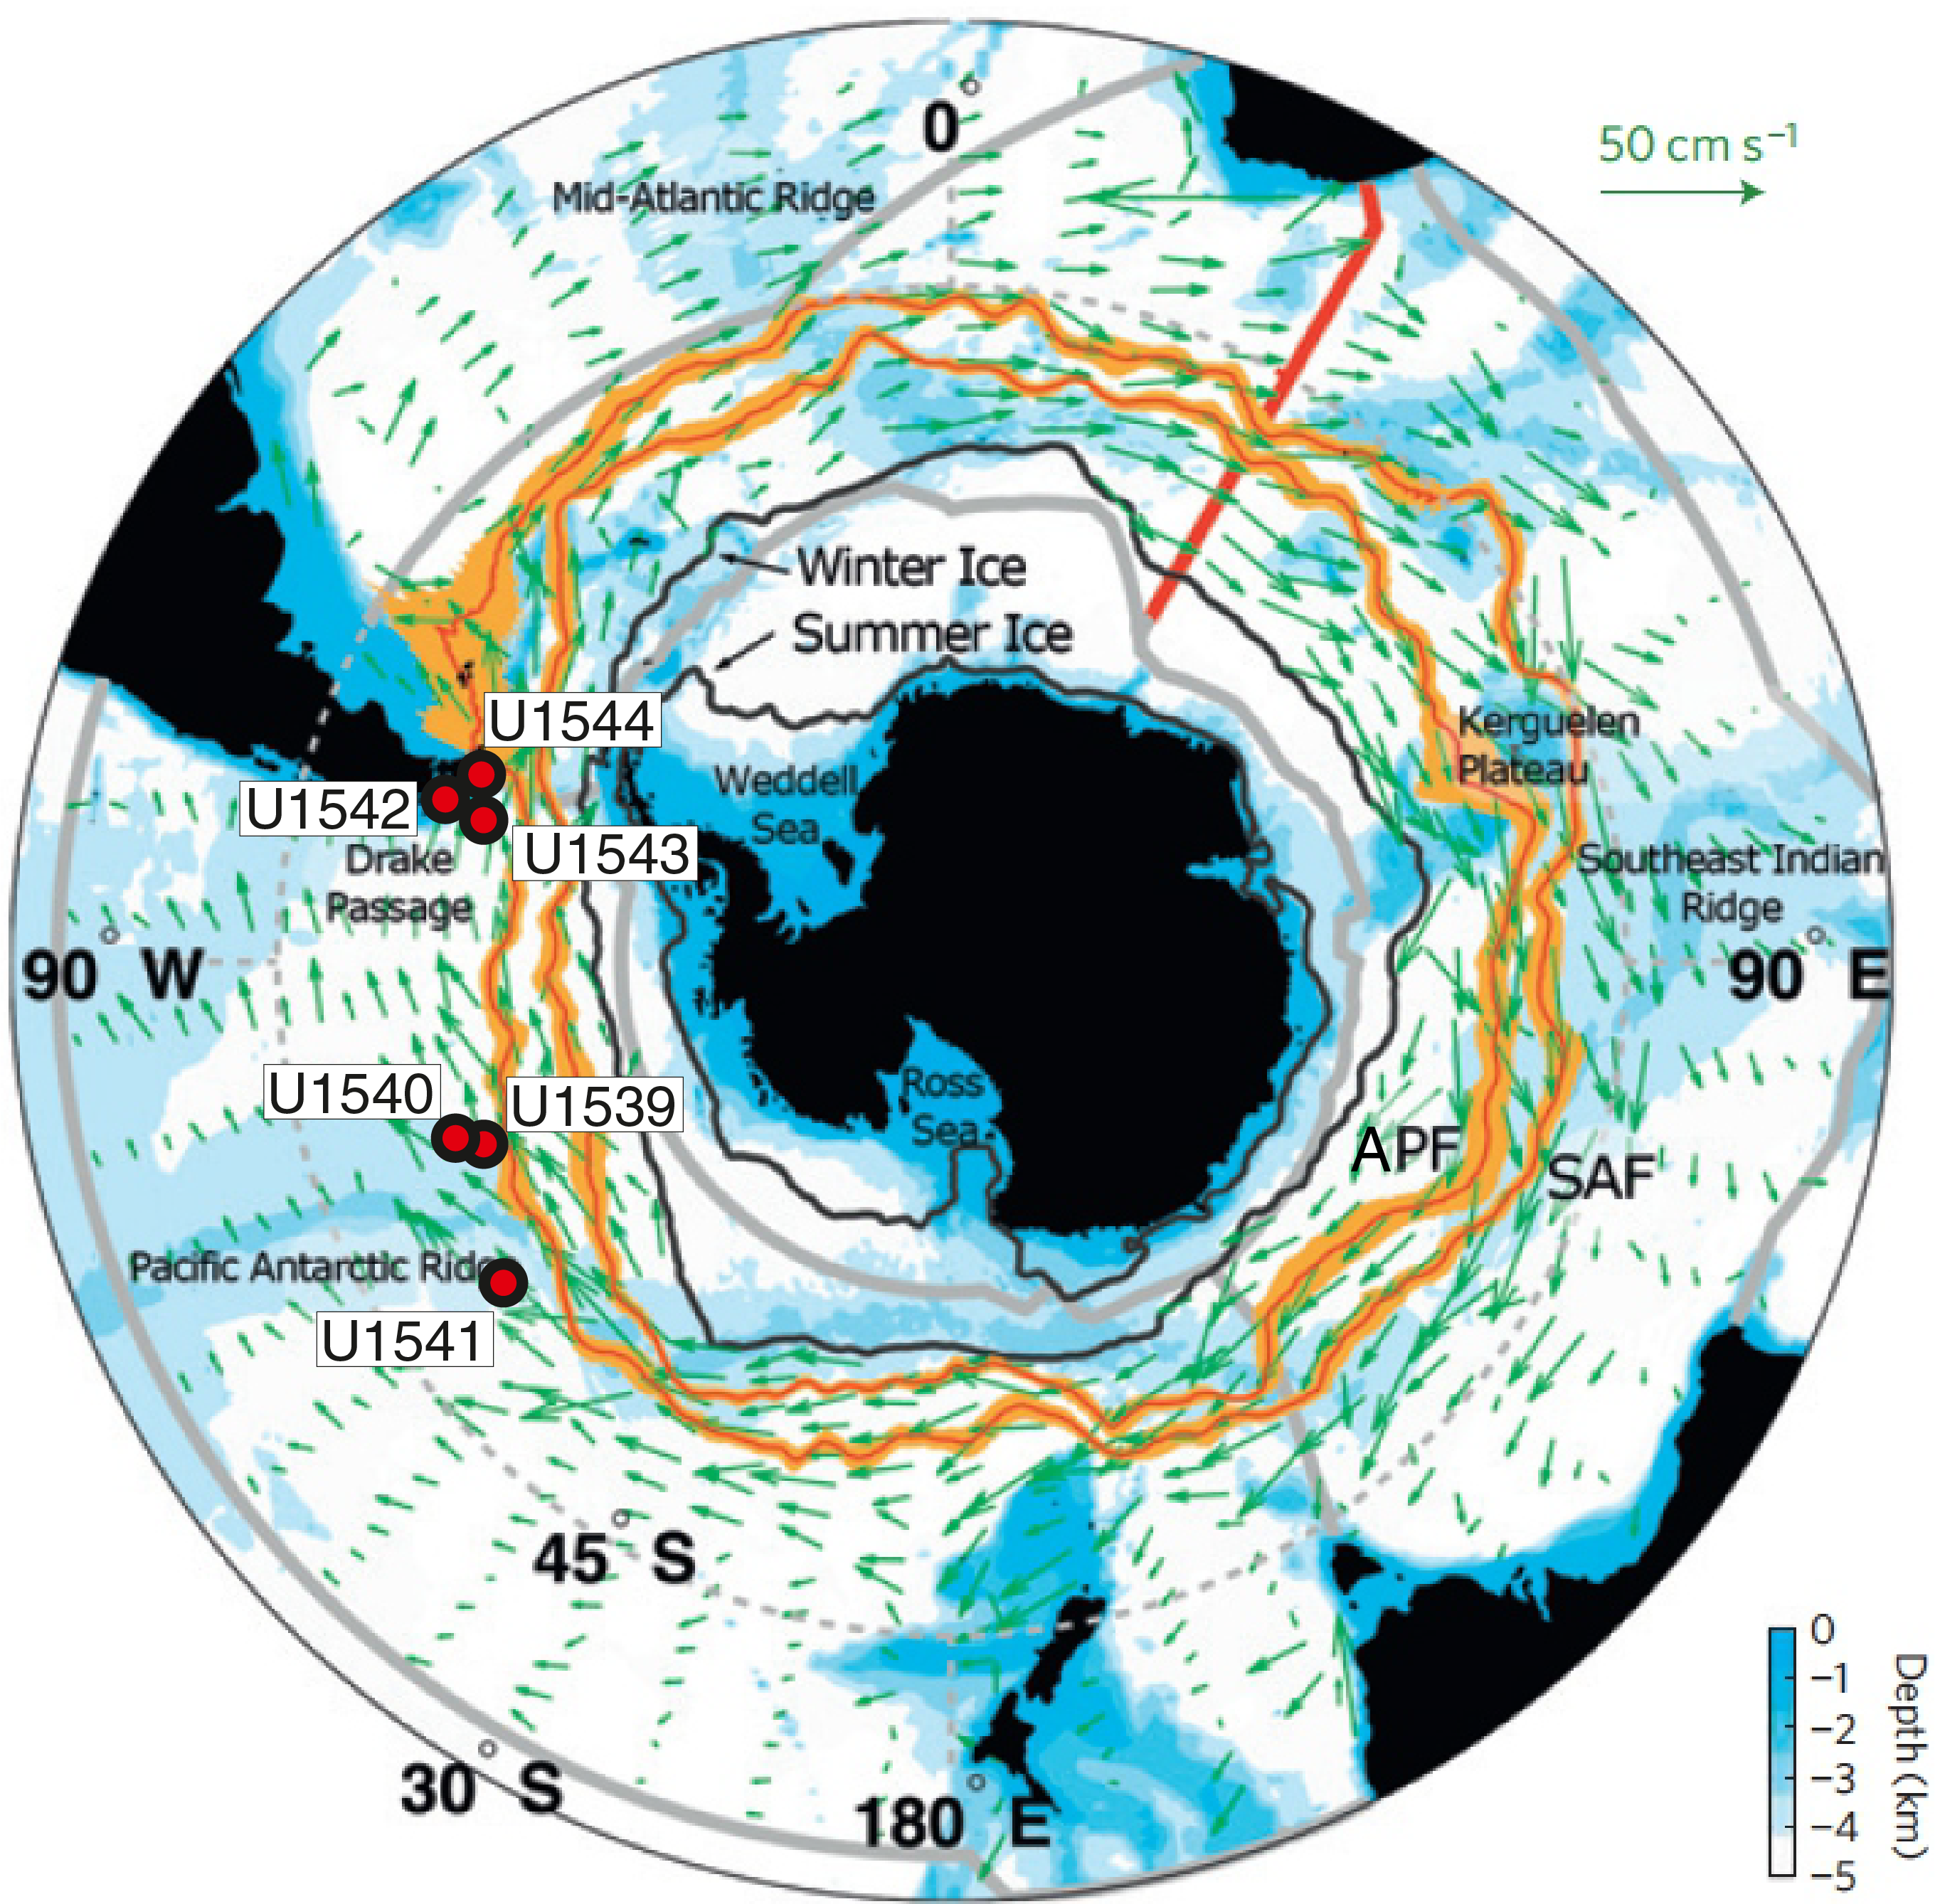
Figure F1. Antarctic Circumpolar Current.
The ACC has long been recognized as a key player in regulating atmospheric CO2 variations and therefore global climate based on the tight coupling between Southern Hemisphere temperatures and atmospheric CO2 concentrations observed in Antarctic ice cores (e.g., Parrenin et al., 2013). Strong, zonally symmetric westerly winds drive a northward Ekman component of flow that promotes ventilation of deep water, which provides a direct hydrographic link between the large deep-ocean reservoir of dissolved inorganic carbon and the surface ocean (e.g., Kuhlbrodt et al., 2007; Marshall and Speer, 2012). The ACC therefore acts as a window through which the interior ocean and atmosphere interact and as a key player in regulating atmospheric CO2 variations and therefore global climate.
Biological utilization of nutrients in the Southern Ocean is particularly important in relation to changes in atmospheric CO2 concentration because it regulates the preformed nutrient inventory for most of the deep ocean and therefore the global average efficiency of the biological pump (e.g., Sigman and Boyle, 2000; Sigman et al., 2010). Nutrient utilization is inefficient in the Southern Ocean today in part because phytoplankton growth is limited by the scarcity of bioavailable iron (e.g., de Baar et al., 1995). Martin (1990) proposed that dust-borne iron fertilization of Southern Ocean phytoplankton caused the ice age reduction in atmospheric CO2. However, the role of iron in explaining variations in opal export to the Southern Ocean sediments is complex. Chase et al. (2015) found a significant correlation between annual average net primary production and modeled dust deposition but not between dust deposition and opal burial. On glacial–interglacial timescales, proxy records from the Subantarctic region support a positive relationship between dust flux and opal production (e.g., Chase et al., 2003; Bradtmiller et al., 2009; Lamy et al., 2014; Kumar et al., 1995; Anderson et al., 2014). The opposite is true south of the Antarctic Polar Front (APF) (e.g., Chase et al., 2003; Jaccard et al., 2013), indicating that factors other than dust regulate the production and export of opal in the Southern Ocean and, by association, the strength and efficiency of the biological carbon pump. Leading candidates for these other factors include changes related to shifts in the hydrographic fronts, the flow of the ACC, the spatial and temporal variability of wind-driven upwelling that supplies nutrients and CO2 to surface waters, and sea ice extent.
Oceanographic setting
Expedition 383 drilled sites located in the ACC system in the central South Pacific (CSP), the eastern South Pacific (ESP) and at the southern Chilean margin close to the Drake Passage. The flow of the ACC is largely driven by Southern Westerly Winds (SWW) and is constricted to its narrowest extent in the Drake Passage. This so-called “cold-water route” through the Drake Passage is one important pathway for the return of fresh and cold waters from the Pacific to the Atlantic, which strongly affects the strength of the Atlantic MOC (AMOC), in concert with the “warm-water route” inflow of warm and salty Indian Ocean water masses through the Agulhas Current system (Beal et al., 2011; Gordon, 1986). The Drake Passage is ~800 km wide, and it is located between Cape Horn and the western Antarctic Peninsula (Figure F1). Numerous hydrographic surveys across the Drake Passage since the 1970s have contributed to the understanding of seasonal and interannual variability in ACC transport through the Drake Passage and the mechanisms forcing physical and biological changes in the Southern Ocean (e.g., Meredith et al., 2011). Despite the insight gained from model simulations (e.g., Meijers, 2014) and from hydrographic time series reaching back 20 y (Koenig et al., 2014) in this relatively well constrained region of the ACC, important issues such as the role of zonal winds in forcing ACC transport remain controversial (Watson et al., 2015).
The total ACC flow transported through the Drake Passage is estimated to be between ~130 and 150 Sv (Koenig et al., 2014; Meredith et al., 2011; Renault et al., 2011). Three major ACC oceanographic fronts (Orsi et al., 1995), the Subantarctic Front (SAF), the APF, and the Southern ACC Front (SACCF), occur from north to south in the Drake Passage. The modern winter sea ice (WSI) margin does not extend significantly north into the Drake Passage. Oceanographic studies show that more than half of the total Drake Passage transport occurs at and north of the SAF (i.e., in the Subantarctic Zone), with the majority of the remaining transport in the Polar Frontal Zone (between the SAF and the APF) (Donohue et al., 2016). The relative contribution of Drake Passage transport south of the APF is generally <20%.
At slightly lower latitudes along the southernmost Chilean margin, the southward flowing Cape Horn Current (CHC), a northern branch of the ACC that continues toward the Drake Passage, provides a major fraction of the present day northern Drake Passage transport (Well et al., 2003). Satellite-tracked surface drifters reveal that after crossing the East Pacific Rise (EPR), Subantarctic surface water of the ACC is transported northeastward across the ESP toward the Chilean coast at ~45°S, 75°W (Chaigneau and Pizarro, 2005). Subsequently, only a minor fraction of the ACC is deflected northward into the Humboldt Current System (HCS), whereas the major fraction is deviated southward toward the Drake Passage within the CHC. The CHC thus transports a significant amount of northern ACC water toward the Drake Passage in a narrow belt ~100–150 km wide off the coast (Chaigneau and Pizarro, 2005) (Figure F2).
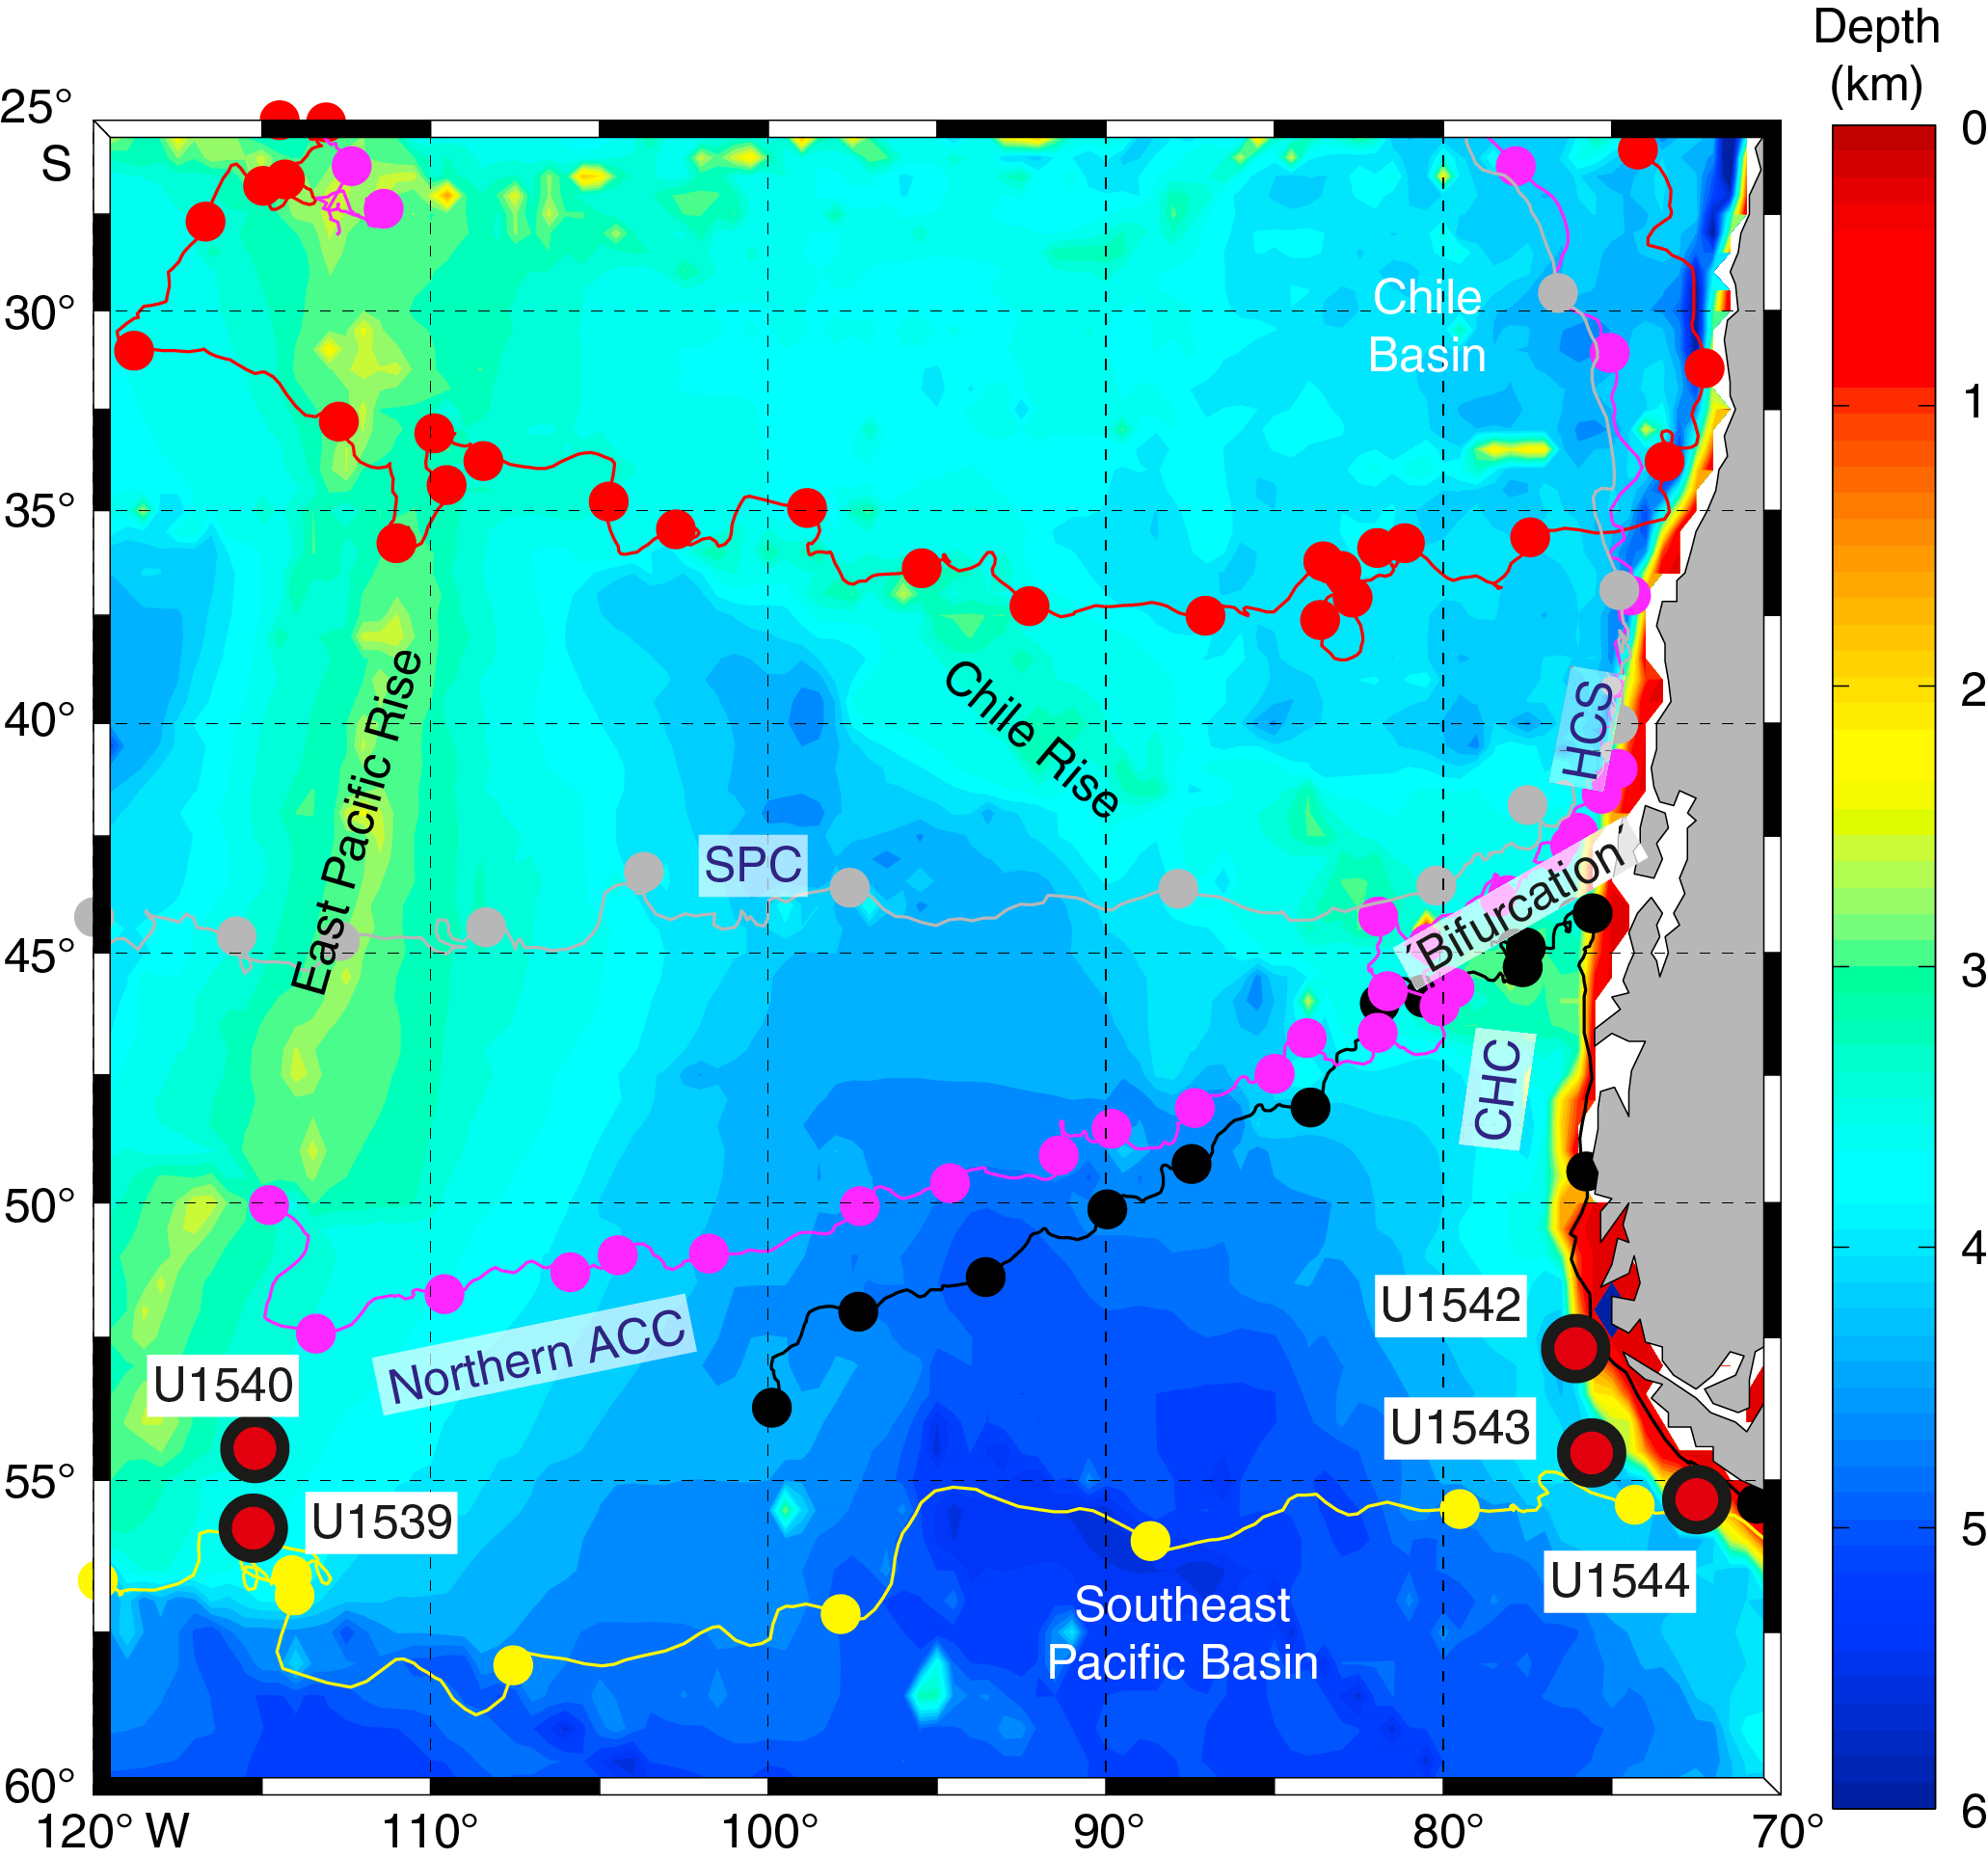
Figure F2. Surface buoy trajectories.
The CSP drill sites are located at Subantarctic latitudes between 56° and 50°S. Sites U1539 and U1540 are located east of the EPR, whereas Site U1541 lies west of the EPR. Unfortunately, the originally proposed drill site south of the APF could not be reached during Expedition 383 because of persistent bad weather conditions. The drilled sites (U1539–U1541) lie in the pathway of the Subantarctic Pacific ACC, 100–170 nmi north of the modern mean position of the SAF in a zonal transition zone of the ACC. These ACC fronts form the core of the ACC and are partly constrained by the bathymetry of the EPR in this area. As a result of seafloor topography, frontal positions in the ACC close to large bathymetric features remain relatively stable at seasonal and interannual timescale, whereas over abyssal plains their location appears to be fairly unstable (Sokolov and Rintoul, 2009). The SAF at the western and eastern flank of the EPR, where our sites are located, is therefore partly constrained by topography and the location of major fracture zones (e.g., Eltanin-Tharp Fracture Zone). Interannual and decadal oceanographic conditions in the South Pacific are influenced by the Southern Annular Mode, by the Amundsen Sea Low, and by tropical variability and the El Niño-Southern Oscillation (Thompson et al., 2011; Turner et al., 2009; Yuan, 2004). At these timescales, SST and sea ice changes are amplified in the Pacific sector of the Southern Ocean; for example, observations of trends from 1979–2011 indicate a distinct increase in sea ice north of the Ross Sea embayment and a strong sea ice decrease in the Bellingshausen-Amundsen Sea (Maksym et al., 2012; Stammerjohn et al., 2012).
A portion of the deep water that upwells south of the APF becomes Antarctic Bottom Water (AABW) close to the Antarctic margin, while Antarctic Intermediate Water (AAIW) and Mode Water is derived from the same deep water mass north of the APF (e.g., Sloyan and Rintoul, 2001; Talley, 2013). The Southeast Pacific is known as the major AAIW formation area where fresh, cold, high-oxygen and low-nutrient waters are formed. Originally, it was thought that AAIW originates from the subduction of Antarctic surface waters below the SAF (e.g., Deacon, 1937). Later, it was suggested that the formation of AAIW is directly linked to the formation of Subantarctic Mode Water (SAMW) (McCartney, 1977), which has similar properties in the Southeast Pacific. More recent studies confirm AAIW formation occurs primarily in the ESP and is related to deep mixed-layer development leading to SAMW formation and finally to AAIW formation (Bostock et al., 2013). The Southern Ocean’s major water mass, the Circumpolar Deep Water (CDW), is divided into upper and lower branches. Lower CDW (LCDW) is identified by a salinity maximum inherited from North Atlantic Deep Water (Reid and Lynn, 1971; Orsi et al., 1995). Upper CDW (UCDW) is typically identified as an oxygen-minimum layer derived from oxygen-depleted, nutrient-rich Indian Deep Water and North Pacific Deep Water (Callahan, 1972). LCDW and UCDW are transported into the North Pacific, where they are transformed into NPDW, and return to the Southern Ocean in the East Pacific along the South American continent at 1500–3500 m water depth (Kawabe and Fujio, 2010). North of the SAF, UCDW is centered at ~1500 m water depth and LCDW covers water depths below 2000 m. Below LCDW, northward-spreading dense AABW formed in the Weddell and Ross Seas and along the Adélie Coast covers the abyss around Antarctica. In the South Pacific, the expansion of Ross Sea Bottom Water, the coldest and saltiest variety of AABW, is restricted by bottom topography to areas south of the Pacific-Antarctic Ridge (Orsi et al., 1995). Miocene to recent Sites U1539–U1541 and U1543 are currently bathed by LCDW, and Chilean continental margin Sites U1542 and U1544 are currently bathed by AAIW and a mixture of CDW and NPDW, respectively.
Geological setting
The drill sites in the CSP are located on oceanic crust near the EPR. Site U1541 is located ~160 nmi west of the crest of the EPR, north of the Eltanin-Tharp Fracture Zone. The basement age (Figure F3) (Eagles, 2006) at this location is about 10 Ma (late Miocene). Sites U1539 and U1540 are located at a similar distance to the fracture zone but ~210 nmi east of the EPR crest on slightly older crust with a middle Miocene basement age of ~15 Ma.

Figure F3. Basement ages of South Pacific oceanic crust.
One of the ESP drill sites (U1543) is located west of the Chile Trench on a topographically elevated ridge ~300 m above the trench axis (~4200 m water depth). The basement at this location is oceanic crust older than ~20 Ma (Eagles, 2006). The other two ESP drill sites (U1542 and U1544) are located at the Chilean margin on continental crust. The southern Chilean margin is characterized by a complex geodynamic setting with oblique convergence between plates, transcurrent motion, and tectonic rotation on land (Polonia et al., 2007). This portion of the South American margin is influenced by the relative movements between three main plates (Antarctica, Scotia, and South America), resulting in a strong segmentation of the southern Chilean margin, which is clearly visible in bathymetric and multichannel seismic (MCS) data (Polonia et al., 2007). Two major fore-arc basins at ~53°–54.5°S and 55°–56.5°S are characterized by thick sediment infill of as much as ~3 km (Figure F4). We drilled one site in the southern fore-arc basin (U1544), where Seismic Line IT97-171 (Figure F4) documents ~3 km of remarkably undeformed sediments (Polonia et al., 2007). This southern basin most likely formed after ridge subduction (14–10 Ma) when convergence resumed, contributing to the construction of the outer bathymetric high that provided the barrier for the accumulation of continent-derived sediments (Figure F4).

Figure F4. Tectonic setting.
North of ~53°S, subduction in the Chile Trench is more orthogonal. Here, the transition between the undeformed Antarctic abyssal plain and the lower slope is very abrupt and results in a steep slope incised by canyons that run perpendicular to the trench axis. Recent sediment cover is minor at the lower slope, but a small-scale sediment depocenter occurs at the upper continental slope near the western entrance to the Strait of Magellan. Site U1542 is located at this sediment drift, which contains a sediment sequence as thick as ~700 m that most likely does not extend beyond the early Pleistocene because of high sedimentation rates.
Scientific objectives
The overall goal of Expedition 383 is to improve our knowledge of late Miocene to recent atmosphere-ocean dynamics of the ACC in the Pacific and their implications for regional and global climate and atmospheric CO2 using sediment records with the highest possible resolution. The sites (Table T1; Figure F1) are located at latitudes and water depths where sediments will allow the application of a wide range of siliciclastic-, carbonate-, and opal-based proxies for reconstructing surface to deep-ocean variations and their relation to atmosphere and cryosphere changes with unprecedented stratigraphic detail. The cores recovered during Expedition 383 will allow us to test two major scientific hypotheses.
- Hypothesis H1: ACC dynamics and Drake Passage throughflow conditioned the global MOC and high–low climate linkages on orbital and submillennial timescales since the Pliocene.
The Drake Passage is the major geographic constriction for the ACC and forms an important pathway for the return of upper waters to the Atlantic through the cold-water route of the AMOC (Gordon, 1986). Resolving changes in the flow of circumpolar water masses through the Drake Passage is crucial for advancing our understanding of the Southern Ocean’s role in affecting ocean and climate change on a global scale. Surface and intermediate water masses flowing through the Drake Passage, together with the warm-water route inflow of Indian Ocean water through the Agulhas Current system, strongly affect AMOC (Beal et al., 2011; Knorr and Lohmann, 2003). Complementary sites below the warm-water route were drilled during IODP Expedition 361 (Hall et al., 2015).
The role of the Drake Passage throughflow in driving changes in global MOC on glacial–interglacial and millennial timescales is not well constrained (Knorr and Lohmann, 2003; McCave et al., 2014). For the last glacial cycle, Lamy et al. (2015) reconstructed Drake Passage throughflow based on a sediment record (MD07-3128) from the Chilean margin close to Site U1542 and another record from the southernmost Argentinean continental slope and found a significant glacial decrease in Drake Passage throughflow (Figure F5). This finding is consistent with generally reduced current velocities of the ACC during glacials and concomitant reduction in interbasin exchange in the Southern Ocean that is most likely regulated by variations in the SWW field over the Subantarctic Zone and changes in Antarctic sea ice extent. However, the link between ACC flow through the Drake Passage and changes in the AMOC are still not well established.
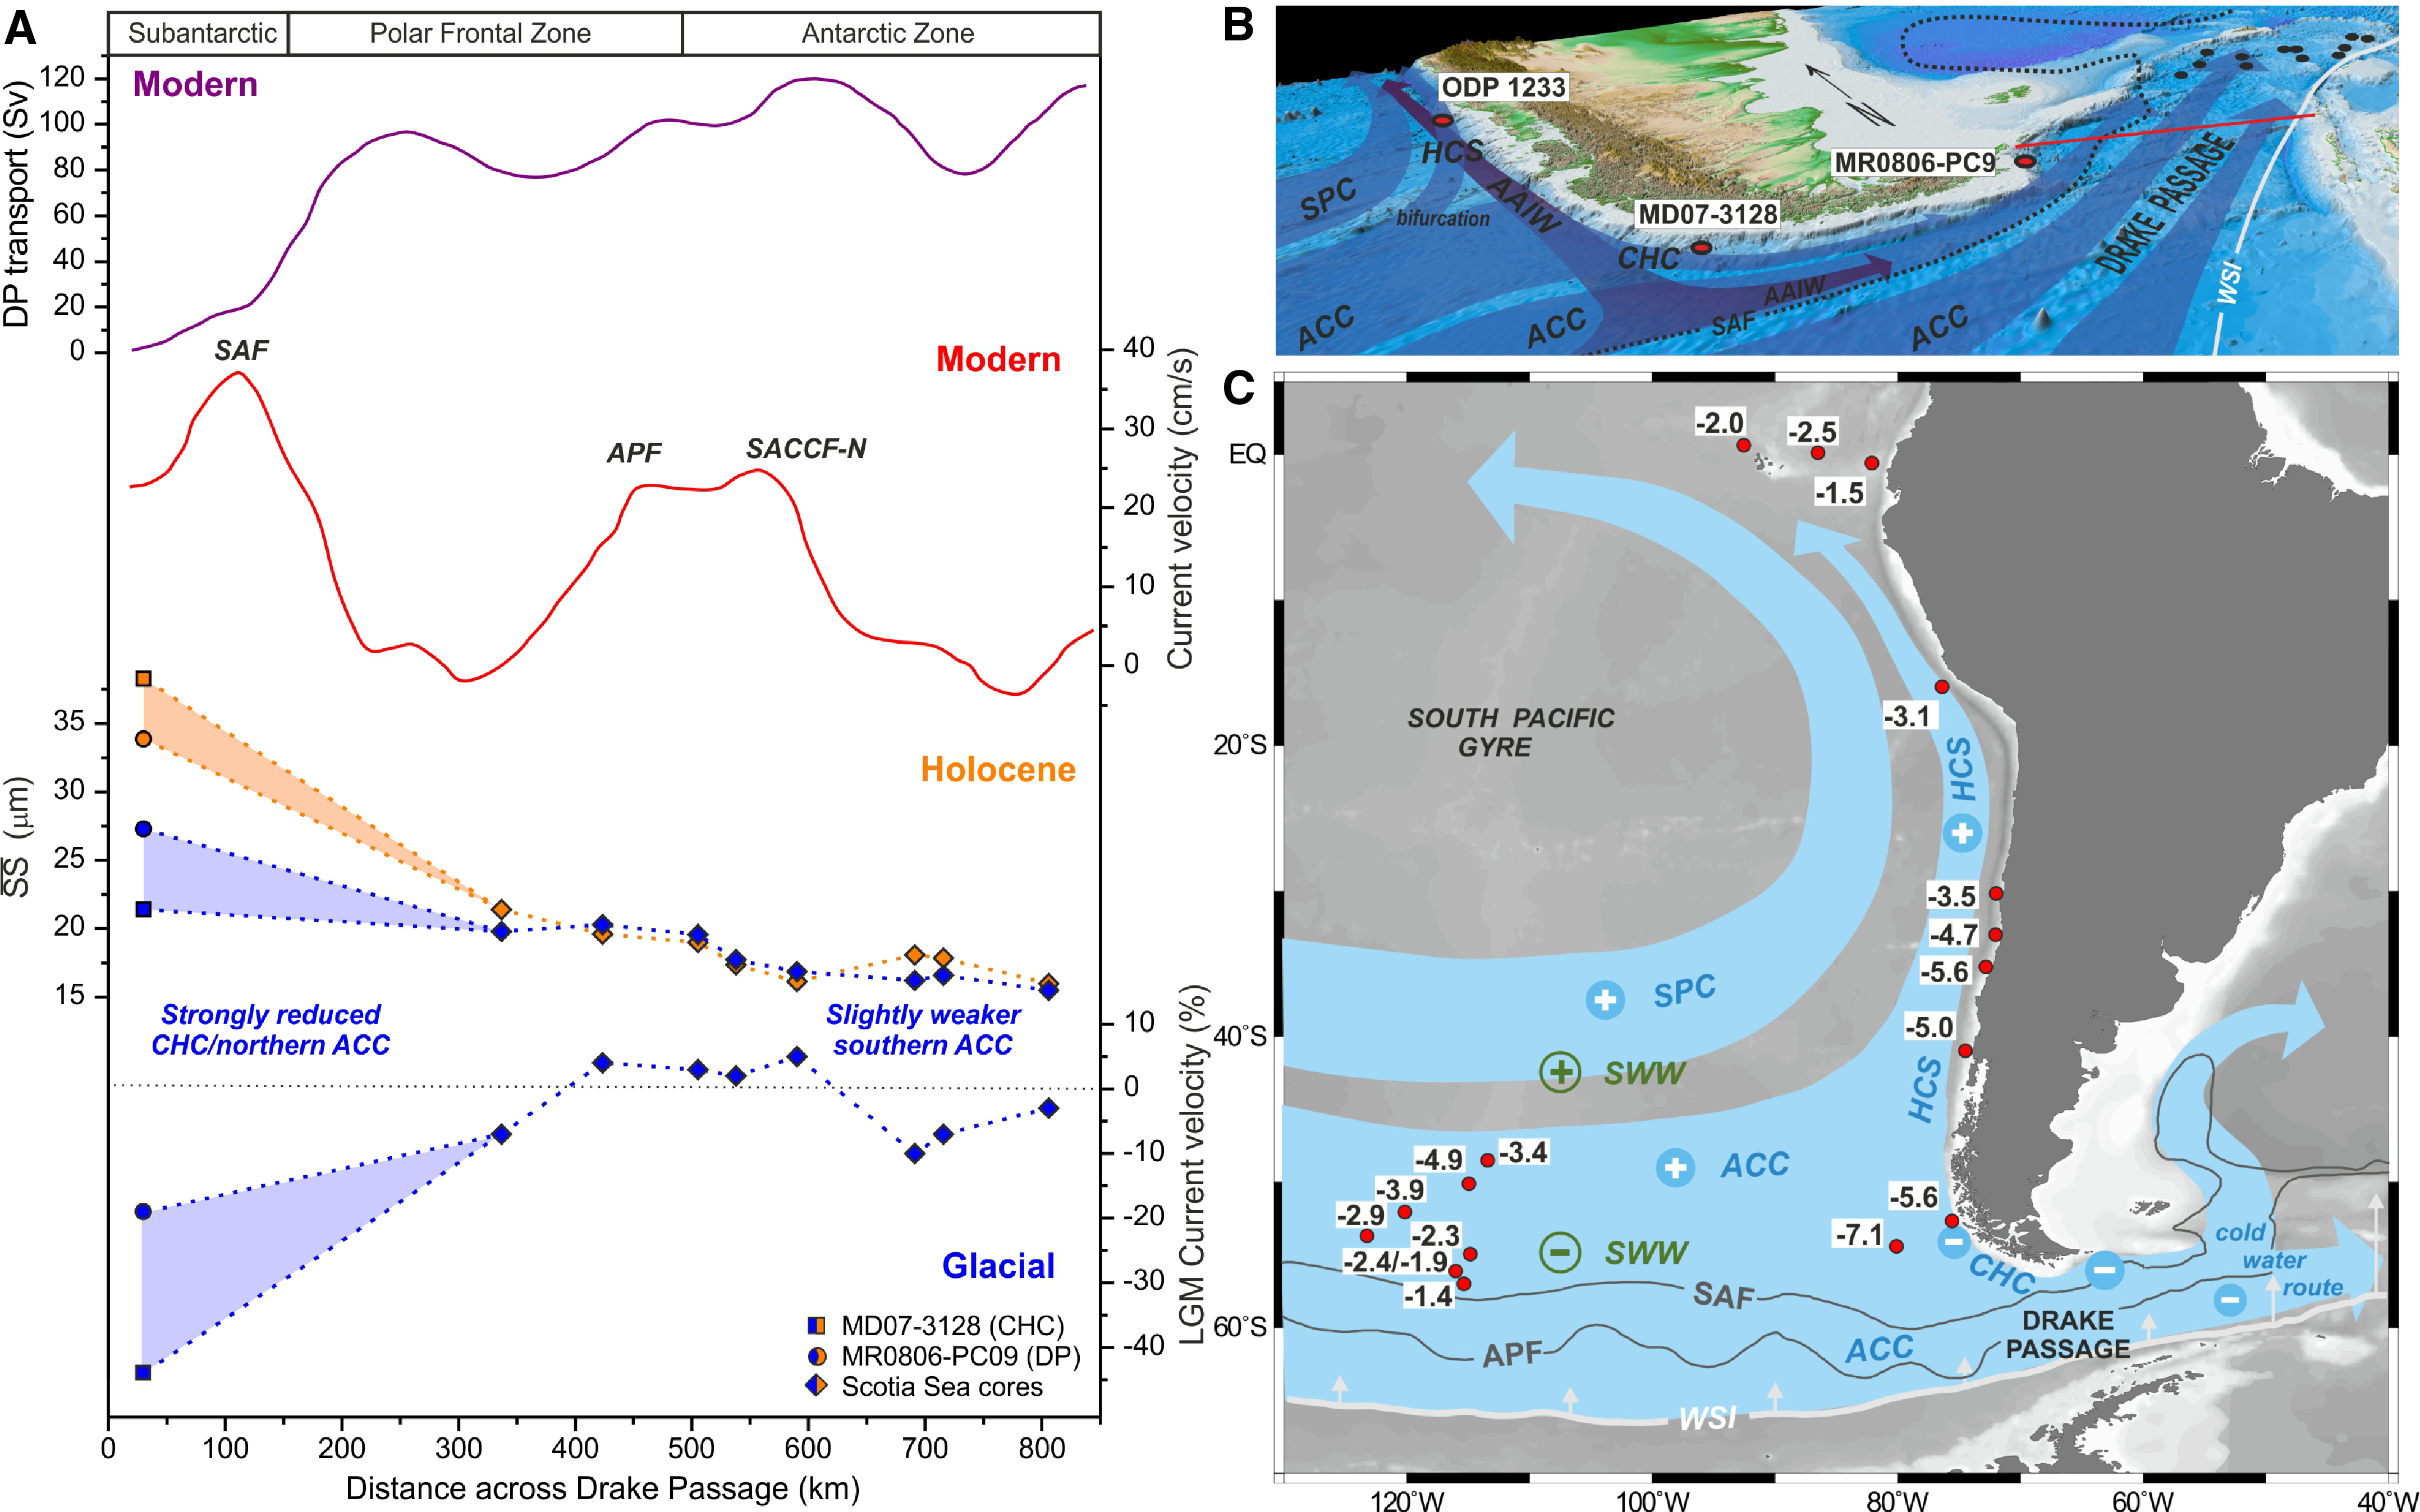
Figure F5. Central and eastern South Pacific paleoceanography and Drake Passage throughflow.
Past studies suggest that there are likely regional differences in how the ACC varies on glacial–interglacial timescales. For example, downstream of the Drake Passage, a meridional section of sediment records from the Scotia Sea revealed little overall bottom current speed variations between the Last Glacial Maximum (LGM) and the Holocene (McCave et al., 2014). In the Indian sector of the Southern Ocean, a 500 ky record suggests that the ACC was weak during warm stages and strong during glacial intervals (Mazaud et al., 2010). Likewise in the southwest Pacific, the deep western boundary current east of New Zealand intensified during glacial periods over the past 1.2 My (Hall et al., 2001), a change that has been related to a northward extension of the ACC along the New Zealand continental margin. Finally, a recent density reconstruction (based on benthic foraminifers) across the ACC south of Australia suggested a moderate increase of the ACC flow during the LGM (Lynch-Stieglitz et al., 2016). Taken together, there is substantial disagreement about the ACC flow speed. Given the evidence for substantial regional differences in ACC behavior, it has been particularly challenging to make the link between Drake Passage throughflow and changes in the AMOC dynamics on glacial–interglacial timescales.
Superimposed on the long-term glacial reduction of Drake Passage throughflow, prominent high-amplitude, millennial-scale variability was observed, implying that the northern ACC in the Southeast Pacific has a strong sensitivity to, or role in, suborbital climate variations (Lamy et al., 2015). Enhanced Drake Passage throughflow during Antarctic warm periods is consistent with the previously suggested impact of the bipolar seesaw mechanism on the Southern Ocean (e.g., Anderson et al., 2009; Lamy et al., 2007), which includes surface water warming, enhanced upwelling, and a stronger ACC caused by southward-shifted SWW. The glacial reduction of the cold-water route occurred in concert with the well-documented decrease of the warm-water route (Agulhas leakage; Beal et al., 2011). The data currently available thus indicate that both of these oceanographic corridors are critical for the South Atlantic contribution to glacial AMOC strength changes.
Our sites along the south Chilean margin (U1542 and U1544) and in the ESP (U1543) (Figure F2) provide a unique opportunity to extend the existing ESP 60 ky record (Lamy et al., 2015) back into the early Pleistocene and Pliocene to investigate the role of long-term, orbital-scale, and millennial-scale changes in ACC strength and Drake Passage throughflow on Antarctic and global climate change, including warmer-than-present interglacials (e.g., Marine Isotope Stages [MISs] 5e, 11, and 31) and Late Neogene warm periods.
In the Pacific sector of the Southern Ocean, pronounced past changes in surface-ocean properties at both millennial and orbital timescales, particularly SSTs, indicate an exceptional climate sensitivity to external and internal forcing. Glacial–interglacial amplitudes in Subantarctic SSTs are generally >4°C in the Atlantic (Gersonde et al., 2005; Martínez-García et al., 2010), Indian (e.g., De Deckker et al., 2012; Lorrey et al., 2012), and Pacific Southern Ocean (Caniupán et al., 2011; Ho et al., 2012; Pahnke et al., 2003). Millennial-scale fluctuations with amplitudes of ~2°–3°C are observed at continental margin sites in the Subantarctic Pacific during the last glacial (Barrows et al., 2007; Caniupán et al., 2011; Lamy et al., 2004; Pahnke et al., 2003). Furthermore, there is evidence from studies of Subantarctic surface ocean variability that high, middle, and low latitude ocean conditions are strongly linked. High-amplitude glacial–interglacial SST changes in the Subantarctic Pacific sector of the Southern Ocean (Ho et al., 2012) are closely coupled to those observed in the subtropical ESP, implying large shifts of the northern ACC system and export of Subantarctic surface water masses into the HCS. This variability is probably directly related to variations in the strength and position of the ACC fronts, the SWW, and Drake Passage throughflow (Lamy et al., 2015) (Figure F5). Along the Chilean margin, glacial cooling implies a stronger northward extension of the Antarctic cold water in the ESP (Ho et al., 2012) compared to the central Pacific (Figure F5). The significant glacial decrease in Drake Passage transport accompanied by a reduction of the ACC transport strongly reduced the interbasin water mass exchange and enhanced the high–low latitude exchange in the Pacific Eastern Boundary Current system. The reacceleration of Drake Passage transport during the deglaciation matches major warming in the Subantarctic Southeast Pacific and South Atlantic (Barker and Diz, 2014), suggesting a close coupling of Drake Passage throughflow to the initiation of Southern Hemisphere warming.
Evidence for the link between the ESP and far-field oceanographic changes can also be inferred from millennial-scale changes in Drake Passage throughflow (Lamy et al., 2015) that are paralleled by SST changes in the Southeast Pacific (ODP Site 1233) (Kaiser and Lamy, 2010) that extend north to the cold tongue in the eastern tropical Pacific (Lea et al., 2006). These data imply that substantial changes in the oceanographic dynamics of the South Pacific Gyre are related to the northward deflection of ACC waters at millennial timescales. The suggested enhanced glacial northward export of cold-water masses to the tropical Pacific reinforces modeling studies showing the importance of southerly derived surface and intermediate water masses in the tropical Pacific for global cooling during the LGM (Liu et al., 2002). Paleoceanographic reconstructions based on our sites at the Chilean margin (U1542 and U1544) and in the ESP (U1543) in combination with ODP Leg 202 sites (Figure F6) (e.g., Dekens et al., 2007; Lamy et al., 2004; Pena et al., 2008; Rincon-Martinez et al., 2009) and the JR100 expedition (http://iodp.tamu.edu/
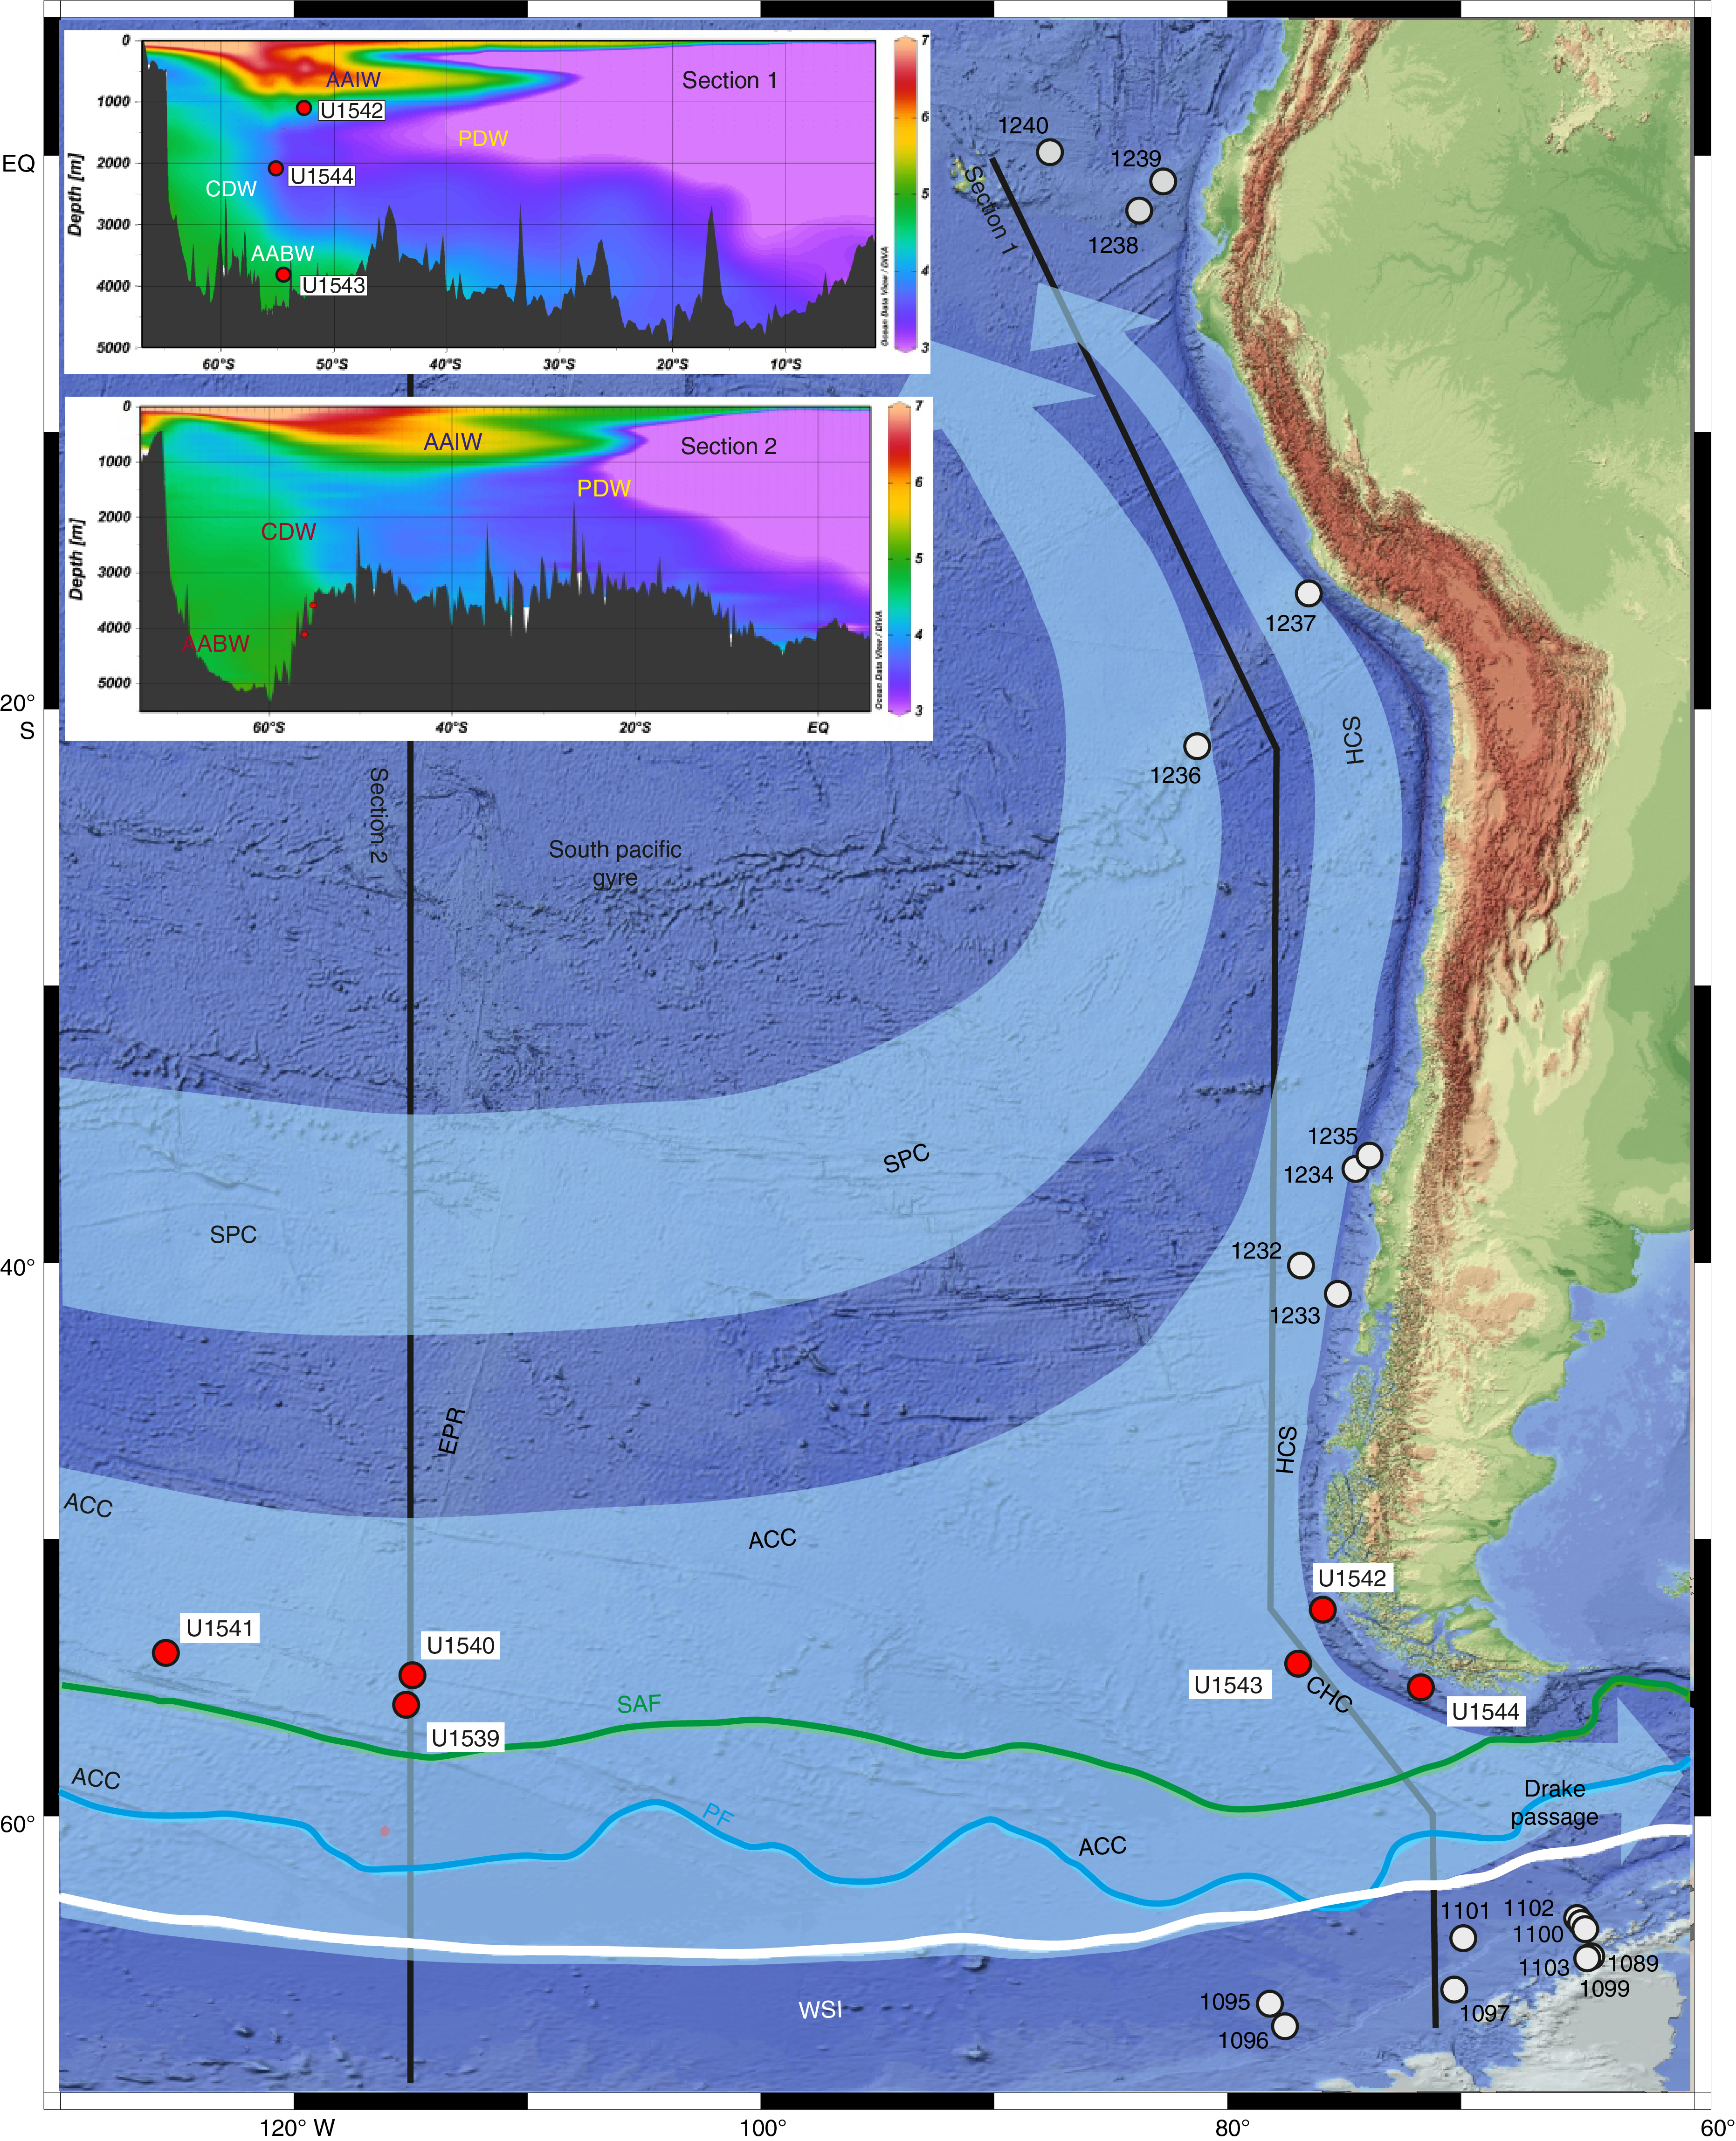
Figure F6. Pacific ACC sites and cores.
Our drill sites will allow us to better constrain the latitudinal shifts of the Southern Ocean fronts over time to understand the resulting changes in ACC transport, intrabasin mixing, and AAIW production over a wider range of climate states. For example, reconstructions of past changes in the latitudinal position of the SAF suggest as much as 9° latitude northward shifts during glacials, whereas other areas suggest no shift at all (Kohfeld et al., 2013). Smaller shifts probably occurred where the front is bathymetrically confined, like in the vicinity of the EPR (CSP sites). Large shifts likely occurred in the ESP with the SAF potentially located north of the Drake Passage during peak glacials (Gersonde et al., 2003; Ho et al., 2012; Lamy et al., 2015). As stated above, these changes may substantially affect the Drake Passage throughflow and low–high latitude exchange of heat and nutrients with major implications for the global climate development. Farther south, Benz et al. (2016) reconstructed a glacial WSI expansion by ~2°–3° in latitude in the western part of the Pacific sector and an even stronger shift (~5° in latitude) of both the SACCF and the WSI edge in the central part (Figures F6, F7). This west–east differentiation in the winter SST pattern and sea ice extent can be related to differences in topographic and atmospheric forcing (Benz et al., 2016).
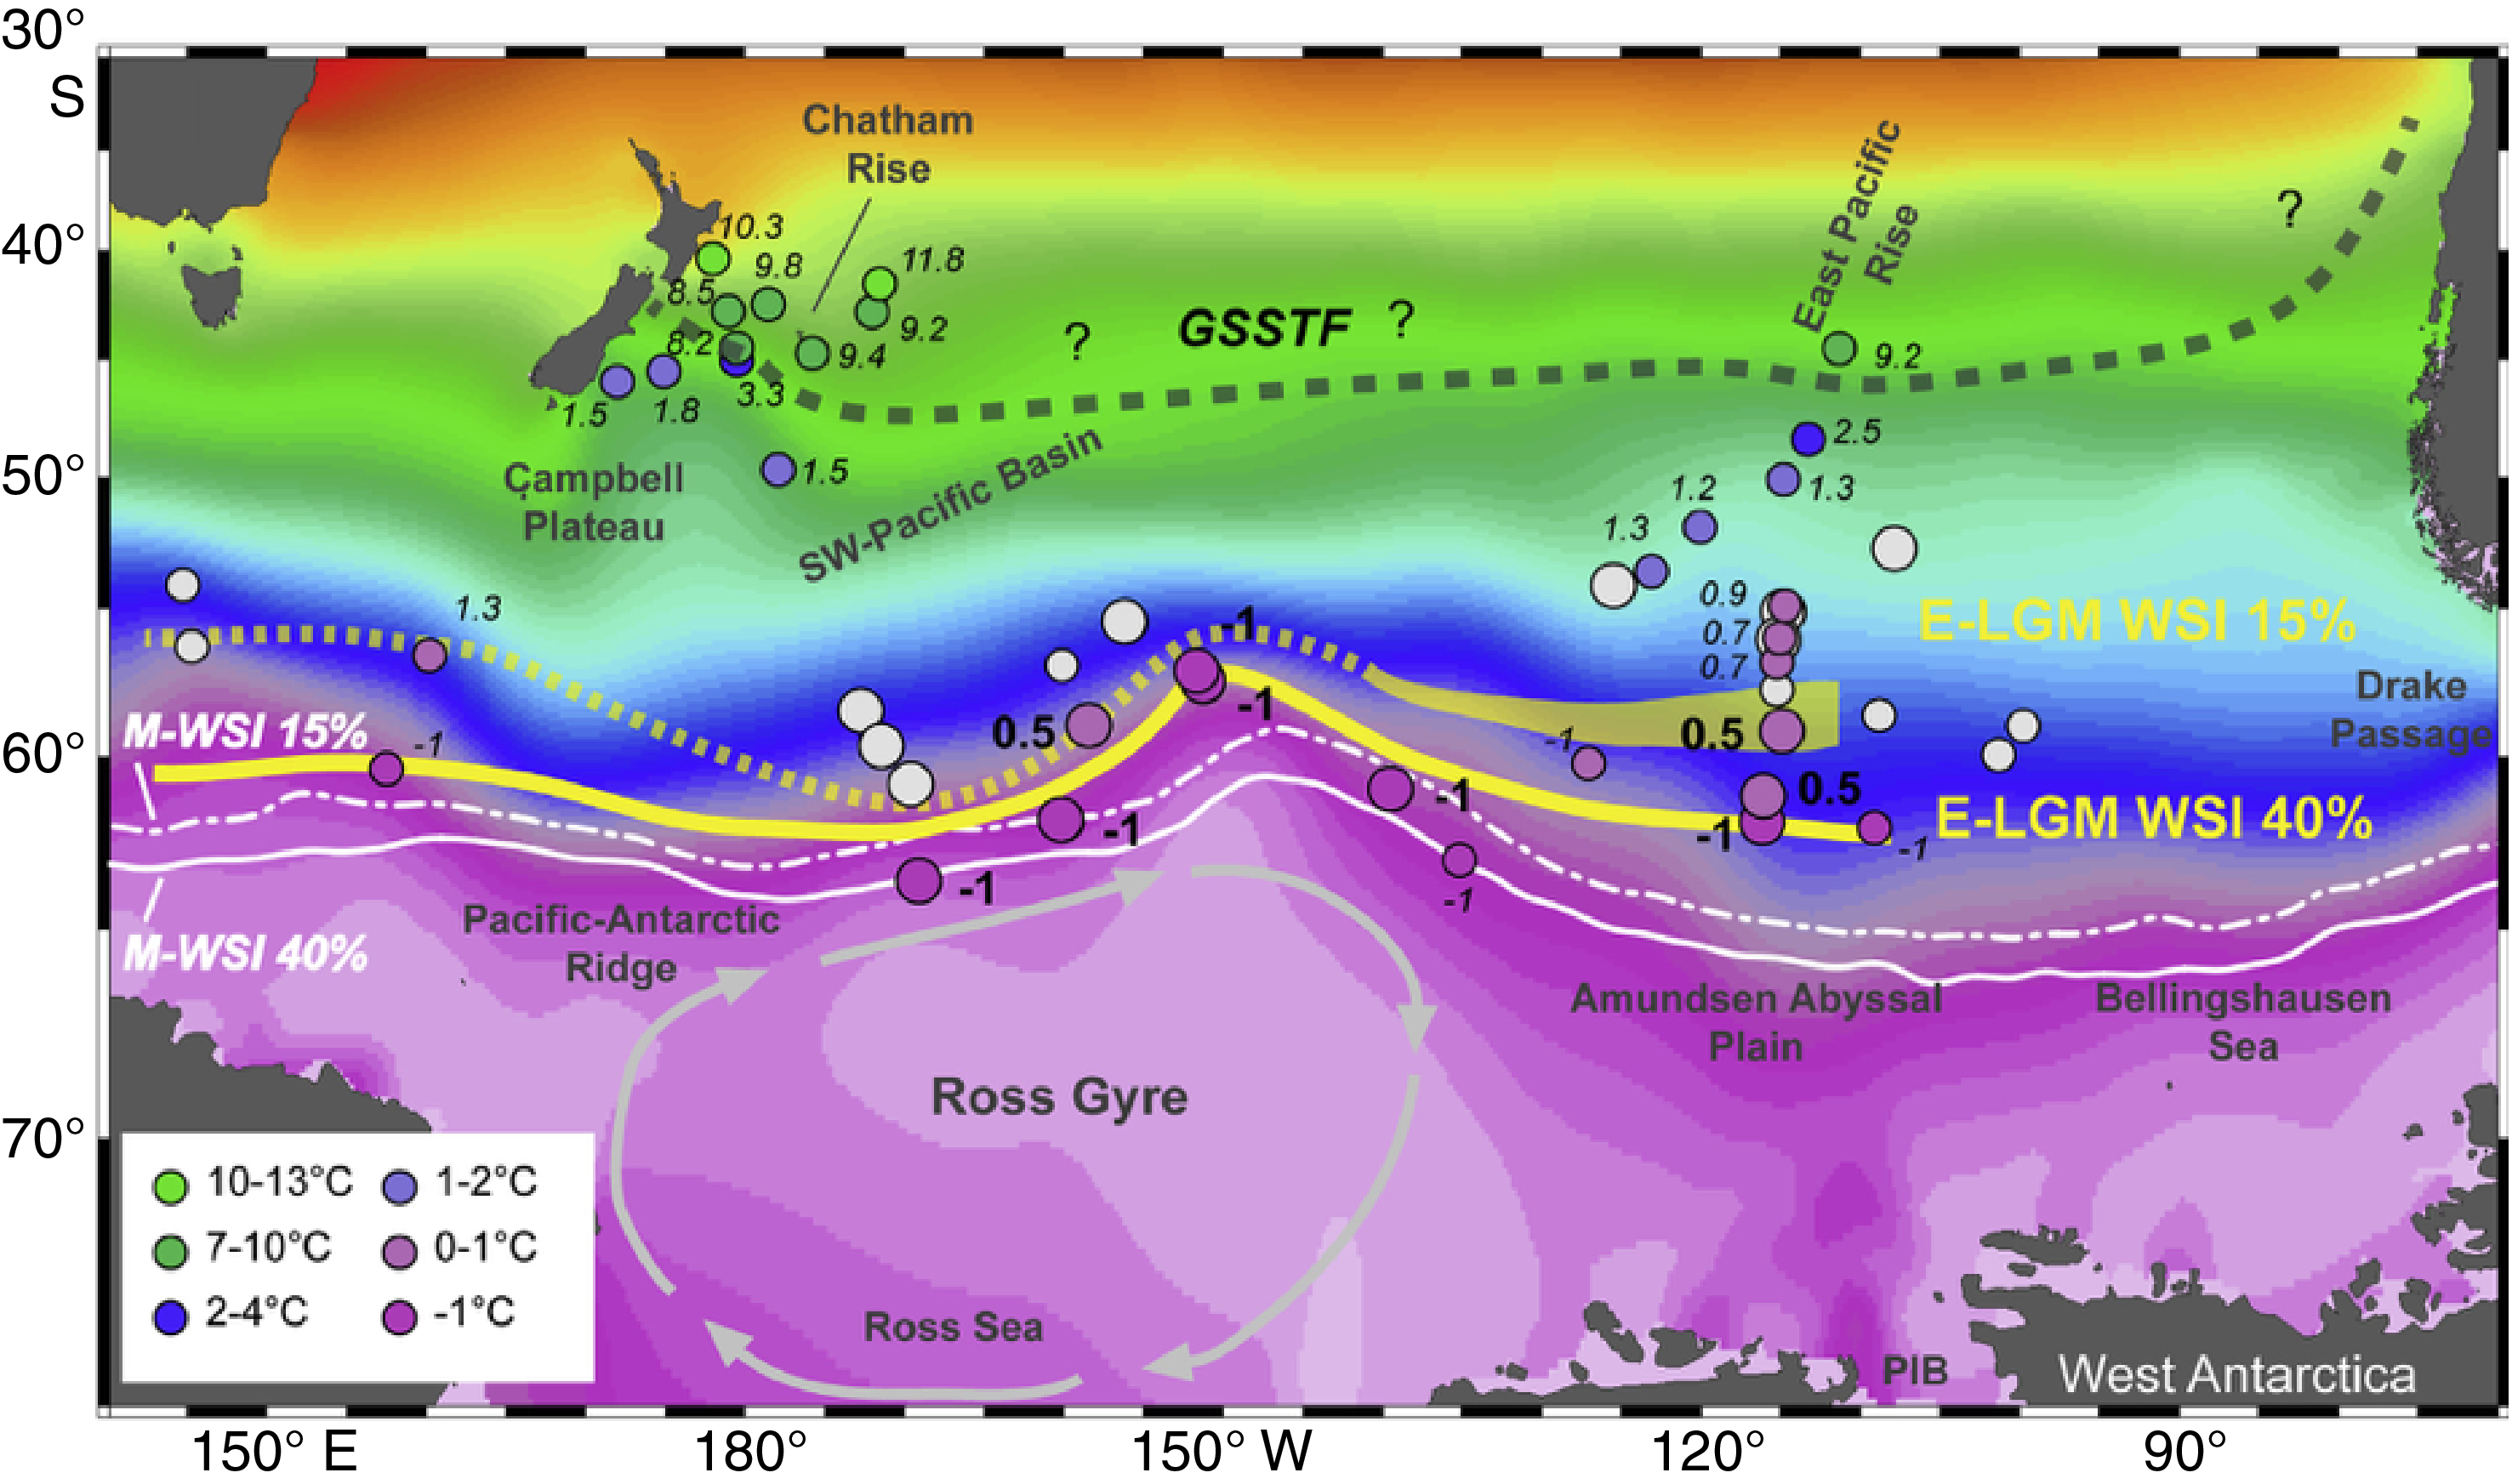
Figure F7. LGM winter sea-surface temperatures and sea ice extent.
Despite the potential importance of the Subantarctic Southern Ocean in global climate change, there have been very few studies that focus on the role of the ACC in the evolution of the cryosphere and of the low–high latitude climate system connectivity from the warm Pliocene and into the Pleistocene. Only one SST record is available that reaches back to the Pliocene (ODP Site 1090 in the Subantarctic Atlantic) (Figure F8). Here, the major cooling phase after ~1.6 Ma coincides with the emergence of the eastern tropical Pacific cold tongue and an intensification of the meridional temperature gradients (Martínez-García et al., 2010) (Figure F4). The ANDRILL records suggest that high latitude climate cooling between 3.0 and 2.5 Ma drove both the WAIS and EAIS toward their present expanded cold polar state (Naish et al., 2009). The intensification of Antarctic cooling resulted in strengthened SWW and northward migration of Southern Ocean fronts, which would restrict water exchange between ocean basins beginning after 3.3 Ma (McKay et al., 2012). Warm early Pleistocene and Pliocene SSTs are consistent with the poleward expanded warm pool (Brierley et al., 2009).
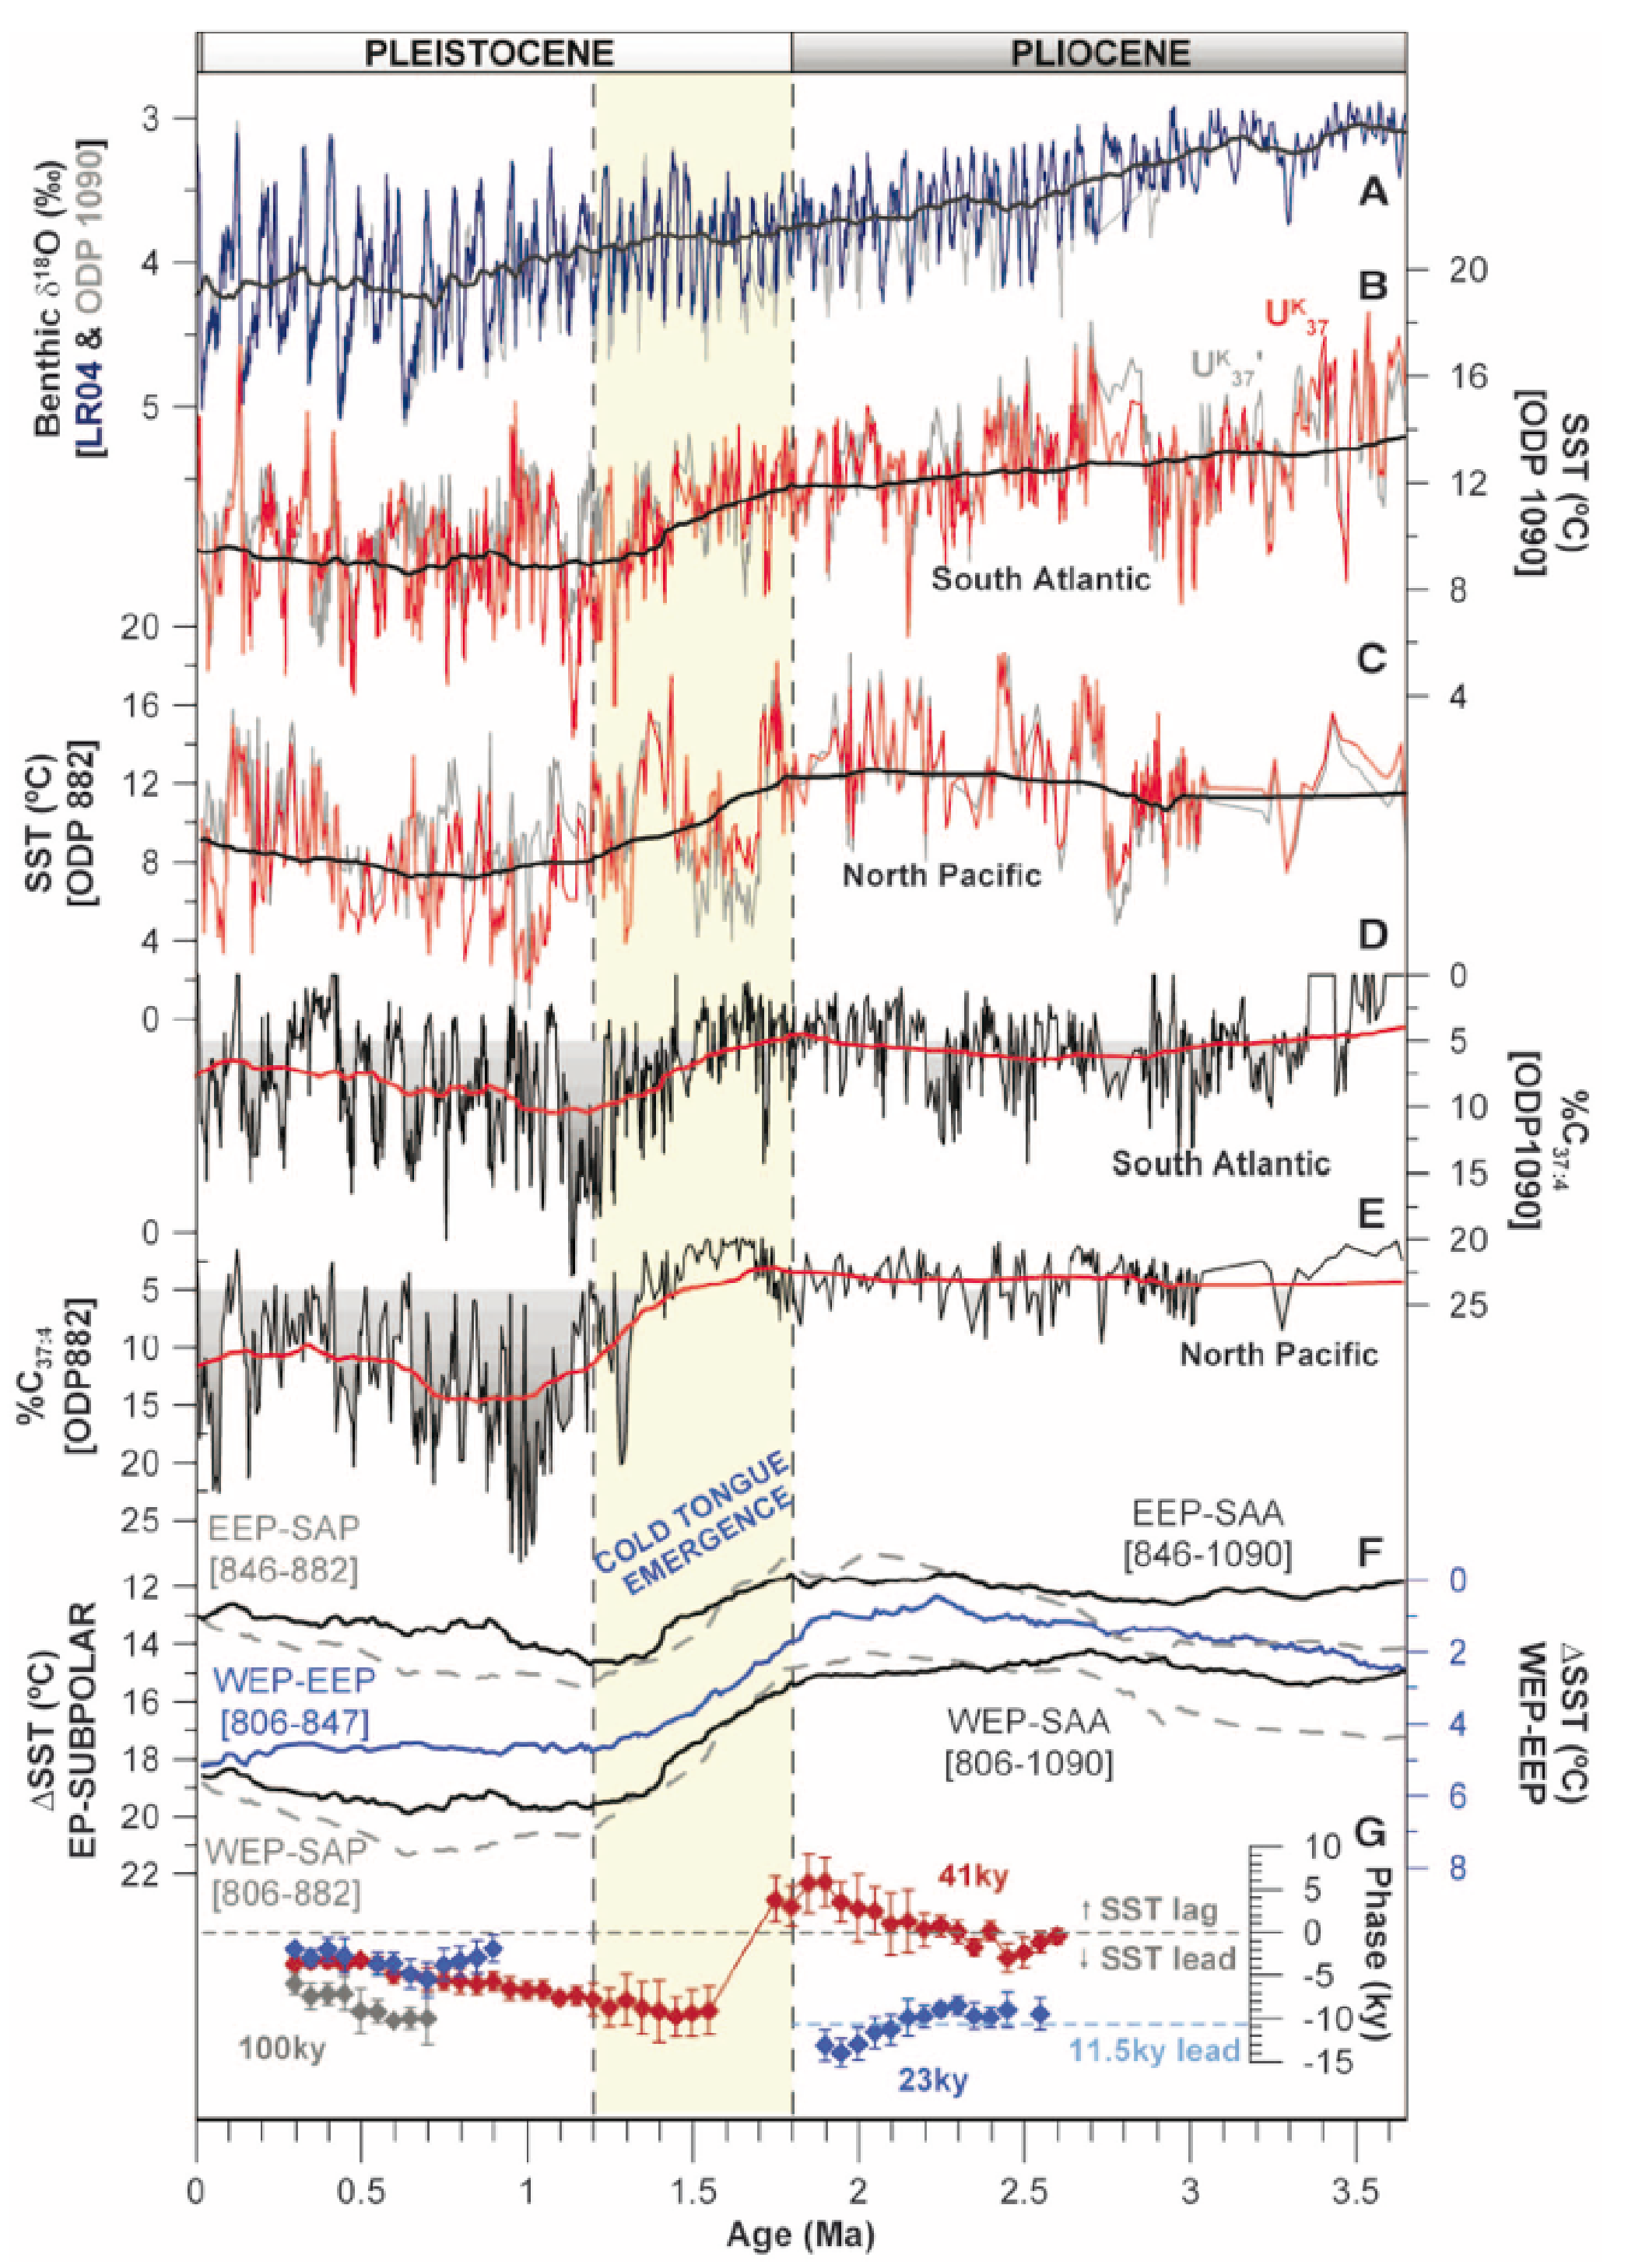
Figure F8. Pliocene to recent SST and %C37:4 changes.
Our sites from the CSP (U1539–U1541) will allow a more comprehensive assessment of its temperature evolution and relation to atmospheric variations of the SWW, sea ice, AIS variability, and low latitude climate change during cold and warmer-than-present (e.g., MISs 5, 11, and 31 and the Pliocene warming) time periods. Information on warm periods is critical to the assessment of the Southern Ocean’s role under future warming; this is especially true for the AIS melting and associated sea level rise because ice sheet modeling and modern observations show that oceanic forcing is the most important determinant of AIS melting (Pollard and DeConto 2009; Paolo et al., 2015).
Moreover, temperature records from our high-resolution sites at the Chilean margin (U1542 and U1544) and CSP (U1539 and U1540) will allow us to compare millennial-scale variations between the Pacific Southern Ocean and Antarctica for a time interval that is well beyond the reach of ice cores. Even on a global scale, such millennial-scale temperature records back into the Pliocene are rare (e.g., Integrated Ocean Drilling Program Site U1313 [Naafs et al., 2013] and ODP Site 980 [McManus et al., 1999]).
- Hypothesis H2: variations in the Pacific ACC determine the physical and biological characteristics of the oceanic carbon pump and atmospheric CO2.
Atmosphere-ocean-cryosphere interactions and teleconnections between high and low latitudes play an important role in past and future climate change, and the Subantarctic Southern Ocean provides the major link between Antarctica and the low latitudes. In the Southern Ocean, atmosphere-ocean interactions are believed to control sea ice cover, AIS dynamics, upper ocean stratification, biological nutrient utilization, and exposure rates of deep water. Thus, they have been considered to play a key role in explaining the variability in atmospheric CO2 concentrations, which are controlled by biogeochemical and physical processes.
The SWW strongly impact the upwelling of carbon-rich deep-water masses in the Southern Ocean that affect atmospheric CO2 (e.g., Toggweiler 2006, Anderson et al., 2009) and also control the return flow of intermediate waters to the tropics (Figure F9). Moreover, the SWW exert an important control on upwelling of relatively warm deep water at the West Antarctic continental shelf, where it causes sub–ice shelf melting and mass loss of the WAIS (e.g., Steig et al., 2012). Thus, the SWW are thought to play a key role in past and future climate change, yet their strength and position in colder and warmer climates relative to today remain a wide-open question (Kohfeld et al., 2013).
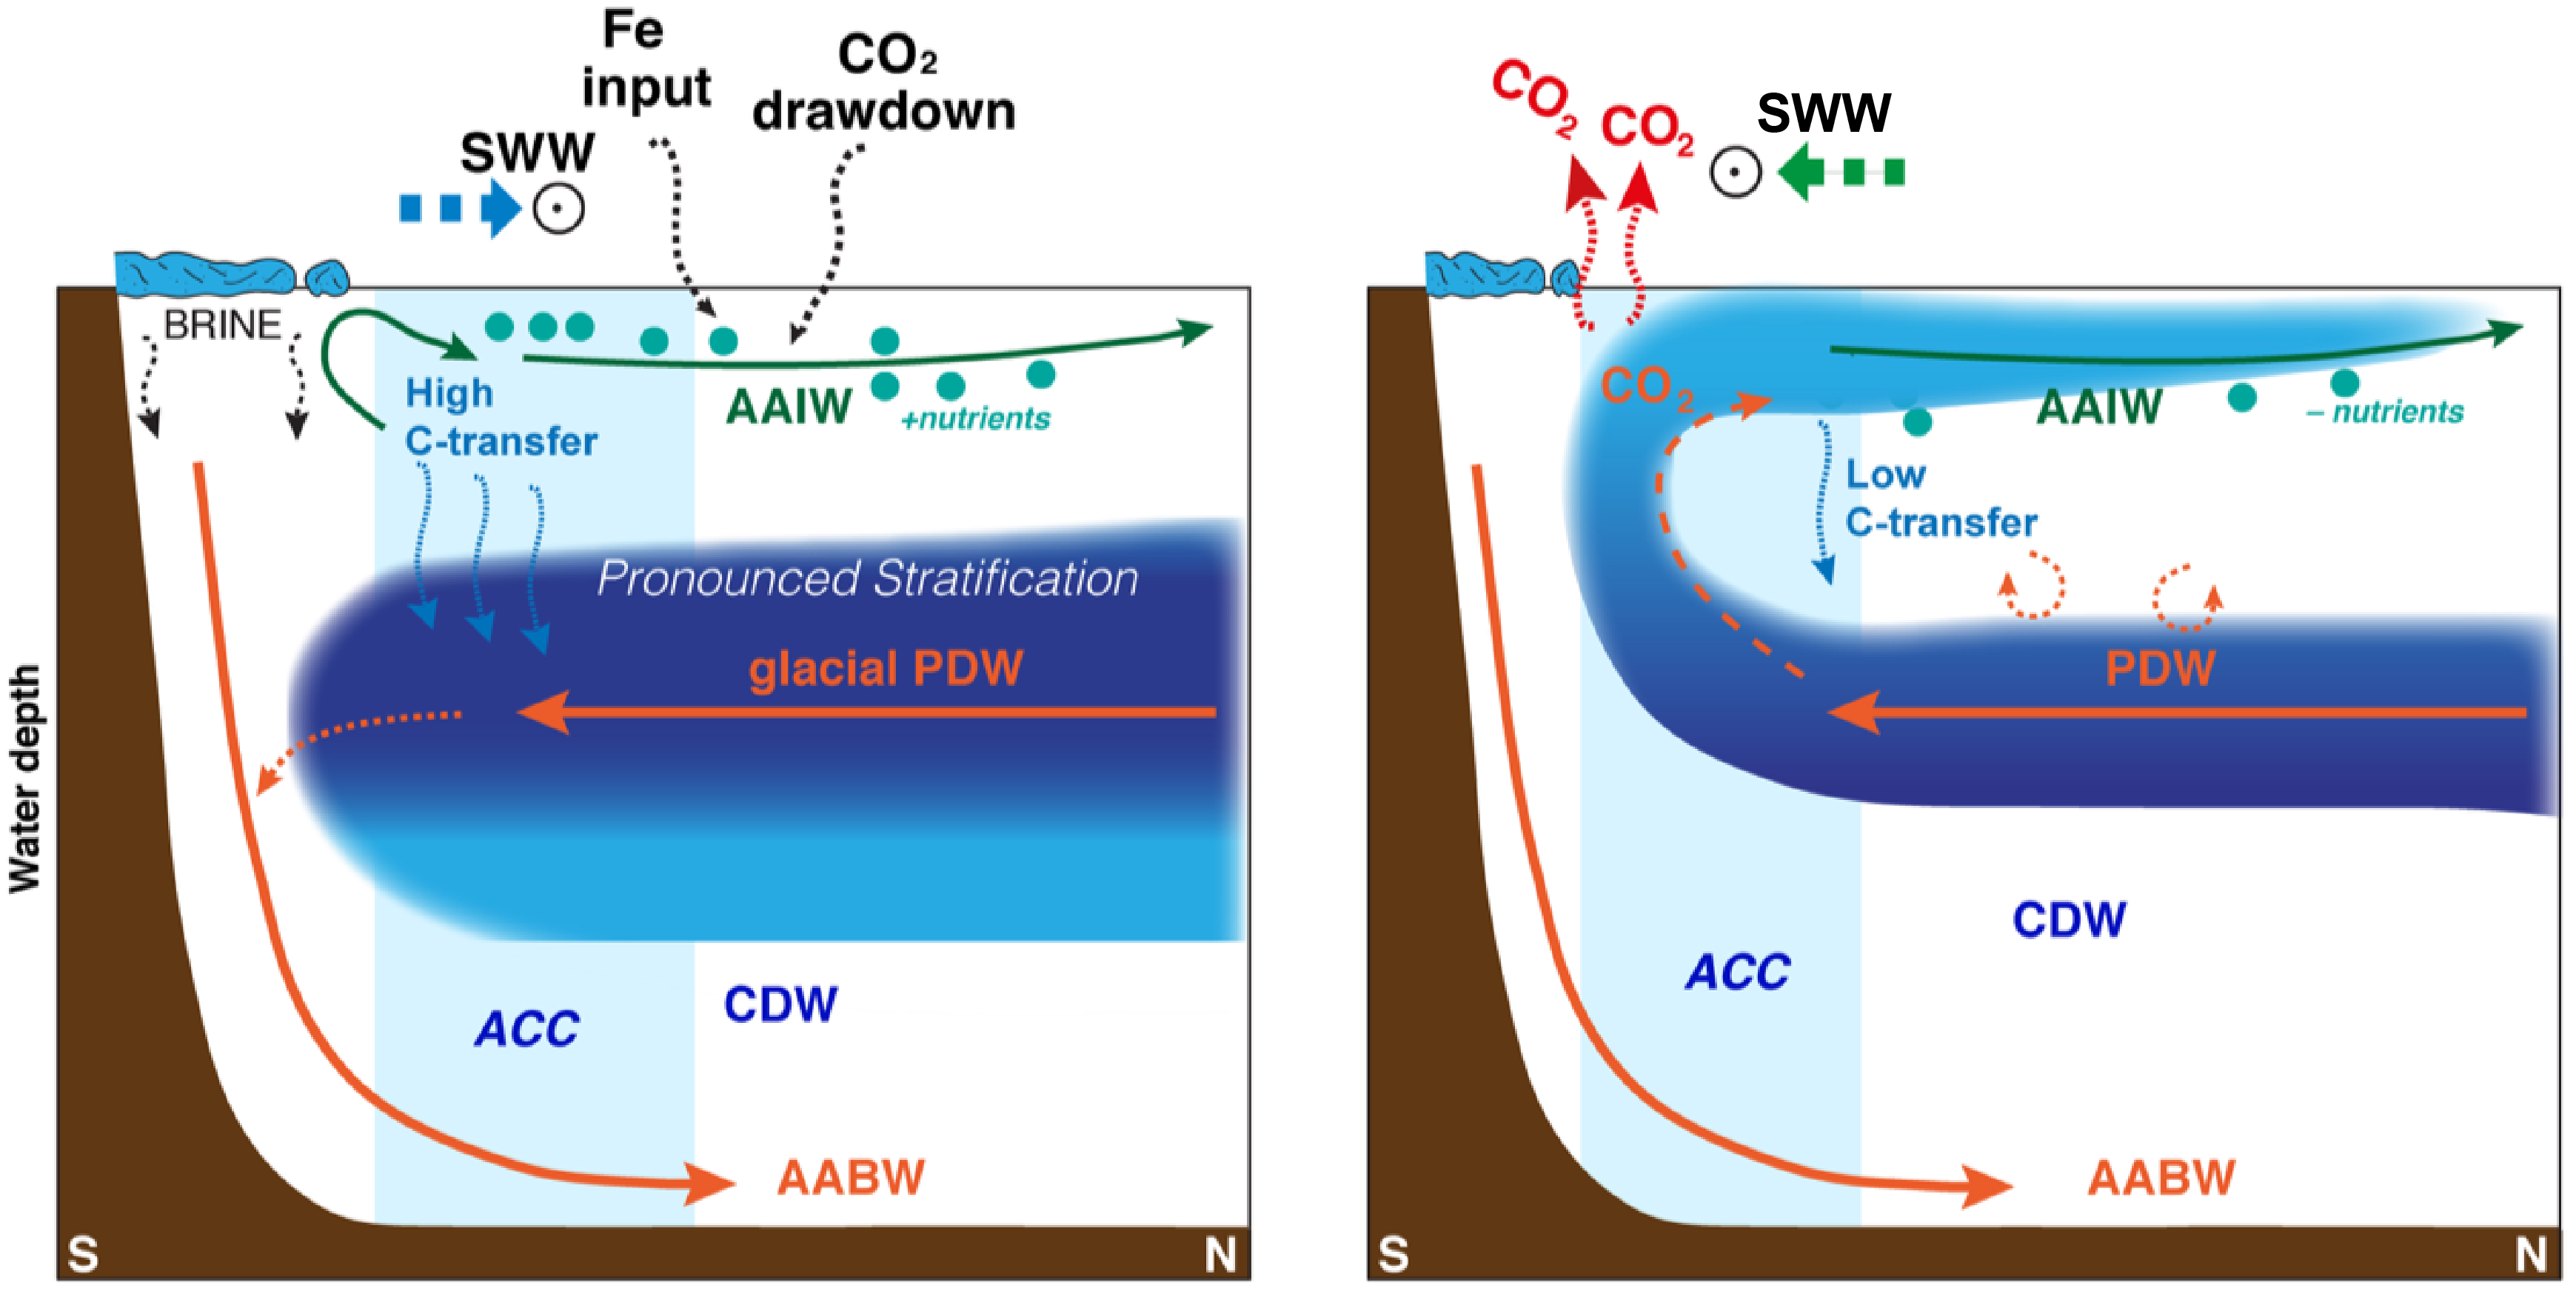
Figure F9. ACC overturning circulation.
In the modern Southern Ocean, deep waters with high dissolved inorganic carbon and major nutrient concentrations are carried to the surface by wind-driven upwelling and density-driven overturning. However, because phytoplankton growth is limited by the scarcity of iron, a substantial fraction of these nutrients return to the subsurface before they are completely consumed. This incomplete utilization of nutrients represents a substantial leak in the modern global biological pump because it allows the escape of deeply sequestered carbon back to the atmosphere, keeping atmospheric CO2 levels high during interglacial stages. An increase in the efficiency of the global biological pump can be accomplished either by decreasing the physical cycling of deep water through the surface of the Southern Ocean or by increasing the degree to which surface nutrients are consumed by marine organisms (e.g., as a result of increasing iron availability relative to other nutrients) (Sigman and Boyle, 2000; Sigman et al., 2010).
Paleoceanographic records (mainly from the Atlantic sector of the Southern Ocean) indicate that ice age productivity was lower (Anderson et al., 2009; Kohfeld et al., 2005; Jaccard et al., 2013) in the Antarctic zone (i.e., south of the APF) and nutrient consumption was higher (Robinson and Sigman, 2008; Studer et al., 2015). These data indicate that the Antarctic zone was more strongly stratified during ice ages, inhibiting the physical mixing of deep carbon-rich deep water to the surface and therefore contributing to the lowering of atmospheric CO2 during glacial times.
In the Subantarctic Atlantic, higher dust flux, increased productivity and nutrient consumption, and lower atmospheric CO2 co-occur during peak glacial times and Antarctic millennial cold events, which has been associated with iron fertilization (e.g., Frank et al., 2000; Kumar et al., 1995; Martínez-García et al., 2009, 2011, 2014). Martínez-García et al. (2009, 2014) suggested that around 40–50 ppmv of the glacial atmospheric CO2 decline can be attributed to iron fertilization (Figure F10), which is in good agreement with some model estimates (Hain et al., 2010; Chalk et al., 2017; Brovkin et al., 2007). At ODP Site 1090, the first significant rise in ice age dust and iron deposition over the past 4 My occurred at ~2.7 Ma and the most pronounced rise in dust deposition occurred across the mid-Pleistocene transition (Martínez-García et al., 2011).

Figure F10. Paleoproductivity patterns.
For the past 1 My, higher dust deposition during glacial periods compared to interglacials has also been documented for the Pacific Southern Ocean, suggesting an eastward extension of the influence of Australian and/or New Zealand dust sources (Lamy et al., 2014). In this area, dust fluxes follow the same glacial–interglacial fluctuations, but absolute glacial fluxes in the Subantarctic Pacific are about half of those in the Atlantic Southern Ocean (Figure F11). As in the Atlantic sector, export production in the Subantarctic Zone of the Pacific sector over the past ~450 ky is higher during glacial times, but in contrast to the Subantarctic Atlantic (Martínez-García et al., 2014), the relationship between productivity and nutrient consumption has not yet been evaluated in detail. Preliminary data suggest that nutrient consumption increased in response to iron fertilization (A. Martínez-García, unpubl. data).
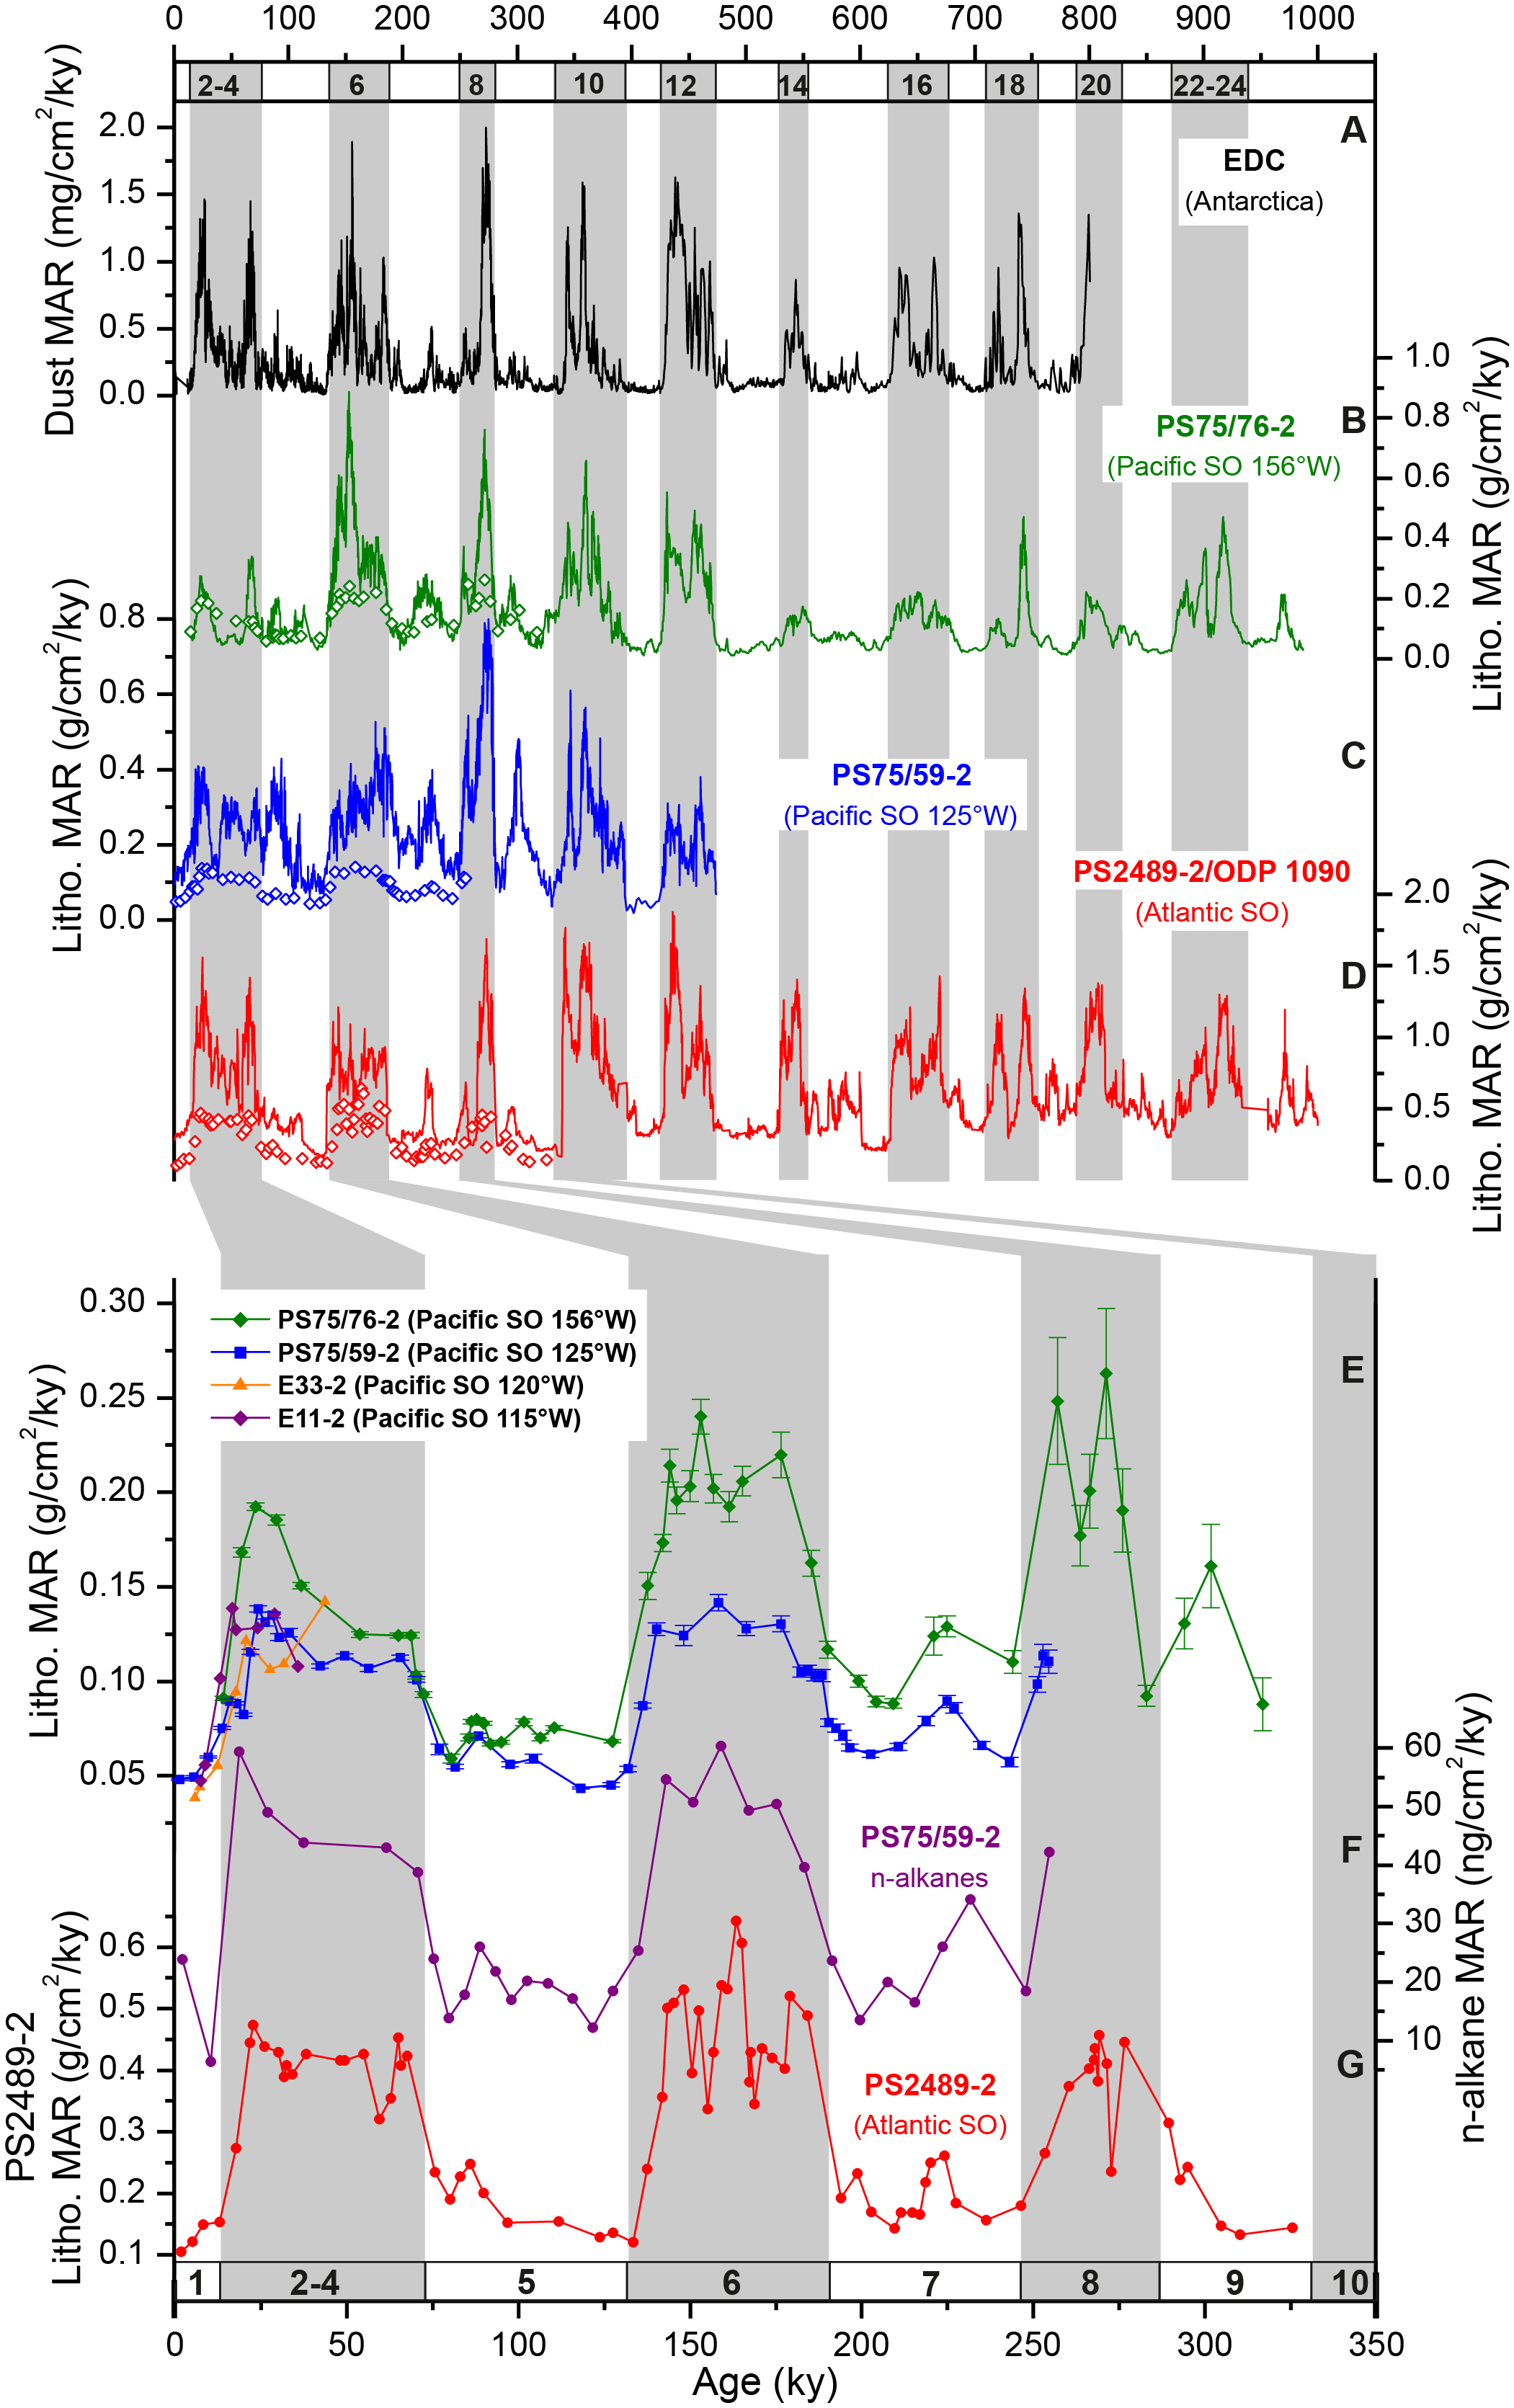
Figure F11. Lithogenic mass accumulation rates.
Expedition 383 drill cores from the Pacific sector of the Southern Ocean will allow exploration of the glacial–interglacial changes in biological productivity both north and south of the APF in more detail. Published studies, including those from ODP Leg 177, show that during glacial periods of the late Quaternary in the Atlantic sector of the Southern Ocean, biological productivity increased in the Subantarctic Zone and decreased in the Antarctic Zone south of the APF (Diekmann, 2007; Jaccard et al., 2013). The glacial productivity decrease south of the APF is under debate and may have been caused either by stratification of the water column (Sigman et al., 2004; Jaccard et al., 2005) or expansion of Antarctic sea ice coverage (Hillenbrand and Cortese, 2006).
Our drill sites in the CSP (U1539–U1541) will provide robust data to test to what extent processes that are active in the Atlantic sector can be translated to the Pacific sector, thus allowing the construction of a more global picture of the Southern Ocean’s role in nutrient distribution and biogenic export production and their impact on CO2 variations. It is necessary to solve these issues in the Pacific before the impact on the ocean carbon cycle under different climate boundary conditions can be modeled more realistically.
Moreover, the ESP site (U1543) and Chilean margin sites (U1542 and U1544) will provide a long-term record of variability of the Patagonian Ice Sheet (PIS). Both terrestrial records from Patagonia and records of ice-rafted debris (IRD) in marine sediment cores from the Chilean margin (Core MD07-3128 at Proposed Site CHI-4A) indicate substantial millennial-scale variability of the PIS paralleling dust input changes recorded in Antarctic ice cores. This covariance implies a causal link between ice sheet advances and dust availability (Caniupán et al., 2011; Sugden et al., 2009). Thus, the Chilean margin sites will provide important baseline information for dust variability in the Atlantic sector of the ACC.
Our two hypotheses contain a large number of challenging research targets critical for paleoceanography and paleoclimatology on a global scale. CSP Sites U1539–U1541 represent the first drill cores in the Subantarctic Pacific sector of the Southern Ocean. The deep Pacific ESP site (U1543) is located in a particularly sensitive ocean area where glacial–interglacial changes are strongly amplified. Finally, the Chilean margin sites provide information on changes at shallower water depths together with changes in PIS extent and potential links to dust input to the Atlantic sector of the Southern Ocean.
Site summaries
Site U1539
Background and objectives
Site U1539 (Proposed Site CSP-2B) is located in the CSP at 56°09.0655′S, 115°08.038′W, ~1600 nmi west of the Strait of Magellan at 4070 m water depth (Figure F12). The site sits at the eastern flank of the southernmost EPR, ~220 nmi from the modern seafloor spreading axis, and is underlain by oceanic crust formed between ~10 and 12 Ma (Eagles, 2006). Assuming a constant seafloor half-spreading rate of ~4.5 cm (Pitman and Heirtzler, 1966), the plate tectonic backtrack path of Site U1539 moves the site westward. The extrapolated backward trajectory translates to an early Pliocene position ~100 nmi closer to the crest of the EPR at a water depth shallower by several hundred meters. At a smaller scale, the site is located in a northeast–southwest oriented, ~5 nmi wide trough that parallels the orientation of the EPR. The adjacent ridges rise to ~3000 m water depth northwest of the site and to ~3500 m water depth to the southeast (Figure F12).

Figure F12. Oceanographic and bathymetric setting, Site U1539.
Site U1539 is located on MCS Line AWI-201000013 (Figure F13A) close to the intersection with Line AWI-2010000011 (Gersonde, 2011). The seismic cross-lines indicate ~650 m thick sediments above oceanic basement. Sediments are mostly well stratified with flat-lying reflectors. Low to moderately reflecting layers become stronger deeper than ~100–120 m sediment depth. Sediment echo sound (Parasound) profiles (Gersonde, 2011) reveal excellent penetration (>150 m) with distinct layering (Figure F13B), suggesting a succession of fine-grained soft sediments with varying lithologic composition.

Figure F13. MCS and Parasound profiles, Site U1539.
Site U1539 lies in the pathway of the Subantarctic ACC, ~100 nmi north of the modern average SAF, in a zonal transition zone of the ACC. West of the site, the ACC and associated fronts are strongly steered by the topography of seafloor spreading systems (Udintsev and Eltanin-Tharp Fracture Zone systems), whereas to the east the vast Amundsen Sea basin does not influence the ACC strongly.
SSTs seasonally vary between ~2°C (July–September) and ~6.5°C (January–March). The area is located west of the main AAIW and Mode Water formation regions in the ESP. The 4070 m water depth places Site U1539 within LCDW, close to the boundary with AABW (Figure F14). This hydrographic setting makes it ideal to evaluate past changes in frontal position, associated export production, ACC current speed and position, and aeolian dust and IRD input during the Pleistocene.
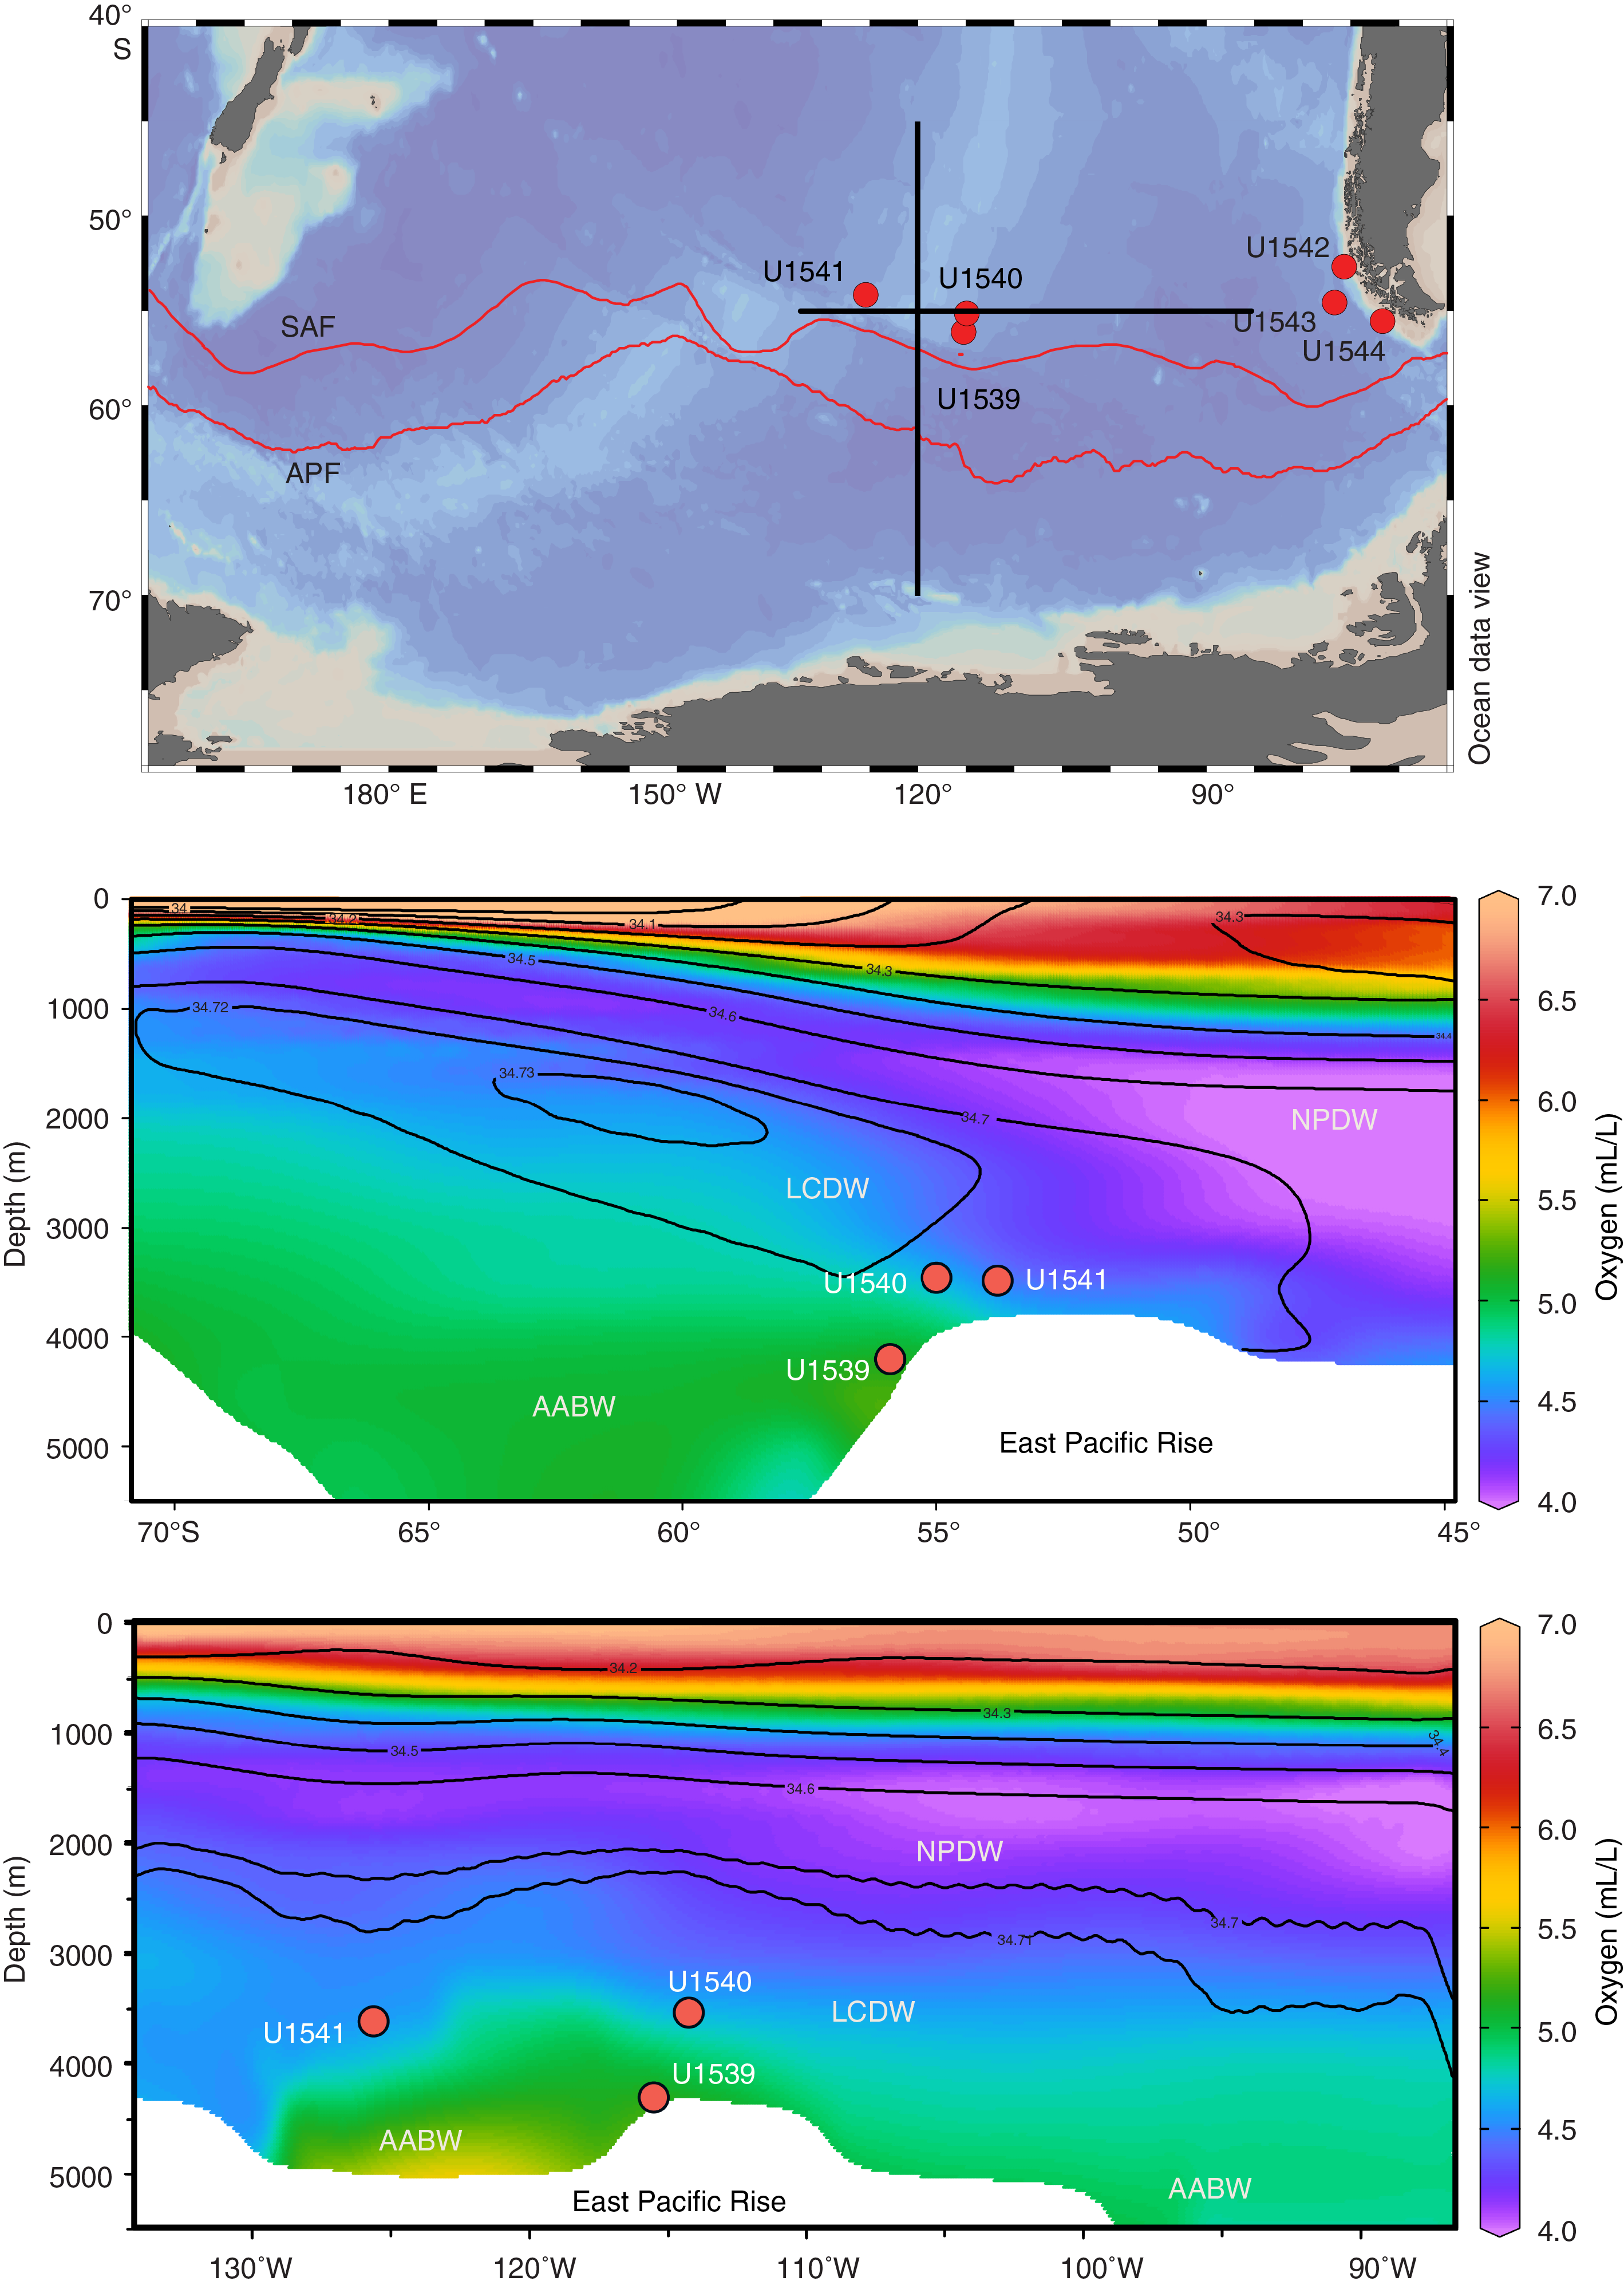
Figure F14. Modern salinity and oxygen distribution.
The main objectives at Site U1539 were to
- Recover a moderate- to high-resolution Subantarctic Pliocene–Quaternary sediment record close to the SAF;
- Characterize the stratigraphy of siliceous and calcareous oozes, allowing for a wide range of paleoceanographic reconstructions;
- Reconstruct high-amplitude Subantarctic SSTs and sea ice variations;
- Provide a record of lowermost CDW and glacial AABW;
- Reconstruct productivity (opal versus carbonate), nutrient distribution, and dust-productivity coupling; and
- Recover a potential far-field record of WAIS variability.
Operations
The first core of Expedition 383 was taken from Hole U1539A at 0445 h on 1 June 2019 from 4071.1 meters below sea level (mbsl). We used the advanced piston corer (APC) system to penetrate from the seafloor to 107.6 m core depth below seafloor, Method A (CSF-A) (Cores 1H–12H) and recover 104.75 m of core (97%). The hole was terminated after Core 12H because of rough weather and sea conditions. Shattered liners were recorded on Cores 5H and 11H. Shear pins were sheared prematurely on Cores 1H, 11H, and 12H.
After 27 h of waiting on weather, Hole U1539B was spudded at 0540 h on 3 June. Cores 1H–3H recovered 21.9 m (78% recovery), but Cores 2H and 3H were misfires, so we decided to terminate the hole and wait for seas to further improve before continuing operations.
By 1245 h, heave had fallen to 3.0 m and we resumed coring. Hole U1539C was started with Core 1H returning a full 9.7 m core barrel. This allowed us to determine a seafloor depth of 4070.2 mbsl. Full-length APC coring continued to refusal at 240.1 m CSF-A (Core 26H). Half-length APC (HLAPC) coring was then used to deepen the hole, and coring terminated after Core 32F at 268.1 m CSF-A. A total of 32 cores were taken in this hole using the APC and HLAPC systems. Formation temperature measurements were taken with Cores 4H, 13H, and 16H. Partial strokes were recorded on Cores 24H–27F with high overpull on Cores 17H–26H. A misfire was recorded on Core 31F.
Hole U1539D was spot cored to fill in coring gaps from the previous holes. The hole was spudded at 1405 h on 5 June, drilled ahead without recovery to 47.5 m CSF-A, where coring began, and continued to 198 m CSF-A with seven drilled intervals totaling 68.7 m. A total of 14 APC cores were taken over the 129.3 m cored interval with a recovery of 128.15 m (99%). The hole reached maximum depth at 1500 h on 6 June, and the drill string was recovered, ending the hole and Site U1539. Misfires were recorded on Cores 2H, 3H, 6H, 8H, and 9H and a partial stroke was recorded on Core 18H. No temperature or orientation measurements were taken in this hole. After recovering the drill string, the rig floor was secured for transit at 0130 h. The thrusters were raised, and the sea voyage to Site U1540 began at 0224 h on 7 June.
Principal results
At Site U1539, a 268.1 m thick continuous sequence of Holocene to early Pleistocene sediments was recovered with a bottom-hole age of ~1.3 Ma and a mean sedimentation rate of ~20.6 cm/ky. Hole U1539C recovered the deepest cored sediments at 268.1 m CSF-A. The recovered 247.50 m of core spans one lithologic unit with two subunits consisting of interbedded calcareous and siliceous biogenic ooze (Figure F15). Site U1539 sediments can broadly be divided into two categories: (1) diatom ooze with varying amounts of calcareous and biosiliceous components and (2) biogenic carbonate ooze with varying amounts of biosiliceous and other calcareous components. Siliceous microfossils show relatively good preservation and are abundant throughout the record. Preservation of calcareous microfossils varies from moderate to good.
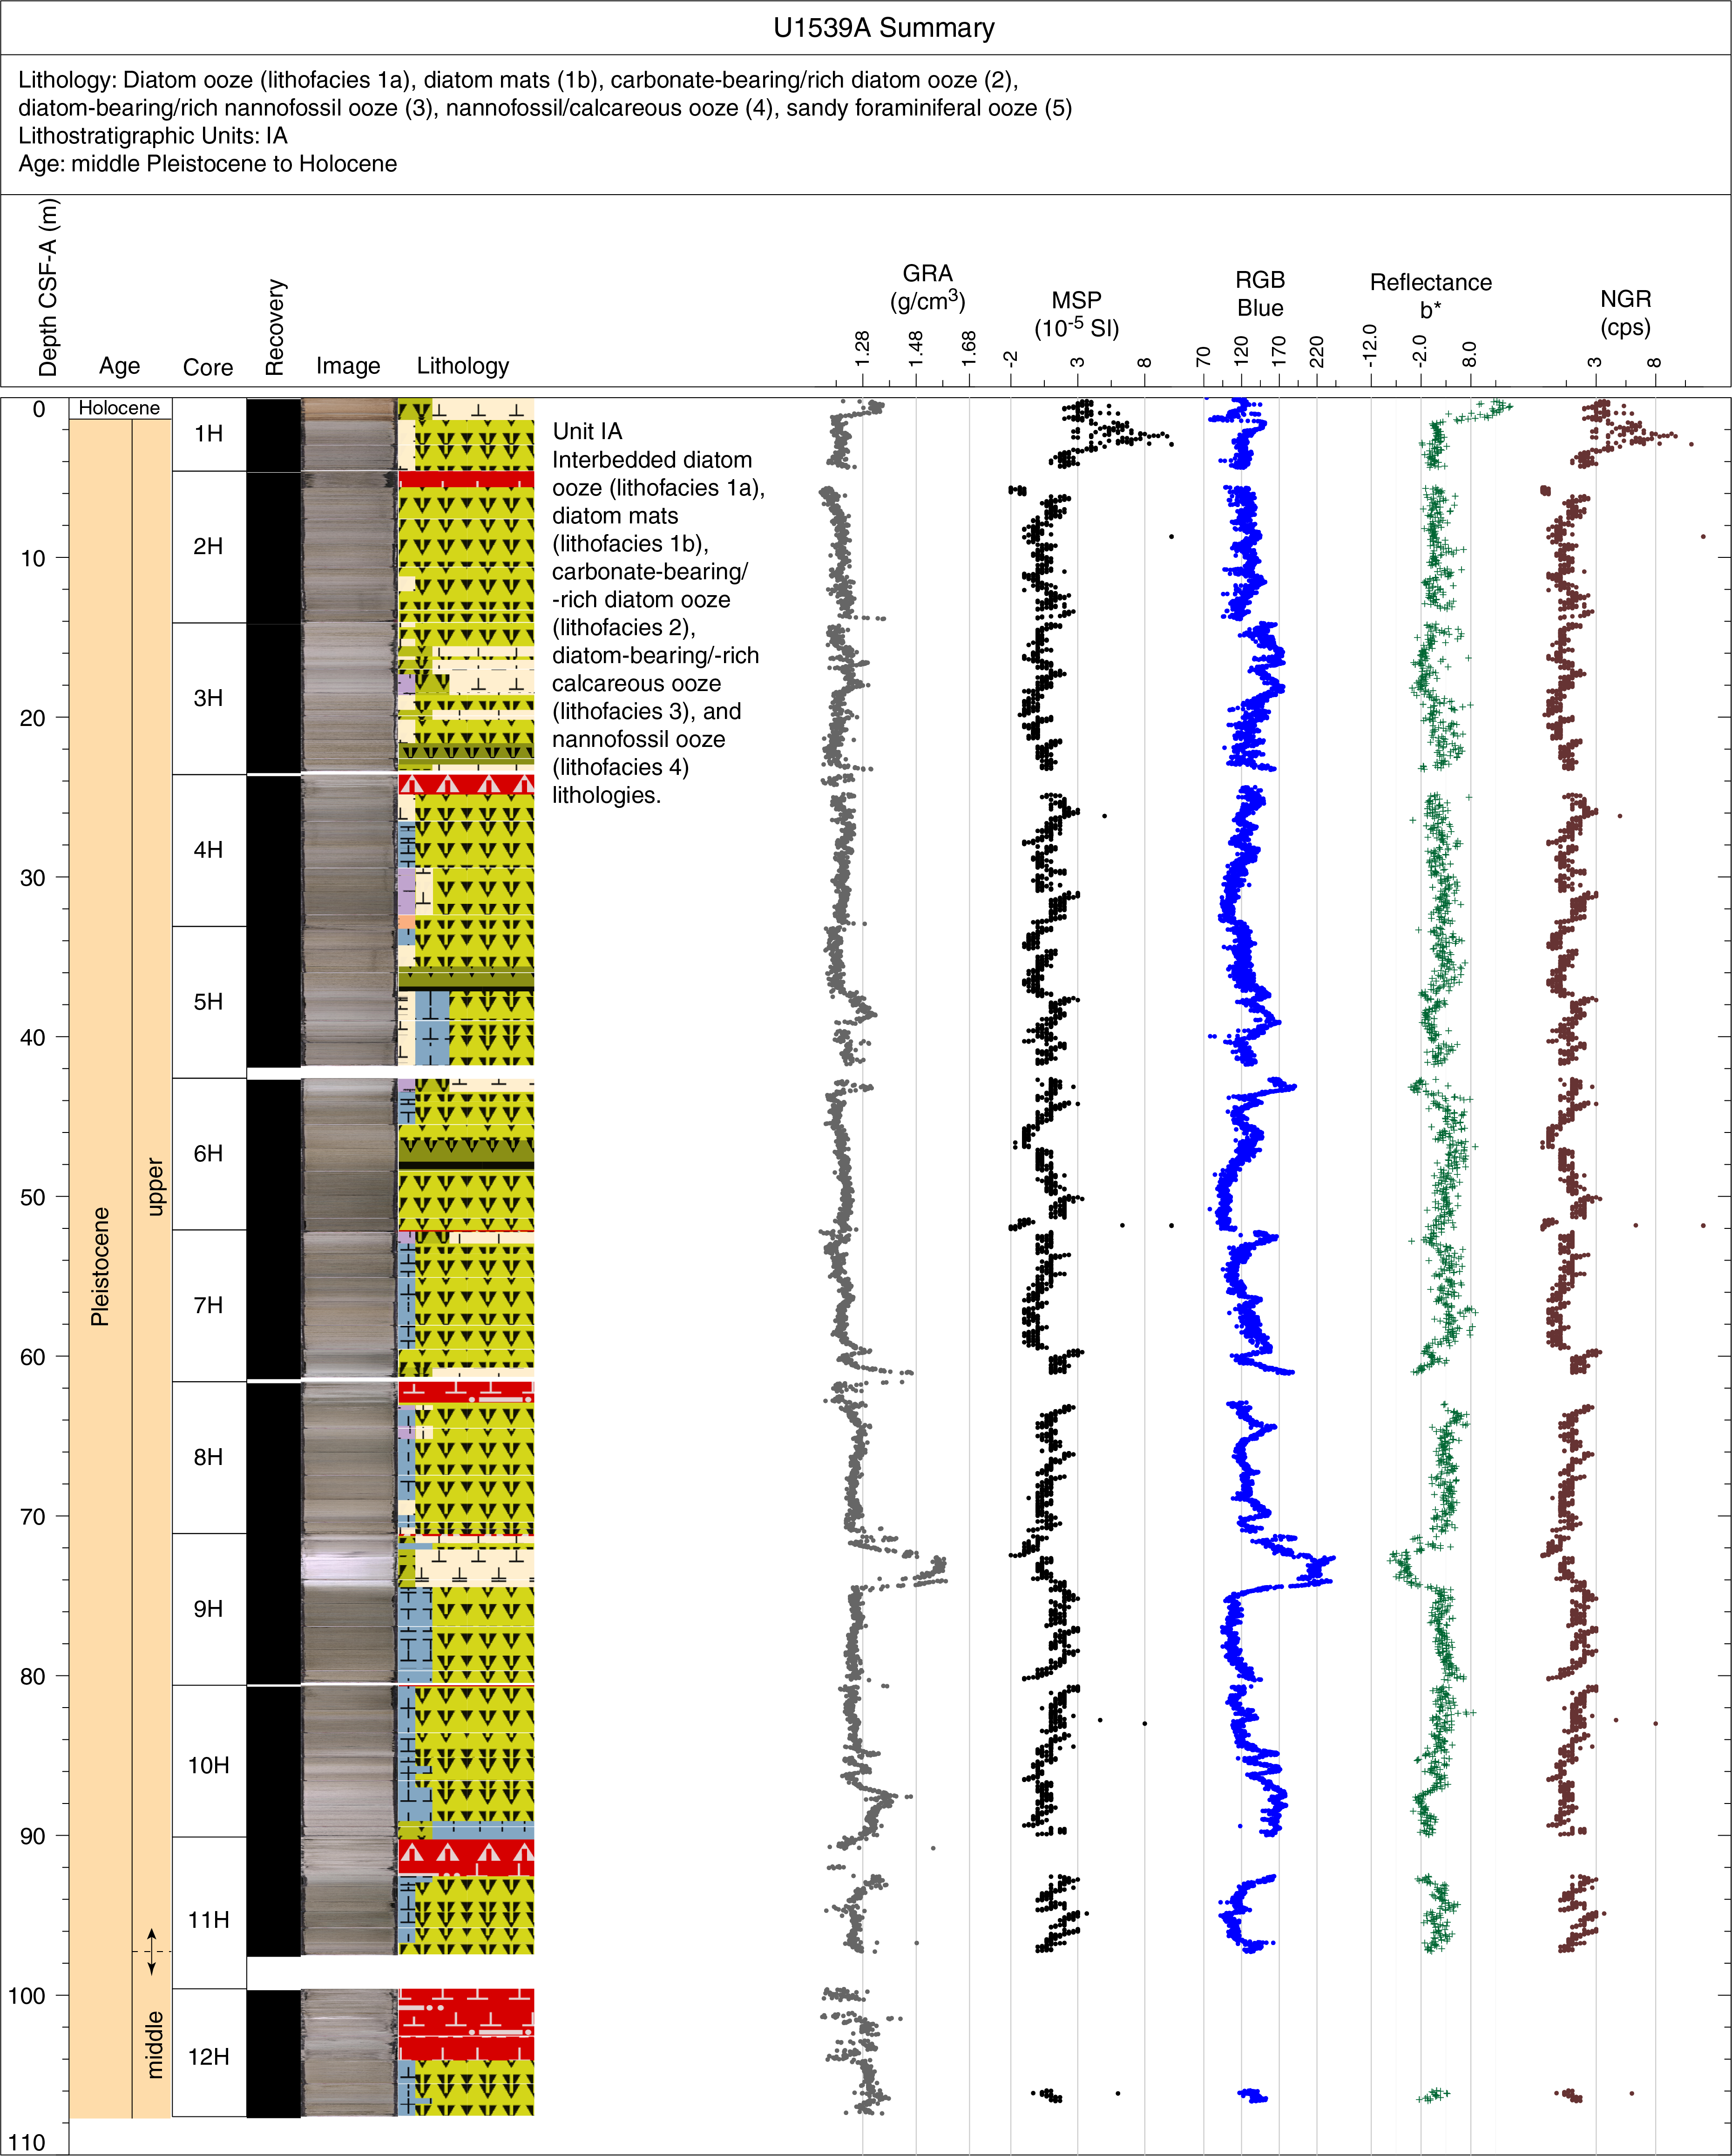
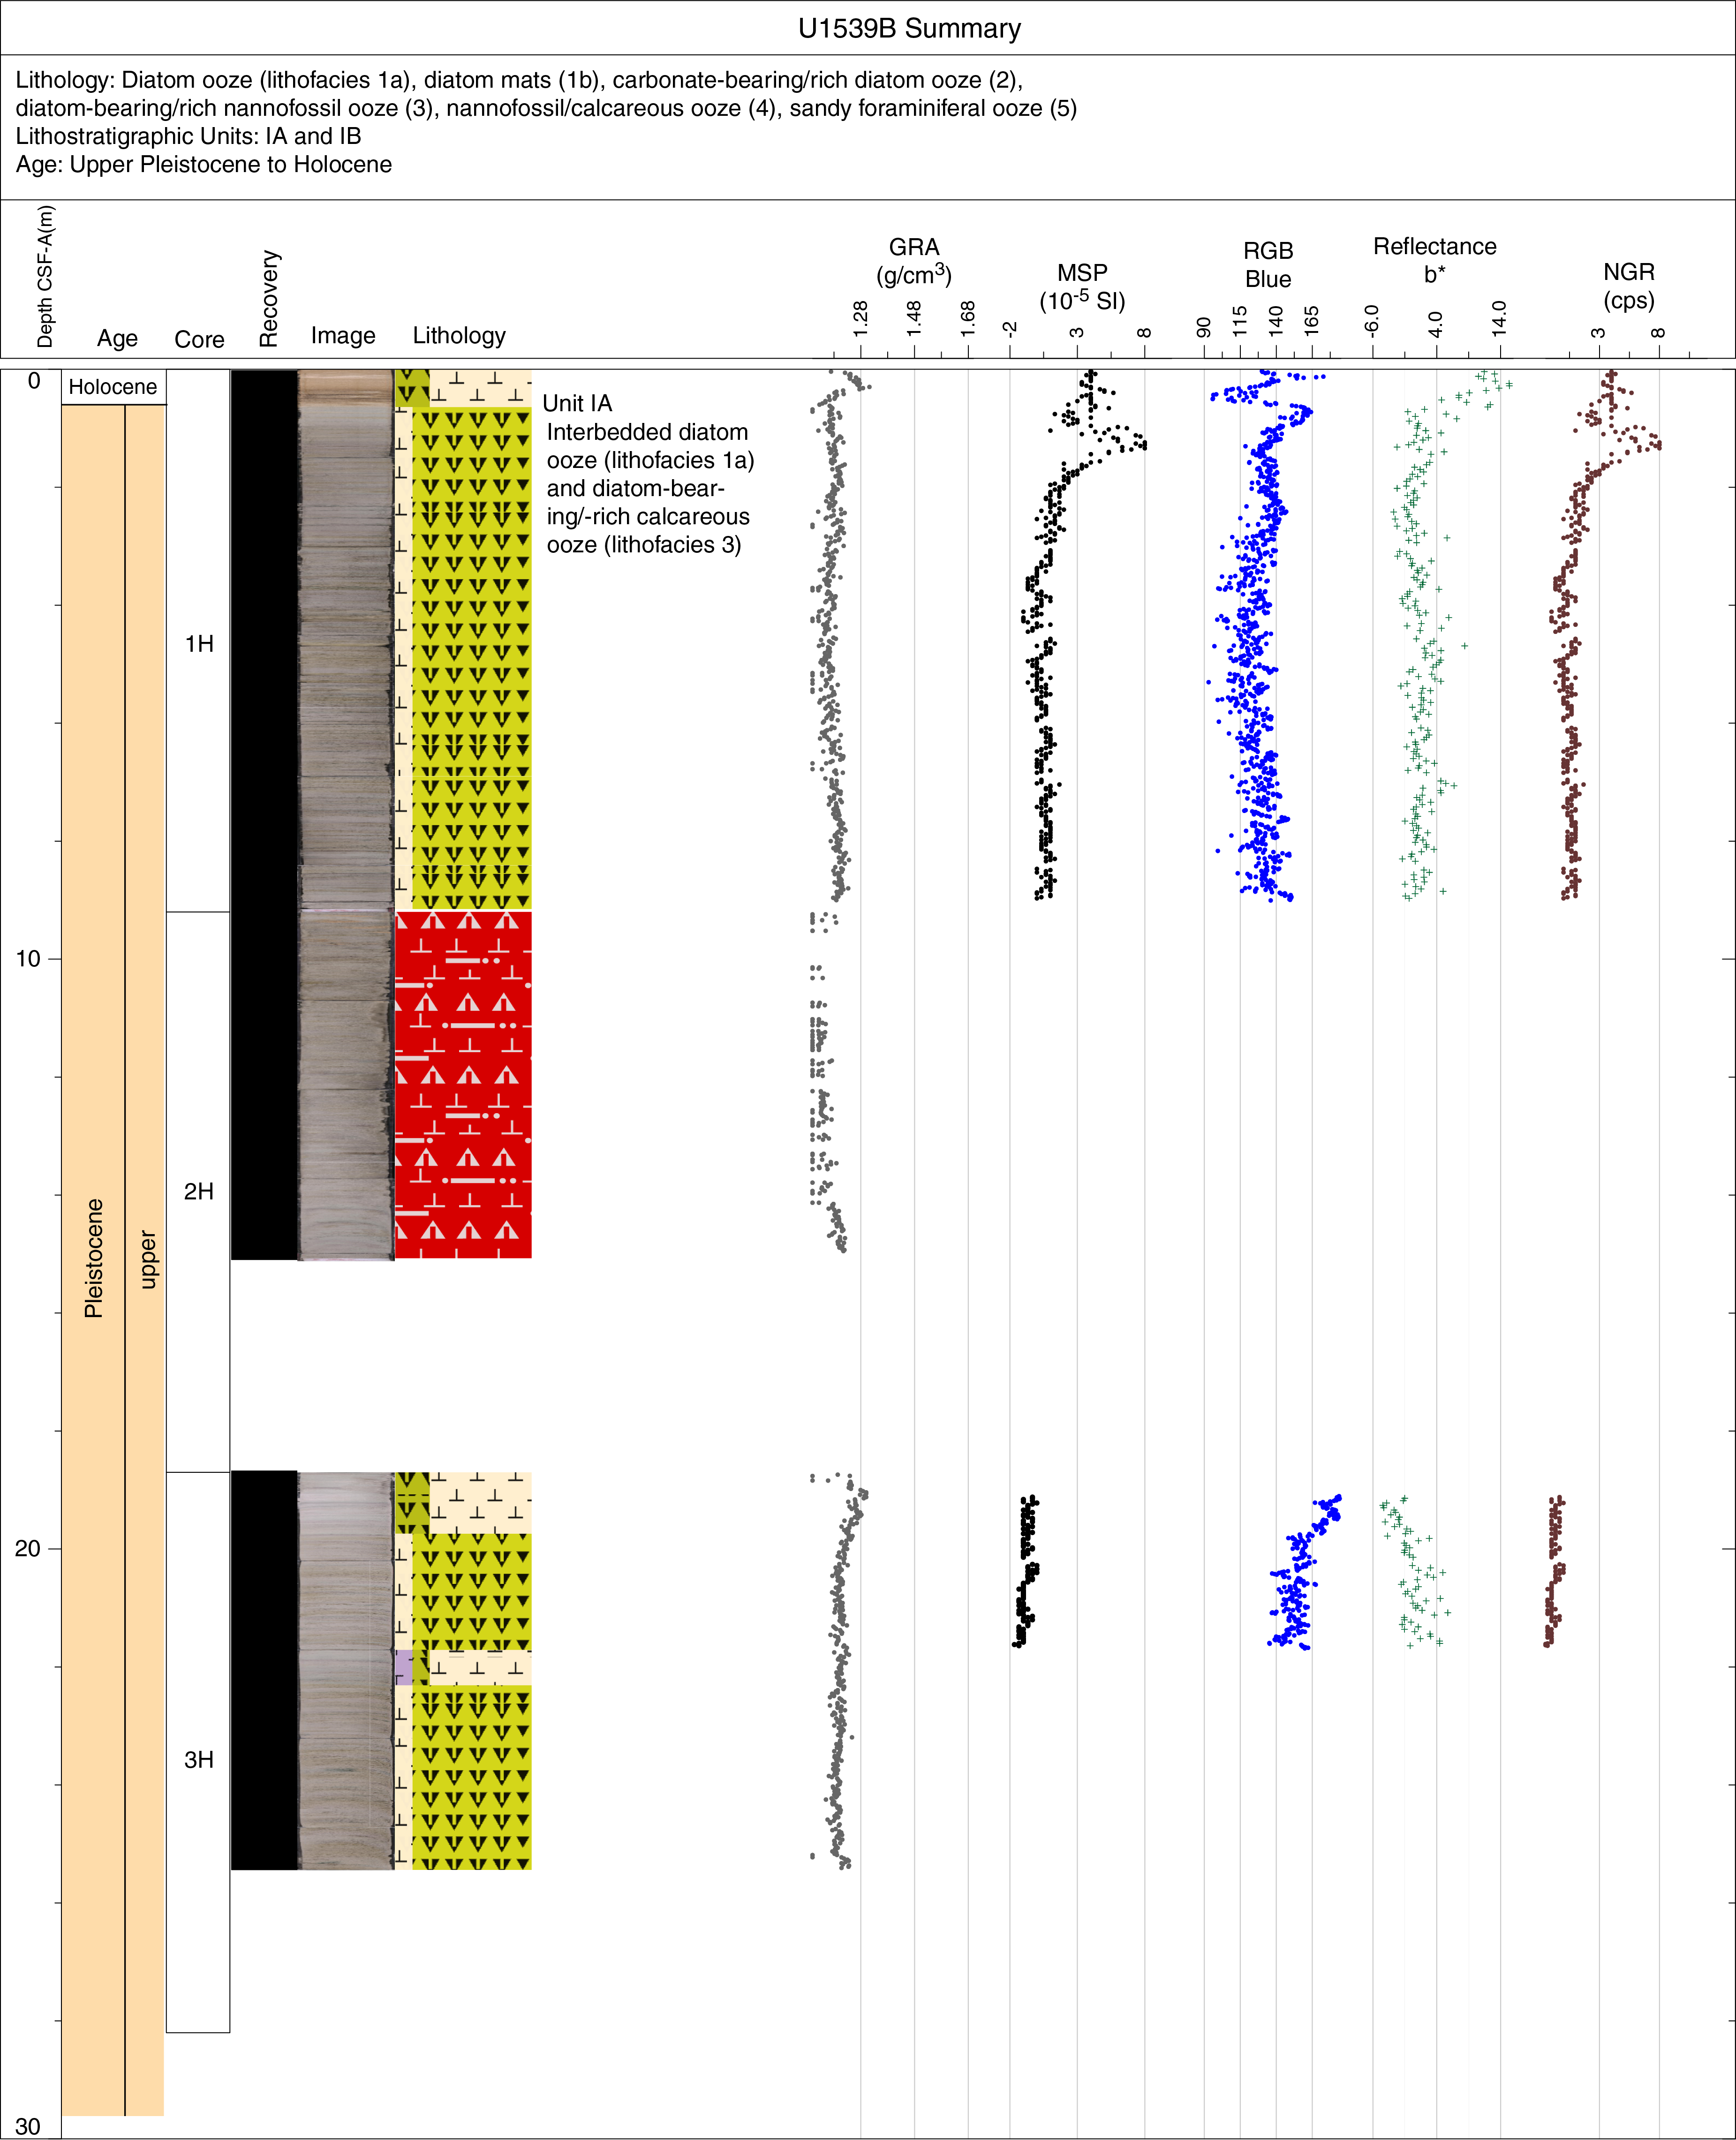

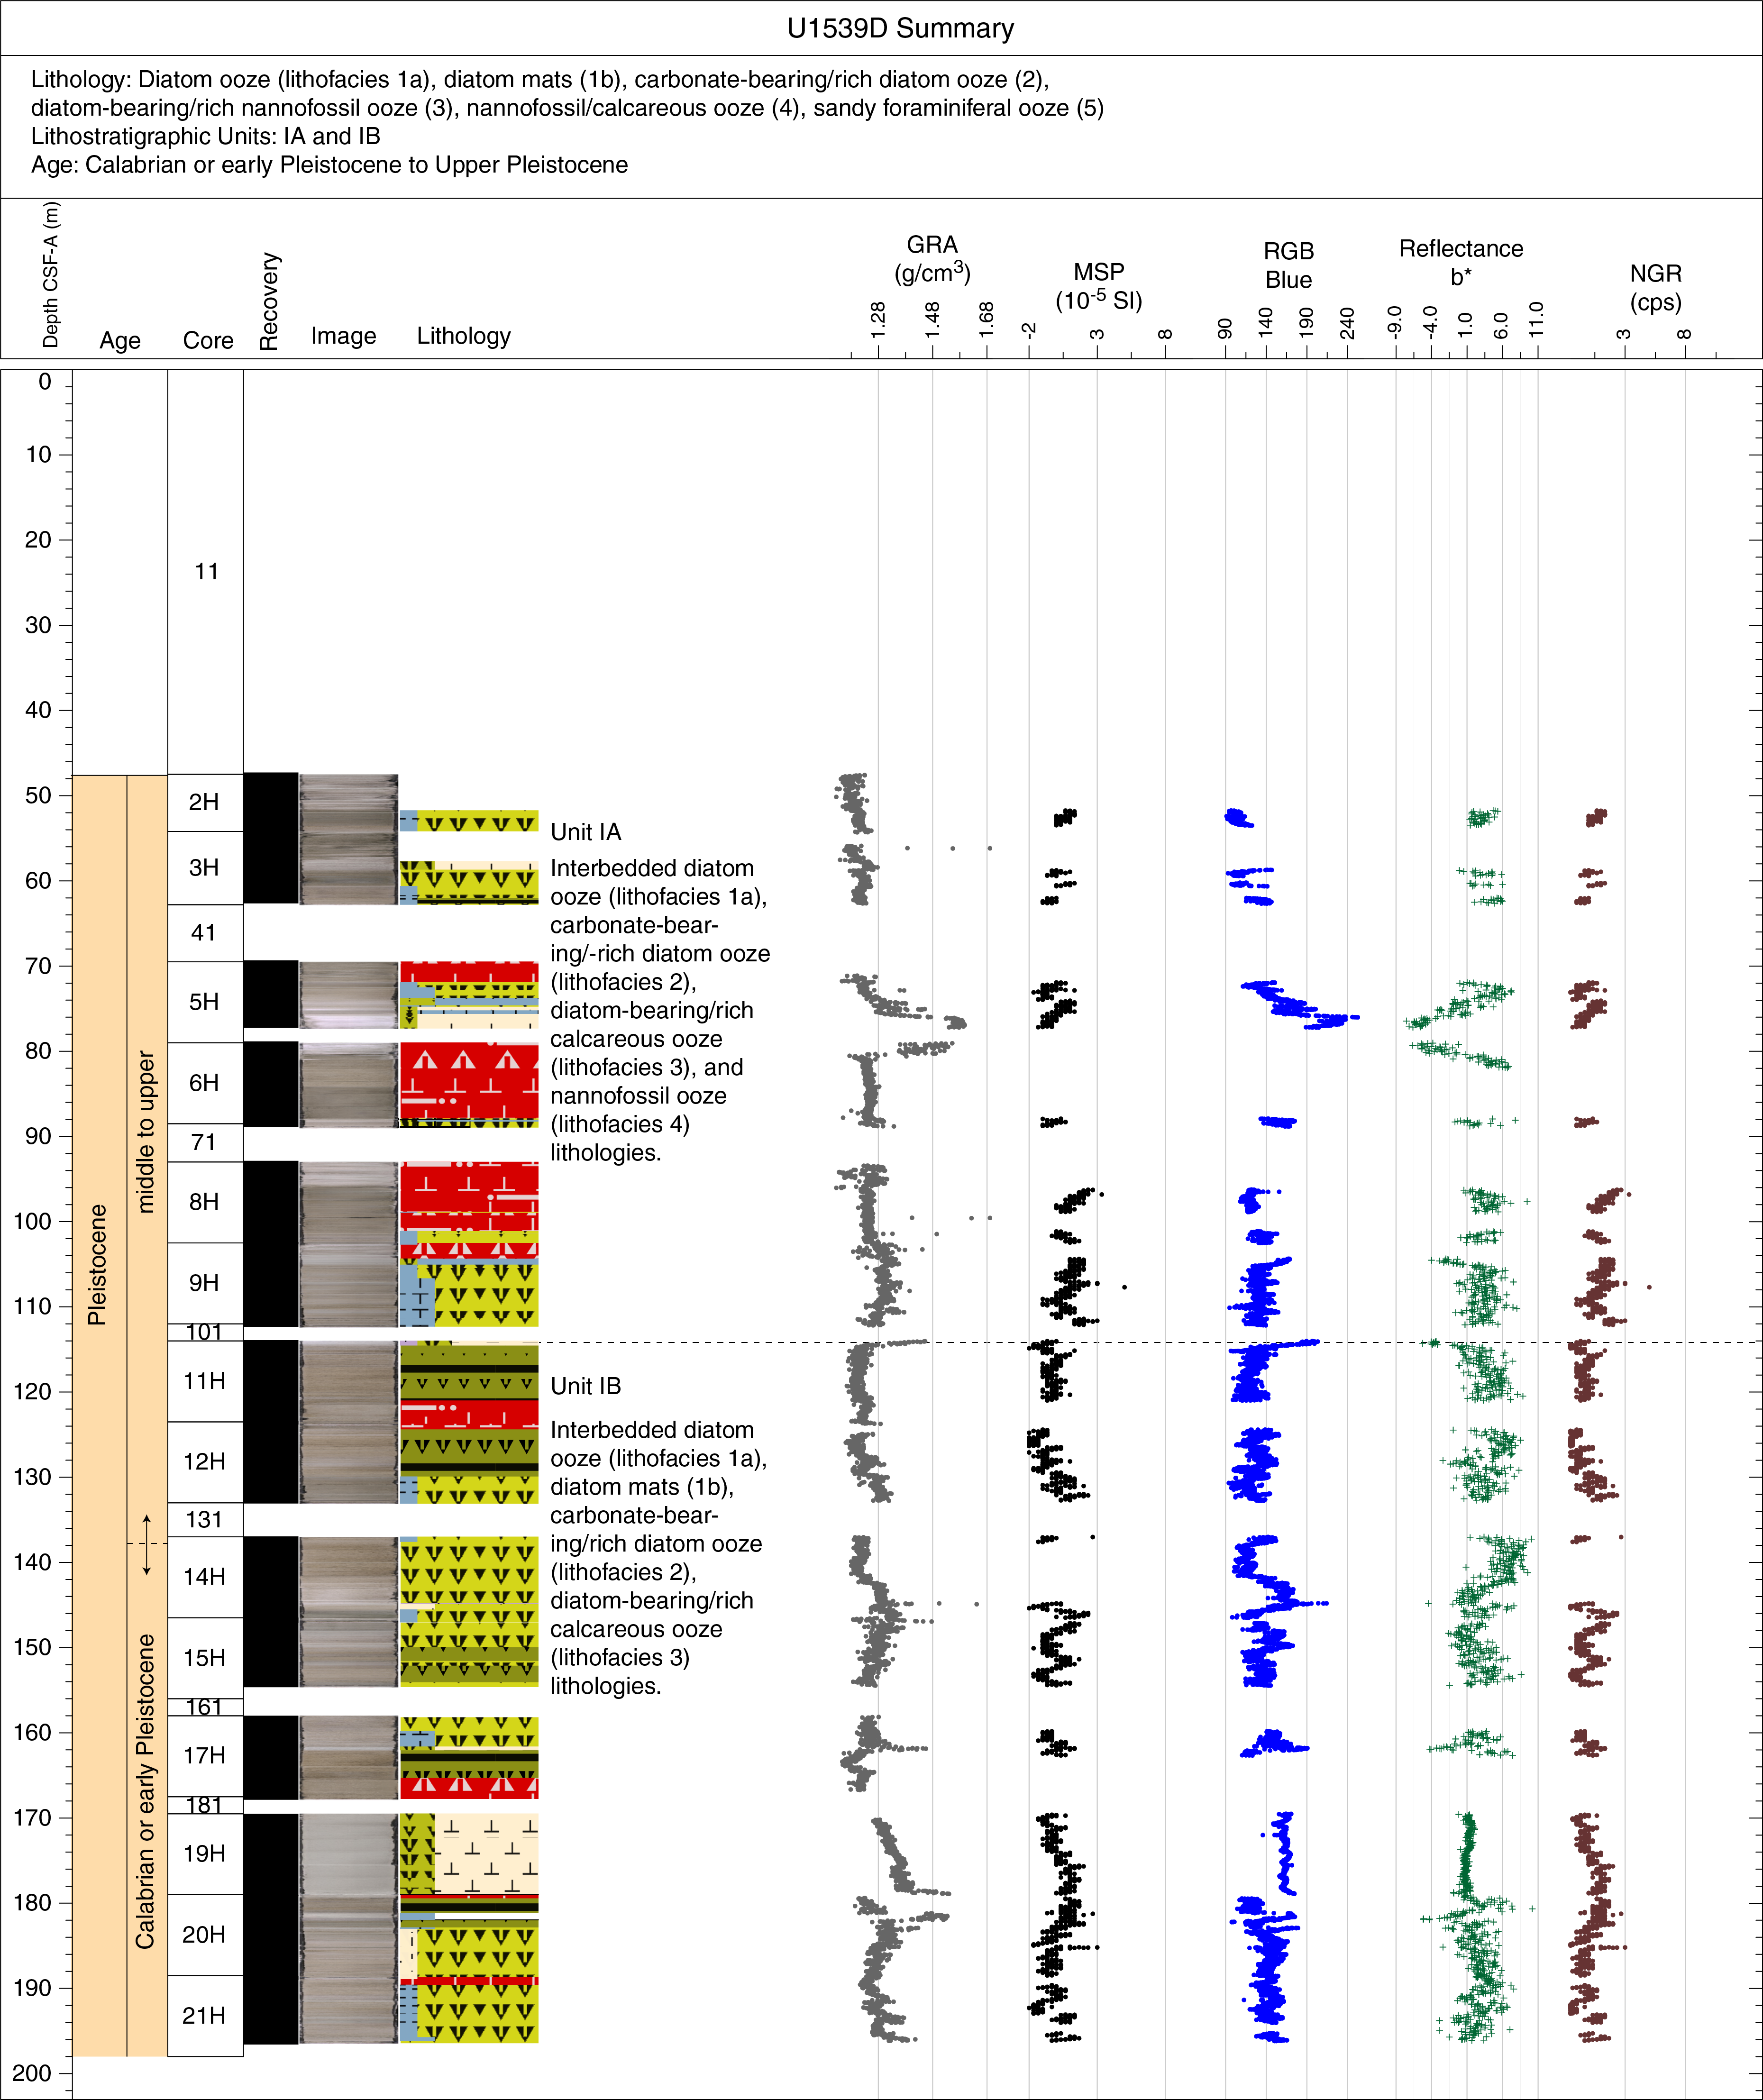
Figure F15. Hole summaries, Site U1539.
Five primary lithofacies were identified, and they mostly differ in their proportions of calcareous and biosiliceous components (Table T2). Secondary defining attributes include degree of diagenetic alteration, bioturbation, and in the case of Lithofacies 5, microfossil size and sedimentary structure. Lithofacies 1a is composed of distinct centimeter-scale diatom mats in a biogenic ooze matrix. This facies can be distinguished from Lithofacies 1b, which is characterized by sequences of more pronounced and stacked diatom mats with a near absence of diatom ooze matrix. Lithofacies 2 is the dominant lithofacies at Site U1539. It consists of light greenish gray to gray carbonate-bearing or carbonate-rich diatomaceous ooze that exhibits moderate to heavy bioturbation. Lithofacies 3 consists of white to light gray diatom-bearing to diatom-rich nannofossil or calcareous oozes that occur as thin beds generally <3 m thick with moderate to heavy bioturbation. Lithofacies 4 is nearly pure nannofossil ooze. Lithofacies 5 consists of foraminiferal oozes and sands that occur sporadically as centimeter- to decimeter-scale layers characterized by a sharp basal contact and distinct cross-bedding observable in X-ray images.
We divided the Site U1539 stratigraphic sequence into Subunits IA and IB based on the relative abundance of the five defined lithofacies. With the exception of Lithofacies 5 in Subunit IB, all lithofacies are present in both subunits, but the thickness, frequency, and overall occurrence differs between the two. Subunit IA is characterized by the frequent occurrence of ~1.5 m thick beds of calcareous and nannofossil ooze (Lithofacies 3) and limited occurrence of diatom mats (Lithofacies 1b). In contrast, Subunit IB has only a few occurrences of Lithofacies 4 and is largely dominated by beds of thick and continuous diatom mats (Figure F16). One massive homogenous ~10.7 m thick bed of diatom-rich nannofossil ooze that exhibits an erosional basal contact overlain by foraminifer sands (Lithofacies 5) interrupts the normal depositional sequence of Subunit IB and most likely represents a single rapidly deposited bed. Carbonate-bearing and carbonate-rich diatomaceous ooze (Lithofacies 2) is the dominant lithofacies in both subunits and does not provide a useful means to divide the stratigraphy because of its widespread occurrence. The prominent white to light gray calcareous beds associated with Lithofacies 4 drive the high-amplitude variations in color reflectance and spectrophotometry values (red-green-blue color space [RGB] blue and L*). In general, we observed high-amplitude, low-frequency variations above the subunit boundary at 125 m core composite depth below seafloor, Method A (CCSF-A), and more frequent low-amplitude variations below it (Figure F16).
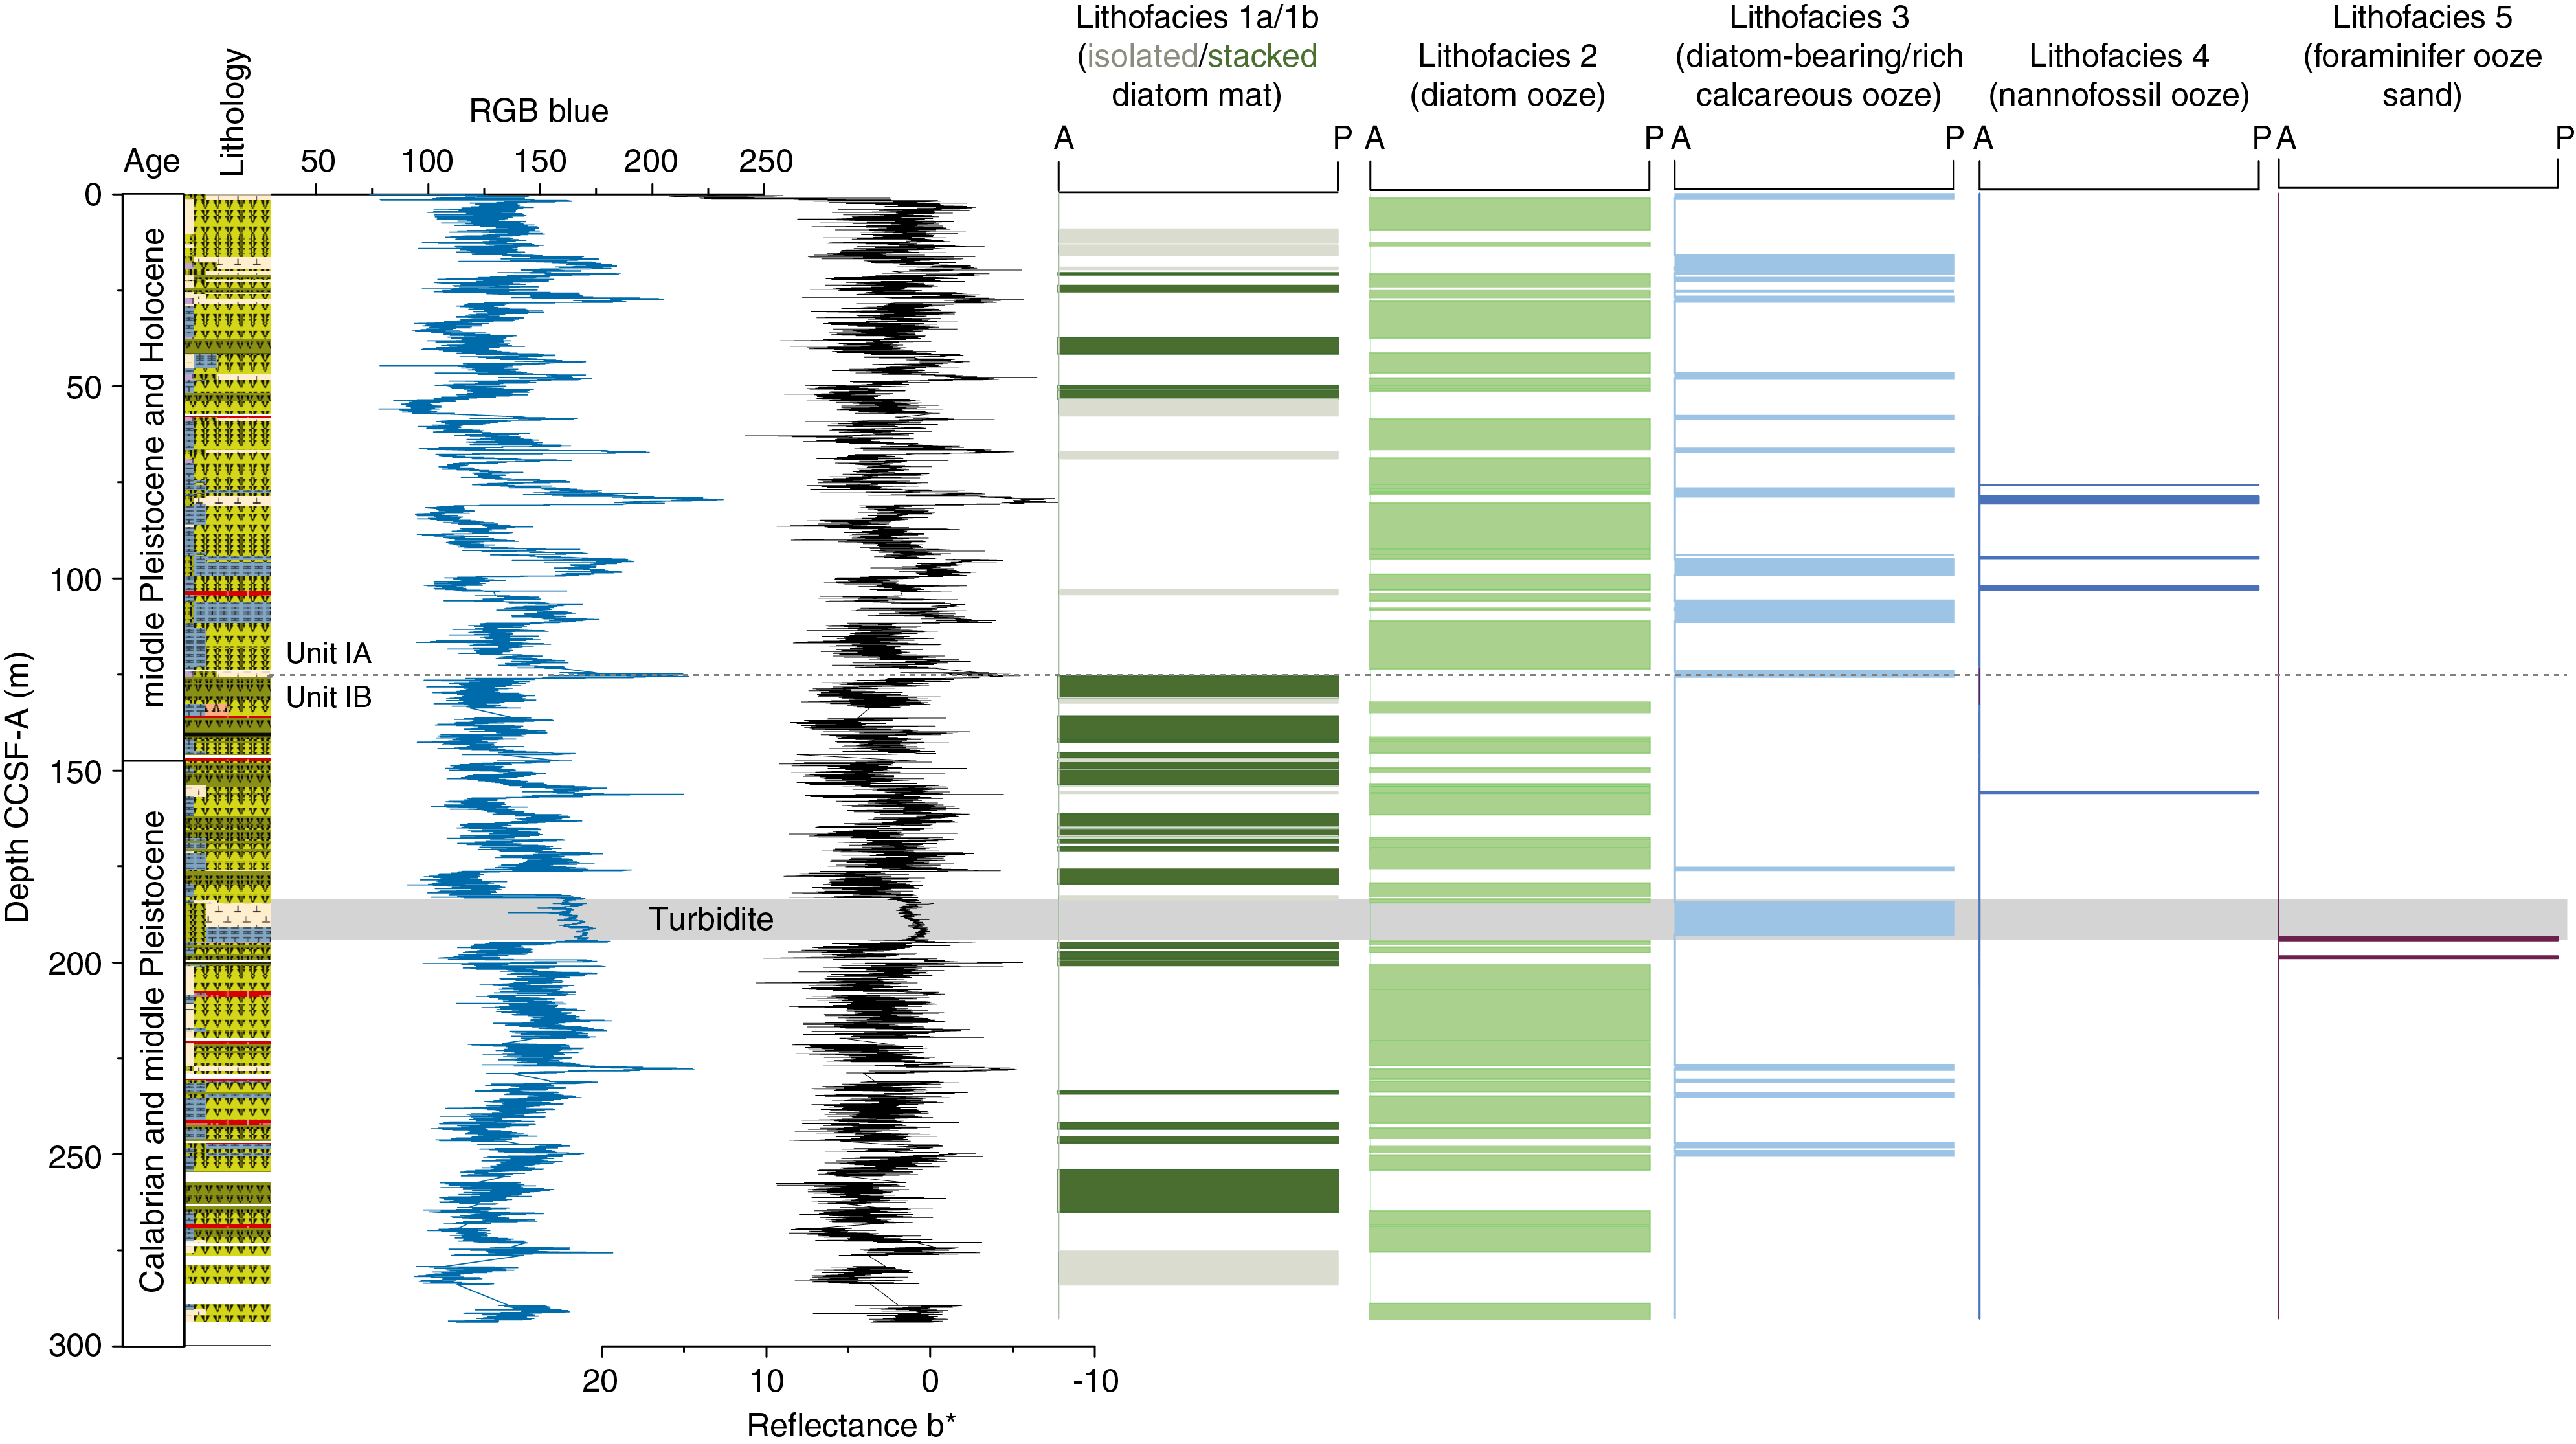
Figure F16. Primary lithostratigraphic variations, Site U1539.
Biostratigraphic age assignments are in agreement with each other and are mainly derived from diatom, radiolarian, and calcareous nannofossil datums. The preliminary shipboard age model derived largely from diatom, radiolarian, and nannofossil datums indicate no major hiatuses, indicating that a continuous sediment sequence from the early Pleistocene through the Holocene was recovered at this site.
We could not observe unambiguous evidence for geomagnetic reversals in any of the holes at Site U1539. This is probably due to low natural remanent magnetization (NRM) intensities that could be related to the high diatom content of the sediments. Therefore, paleomagnetic reversals were not included in the preliminary shipboard age model for Site U1539.
We analyzed samples for headspace gas, interstitial water chemistry, and bulk sediment chemistry at a resolution of three per core for Hole U1539A and three per core from 78.9 to 120 m CSF-A, two per core from 120 to 150 m CSF-A, and one per core from 150 m CSF-A to the bottom of Hole U1539C at 266.41 m CSF-A. Headspace samples were not collected from HLAPC cores. Methane concentration is low at this site overall. It gradually increases downhole, averaging 12.3 ppmv and never exceeding 18.4 ppmv. Ethane and propane remain below detection limit throughout the entire hole. In Hole U1539A, alkalinity increases in the uppermost 10.6 m to ~5 mM, likely because of anaerobic organic matter remineralization. pH values also increase from 7.7 at the surface to ~8 at 2.94 m CSF-A and remain constant with depth. Interstitial water magnesium and lithium concentrations appear conservative throughout the sediment column. Dissolved manganese concentrations increase sharply from below detection limit in the mudline sample to a maximum of 60 µM at 7.57 m CSF-A, indicating anaerobic, reductive dissolution of manganese oxides within the uppermost 3 m of sediment.
The composite carbonate record at Site U1539 (Holes U1539A and U1539C) shows downhole variability ranging from 2.9 to 92.8 wt% and a strong correlation with RGB blue and reflectance L* measurements (Figure F17) and gamma ray attenuation (GRA) bulk density. Total organic carbon (TOC) concentration has a mean value of 0.40 wt%, and values range between 0.18 and 0.75 wt% (n = 86). Total nitrogen (TN) concentrations vary between 0.004 and 0.079 wt% with a U1539 average of 0.039 wt% (n = 90). The mean value of TOC/TN is often >10 from 0.8 m CSF-A in Hole U1539A to 115.2 m CSF-A in Hole U1539C.
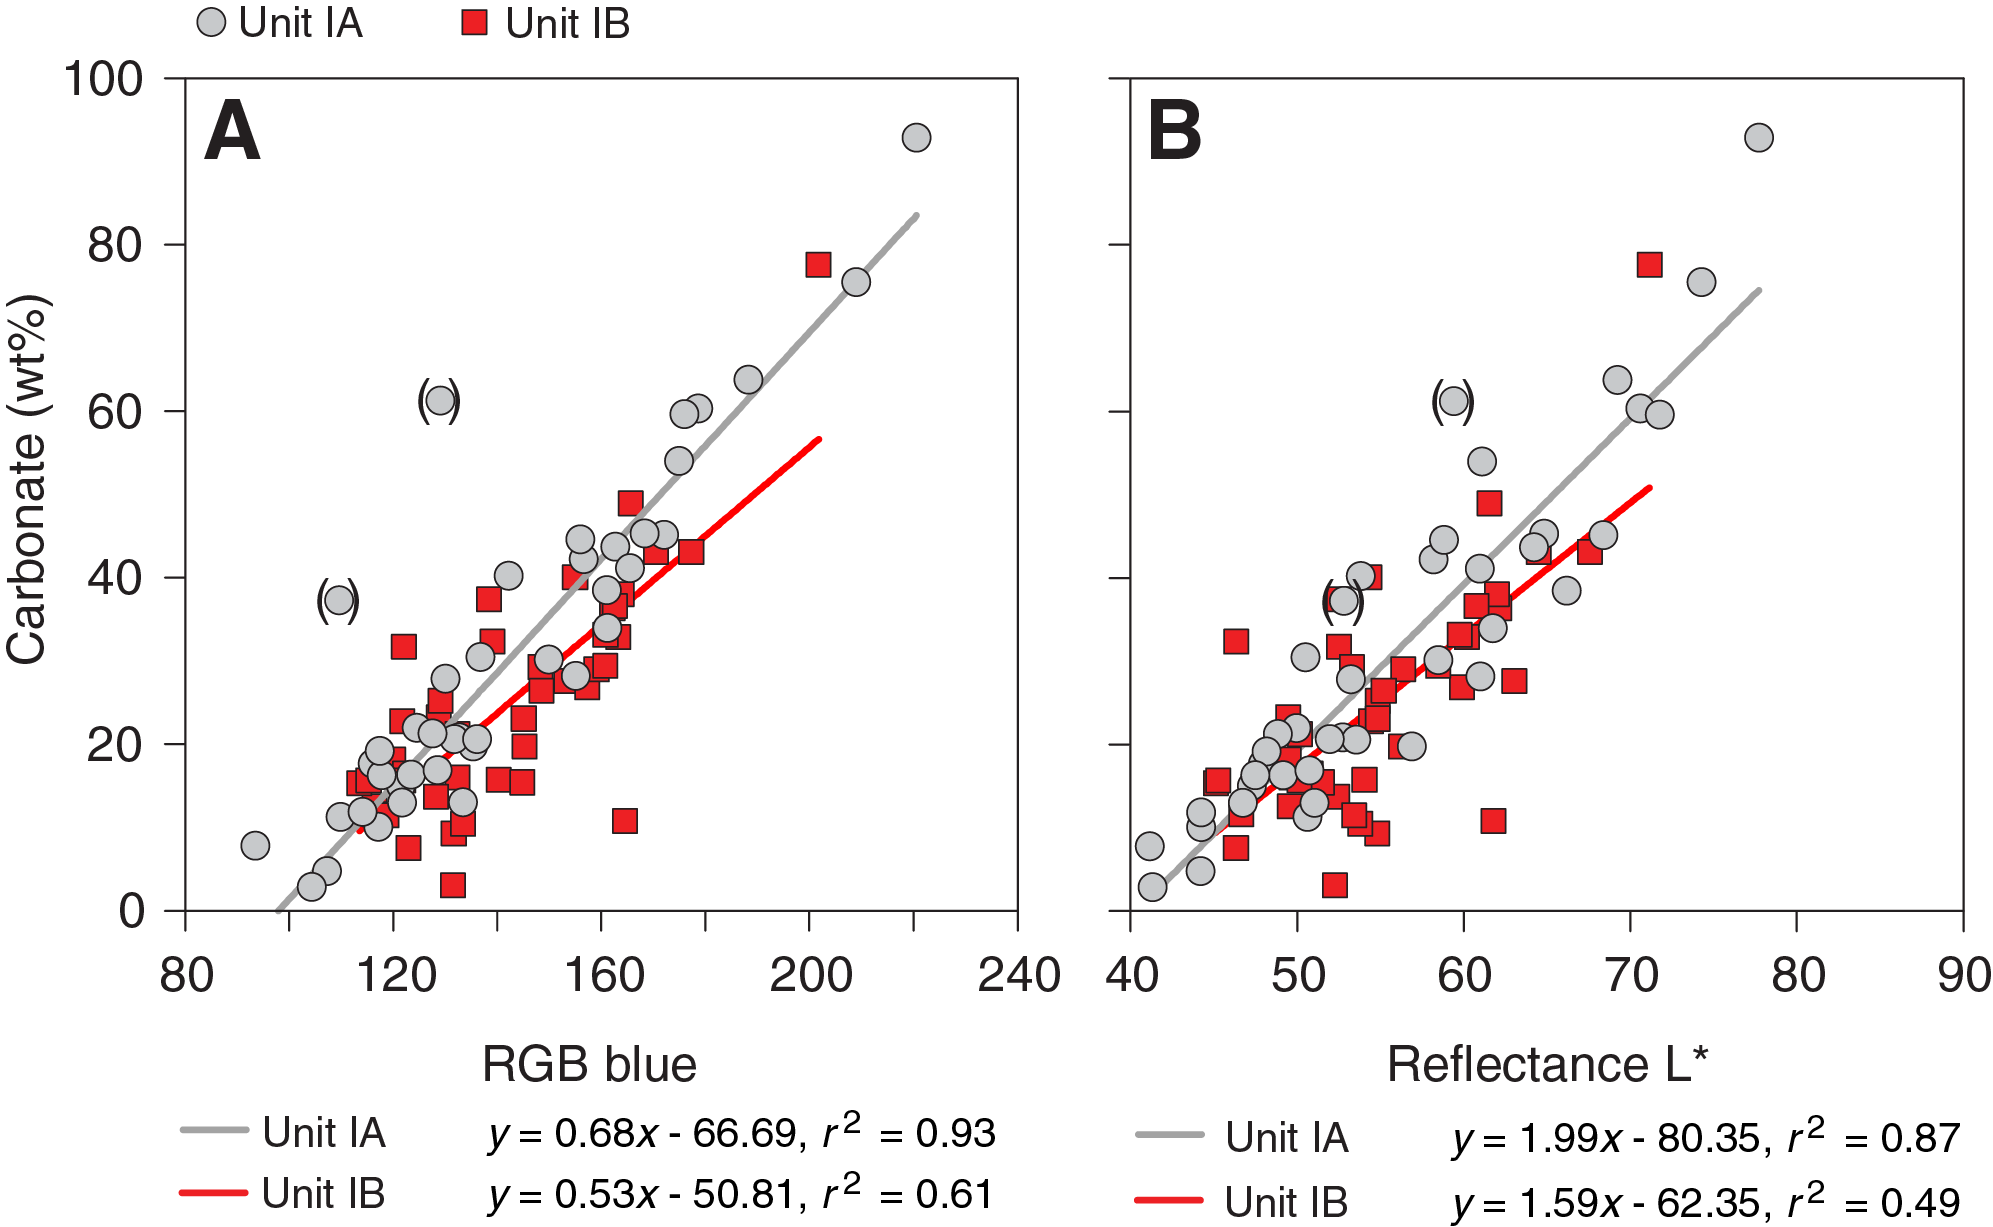
Figure F17. Bulk sedimentary carbonate content, RGB blue, and L*, Holes U1539A and U1539C.
Physical properties measurements at Site U1539 included nondestructive whole-round measurements of GRA bulk density, magnetic susceptibility (MS), Whole-Round Multisensor Logger (WRMSL) P-wave velocity, and natural gamma radiation (NGR) on core sections from Holes U1539A–U1539D. Additional physical properties collected include thermal conductivity on whole-round cores from all holes. Downhole changes in physical property characteristics overall are in good agreement with the lithofacies defined based on sedimentologic characteristics (Figure F18). In general, diatom ooze lithofacies (1a and 1b) correspond to relatively higher MS, low bulk density, and high porosity. The lowest densities and highest porosities occur in diatom mats within diatom ooze, which is the recurring dominant Lithofacies 1b. In contrast, intervals that are predominantly calcareous nannofossil ooze (Lithofacies 4 and 5) correspond with decreased NGR, high bulk density, low P-wave velocity, low to moderate MS, and low to moderate porosity. Over most of the record, GRA bulk density shows an anticorrelation with the NGR-derived potassium concentrations and MS. The NGR record also exhibits 10–15 m scale cyclicity, particularly from ~10 to 135 m CSF-A. NGR data also imply that total counts and the derived potassium concentrations can be used as a semiquantitative proxy for the abundance of terrigenous material delivered by dust or sea ice and iceberg transport.
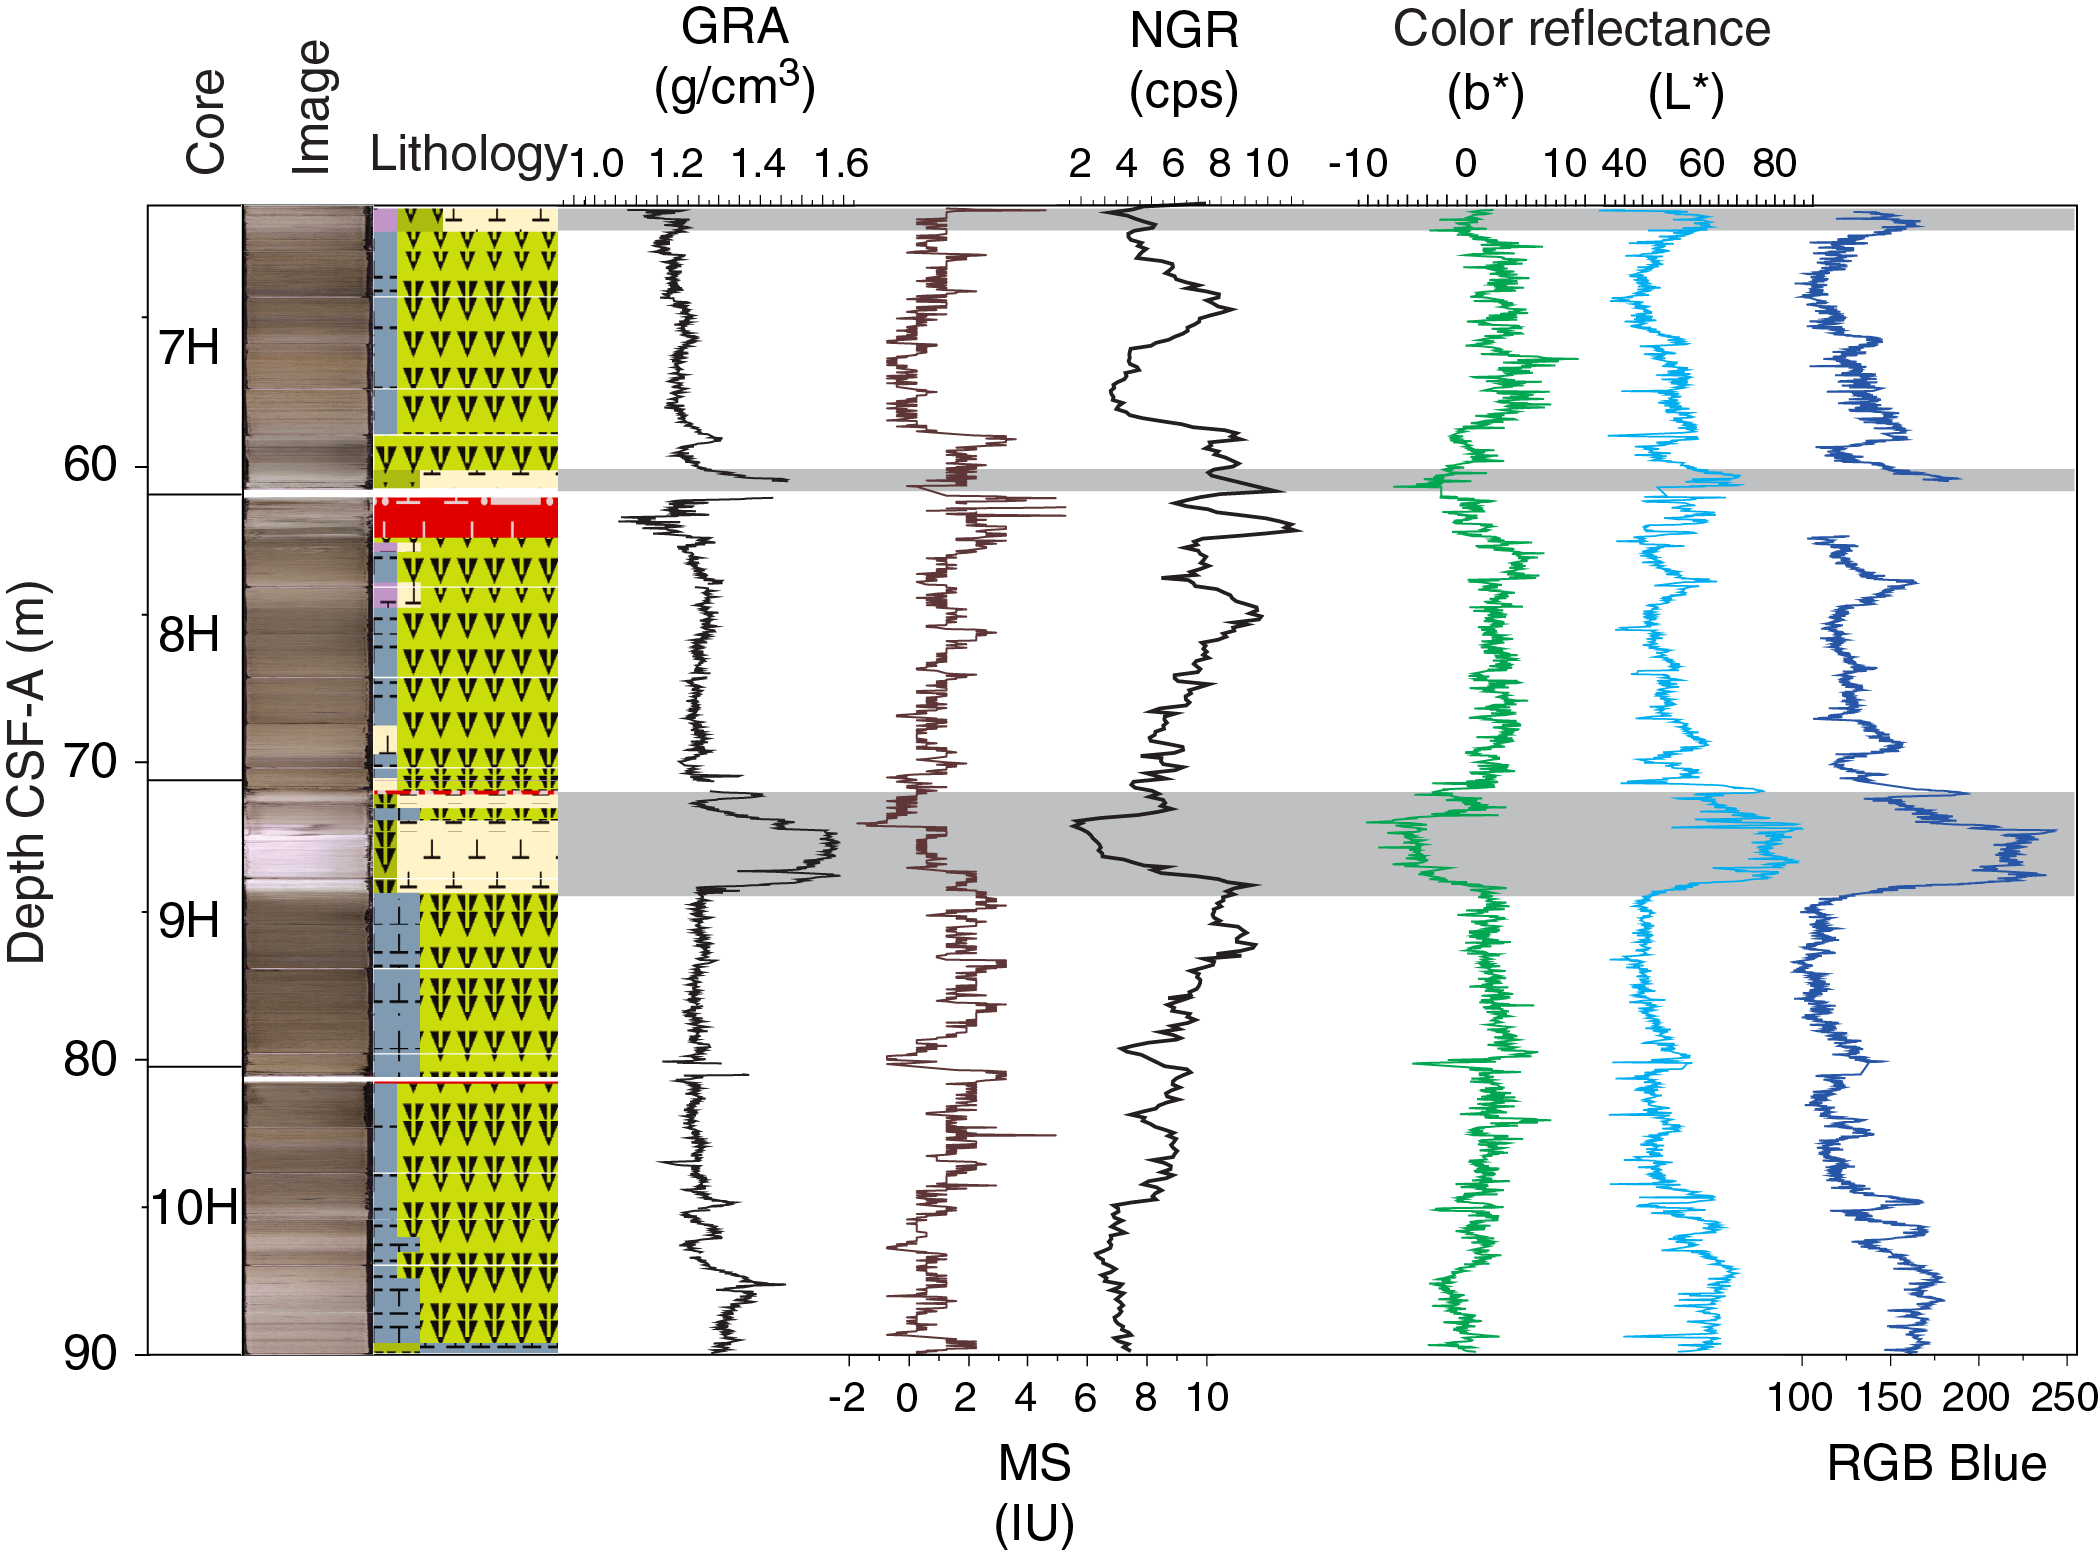
Figure F18. Physical properties, Hole U1539A.
Correlations between holes at Site U1539 were accomplished using the Correlator software (version 3.0). We constructed a splice for the upper portion of the site from 0 to 219.80 m CCSF-A using Holes U1539A–U1539D. However, the splice contains several gaps, as detailed below. Below 219.80 m CCSF-A, only a single hole (U1539C) was drilled; thus, Cores 383-U1539C-22H through 32F were appended to the splice with gaps set between each core to the bottom of the hole. The composite depth scale is anchored to the mudline of Core 383-U1539A-1H, which is assigned as 0 m CCSF-A.
We constructed a preliminary age model based on biostratigraphic results, mainly including diatom and nannofossil age markers. These data suggest that the sedimentary sequence recovered at Site U1539 covers the past ~1.3 My (Figure F19). For a pelagic setting, sedimentation rates are extraordinarily high, reaching on average 17 cm/ky back to 0.9 Ma and even higher values of ~30 cm/ky from ~0.9 to 1.3 Ma. This biostratigraphic age model is generally consistent with preliminary stratigraphic tuning performed onboard based on physical property data such as color measurements (RGB blue) and GRA bulk density.
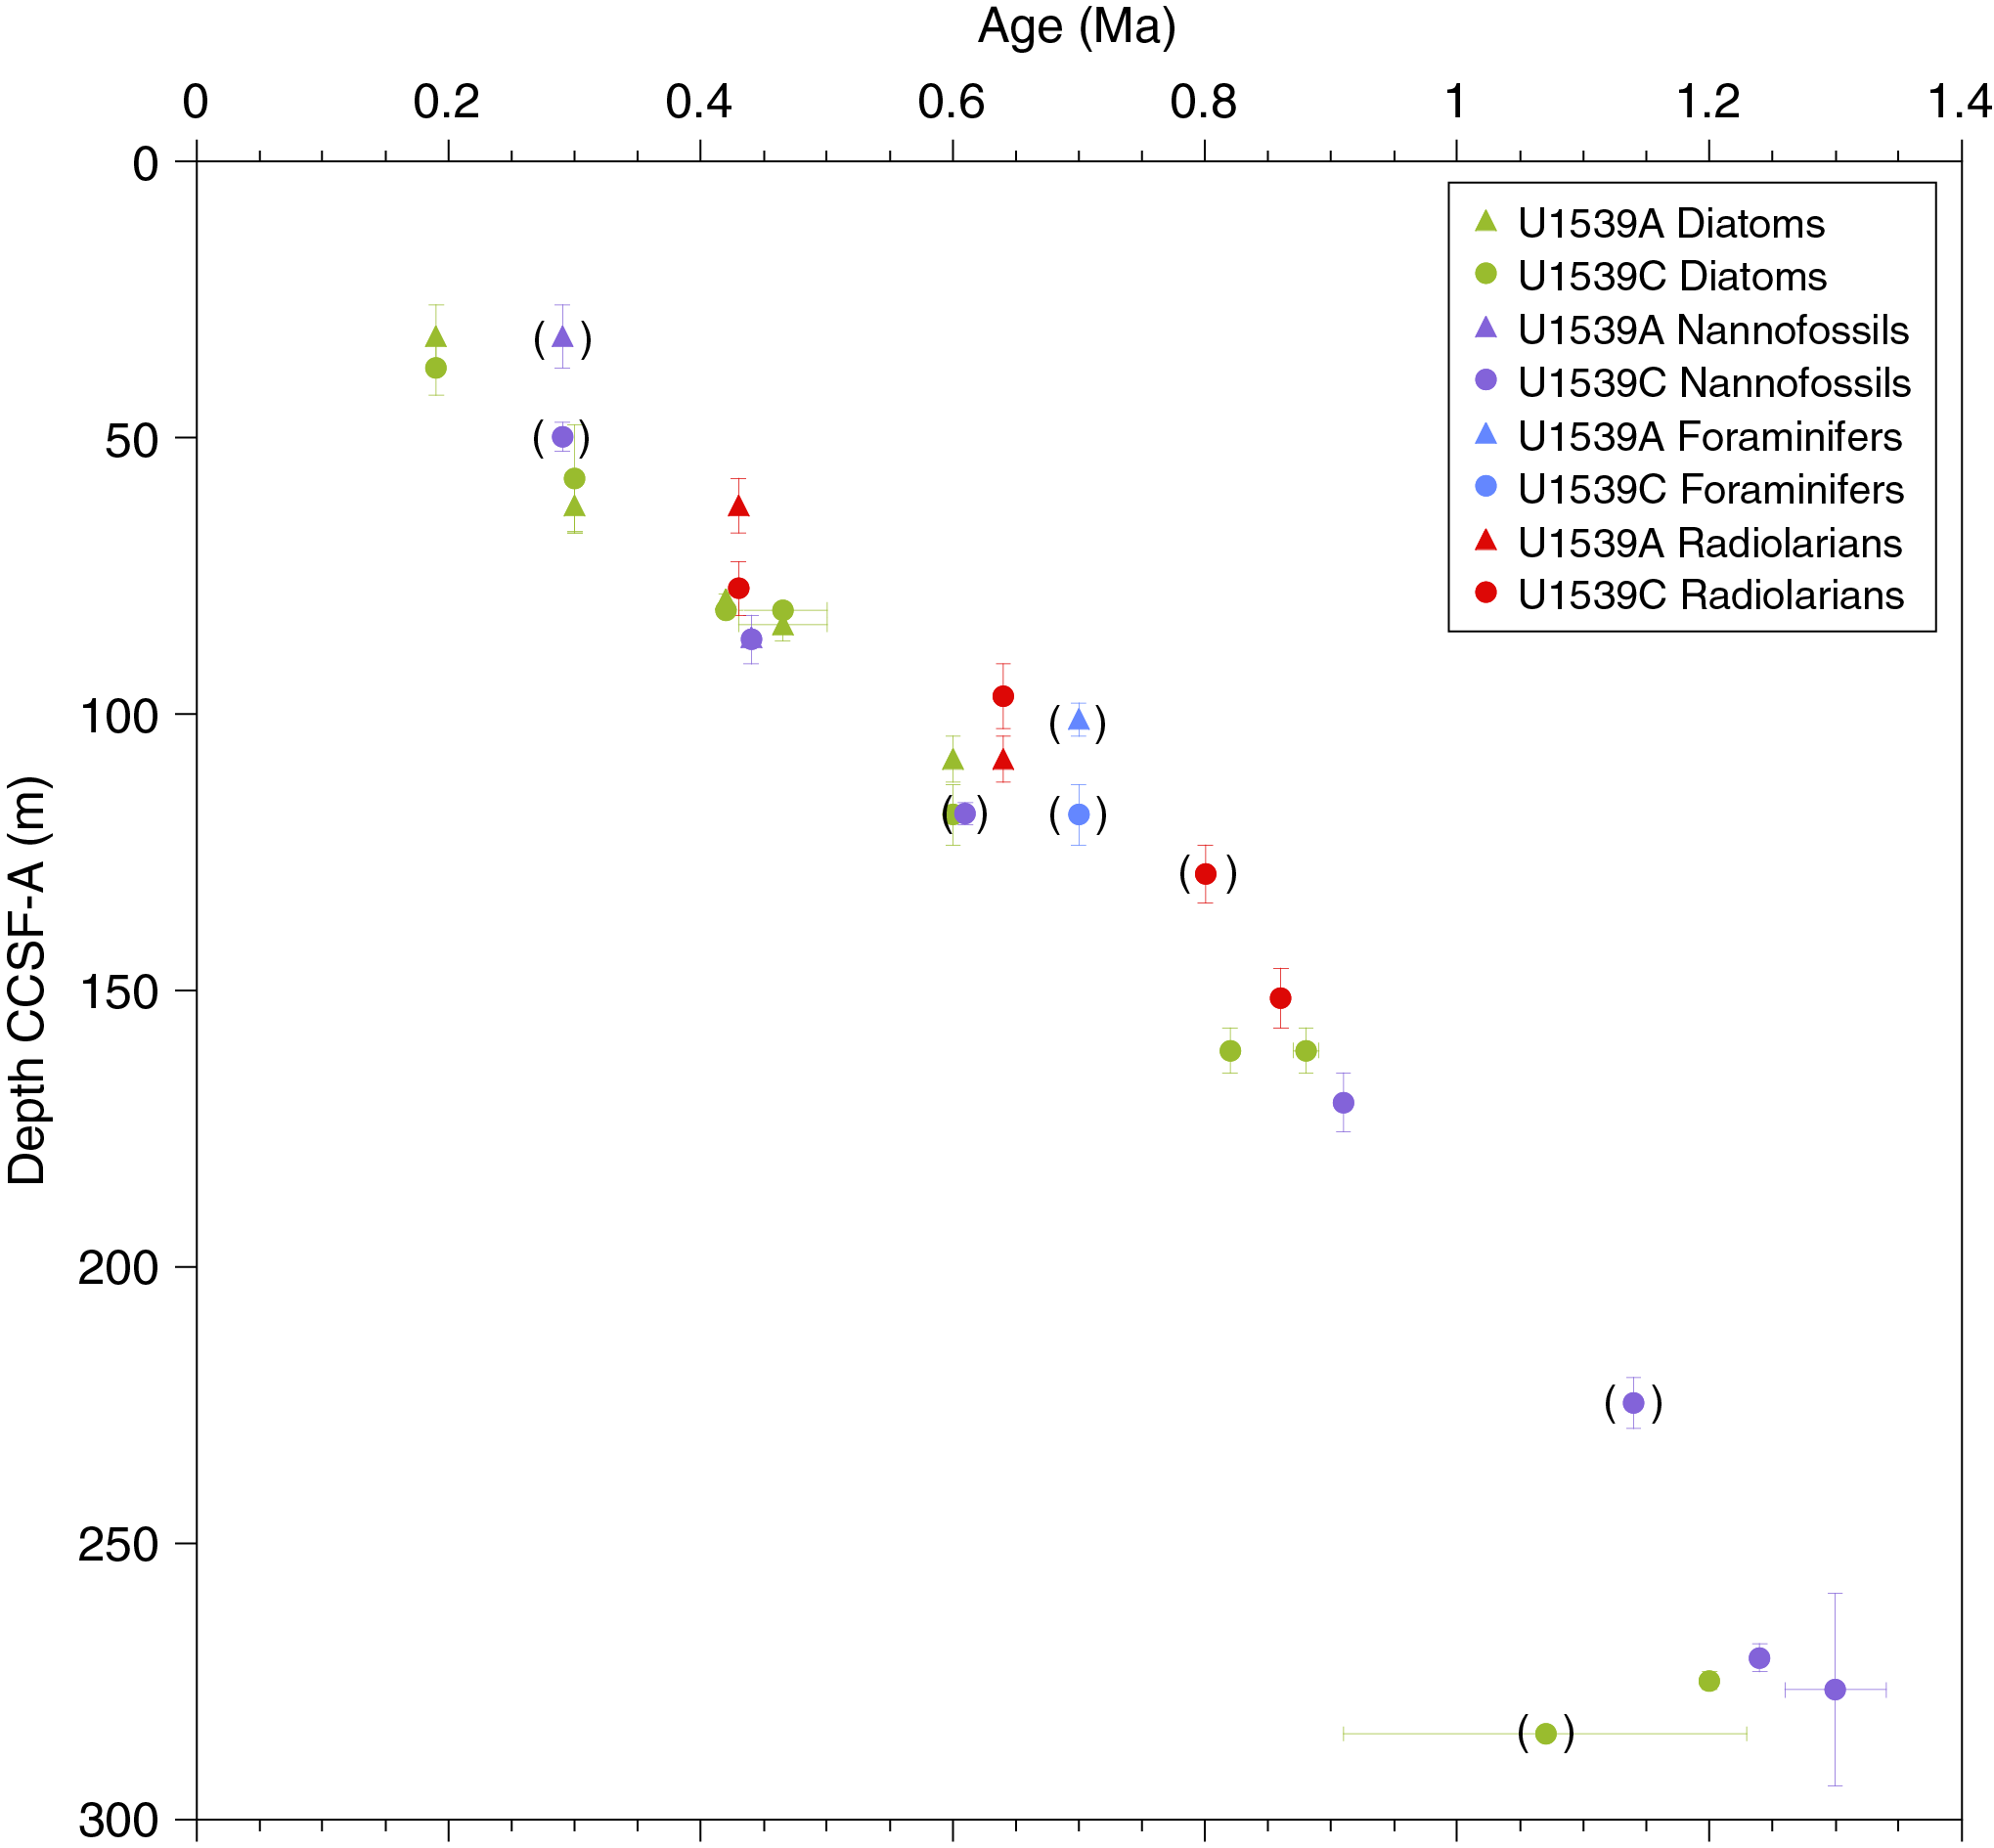
Figure F19. Preliminary age model, Site U1539.
The combination of nearly continuous recovery, very high sedimentation rates driven by high diatom productivity and potential sediment focusing, clear patterns in physical properties and sediment color, and a rich array of well-preserved diatoms combined with calcareous microfossils will provide unprecedented opportunities for improving our understanding of the dynamics of the ACC and its link to global carbon cycle changes at orbital and suborbital timescales.
Site U1540
Background and objectives
Site U1540 (Proposed Site CSP-7A) is located in the CSP at 55°08.467′S, 114°50.515′W, ~1600 nmi west of the Strait of Magellan at 3580 m water depth (Figure F20). The site sits at the eastern flank of the southernmost EPR within the Eltanin-Tharp Fracture Zone, ~130 nmi from the modern seafloor spreading axis, and is underlain by oceanic crust formed at the EPR about 6–8 My ago (Eagles, 2006). Assuming overall constant seafloor half-spreading rates of ~4.5 cm/y (Pitman and Heirtzler, 1966), the plate tectonic backtrack path of Site U1540 moves the site westward to an early Pliocene position ~100 nmi closer to the crest of the EPR at a water depth shallower by several hundred meters. At a smaller scale, the site is located at the northeast end of a ridge that parallels the orientation of the EPR.
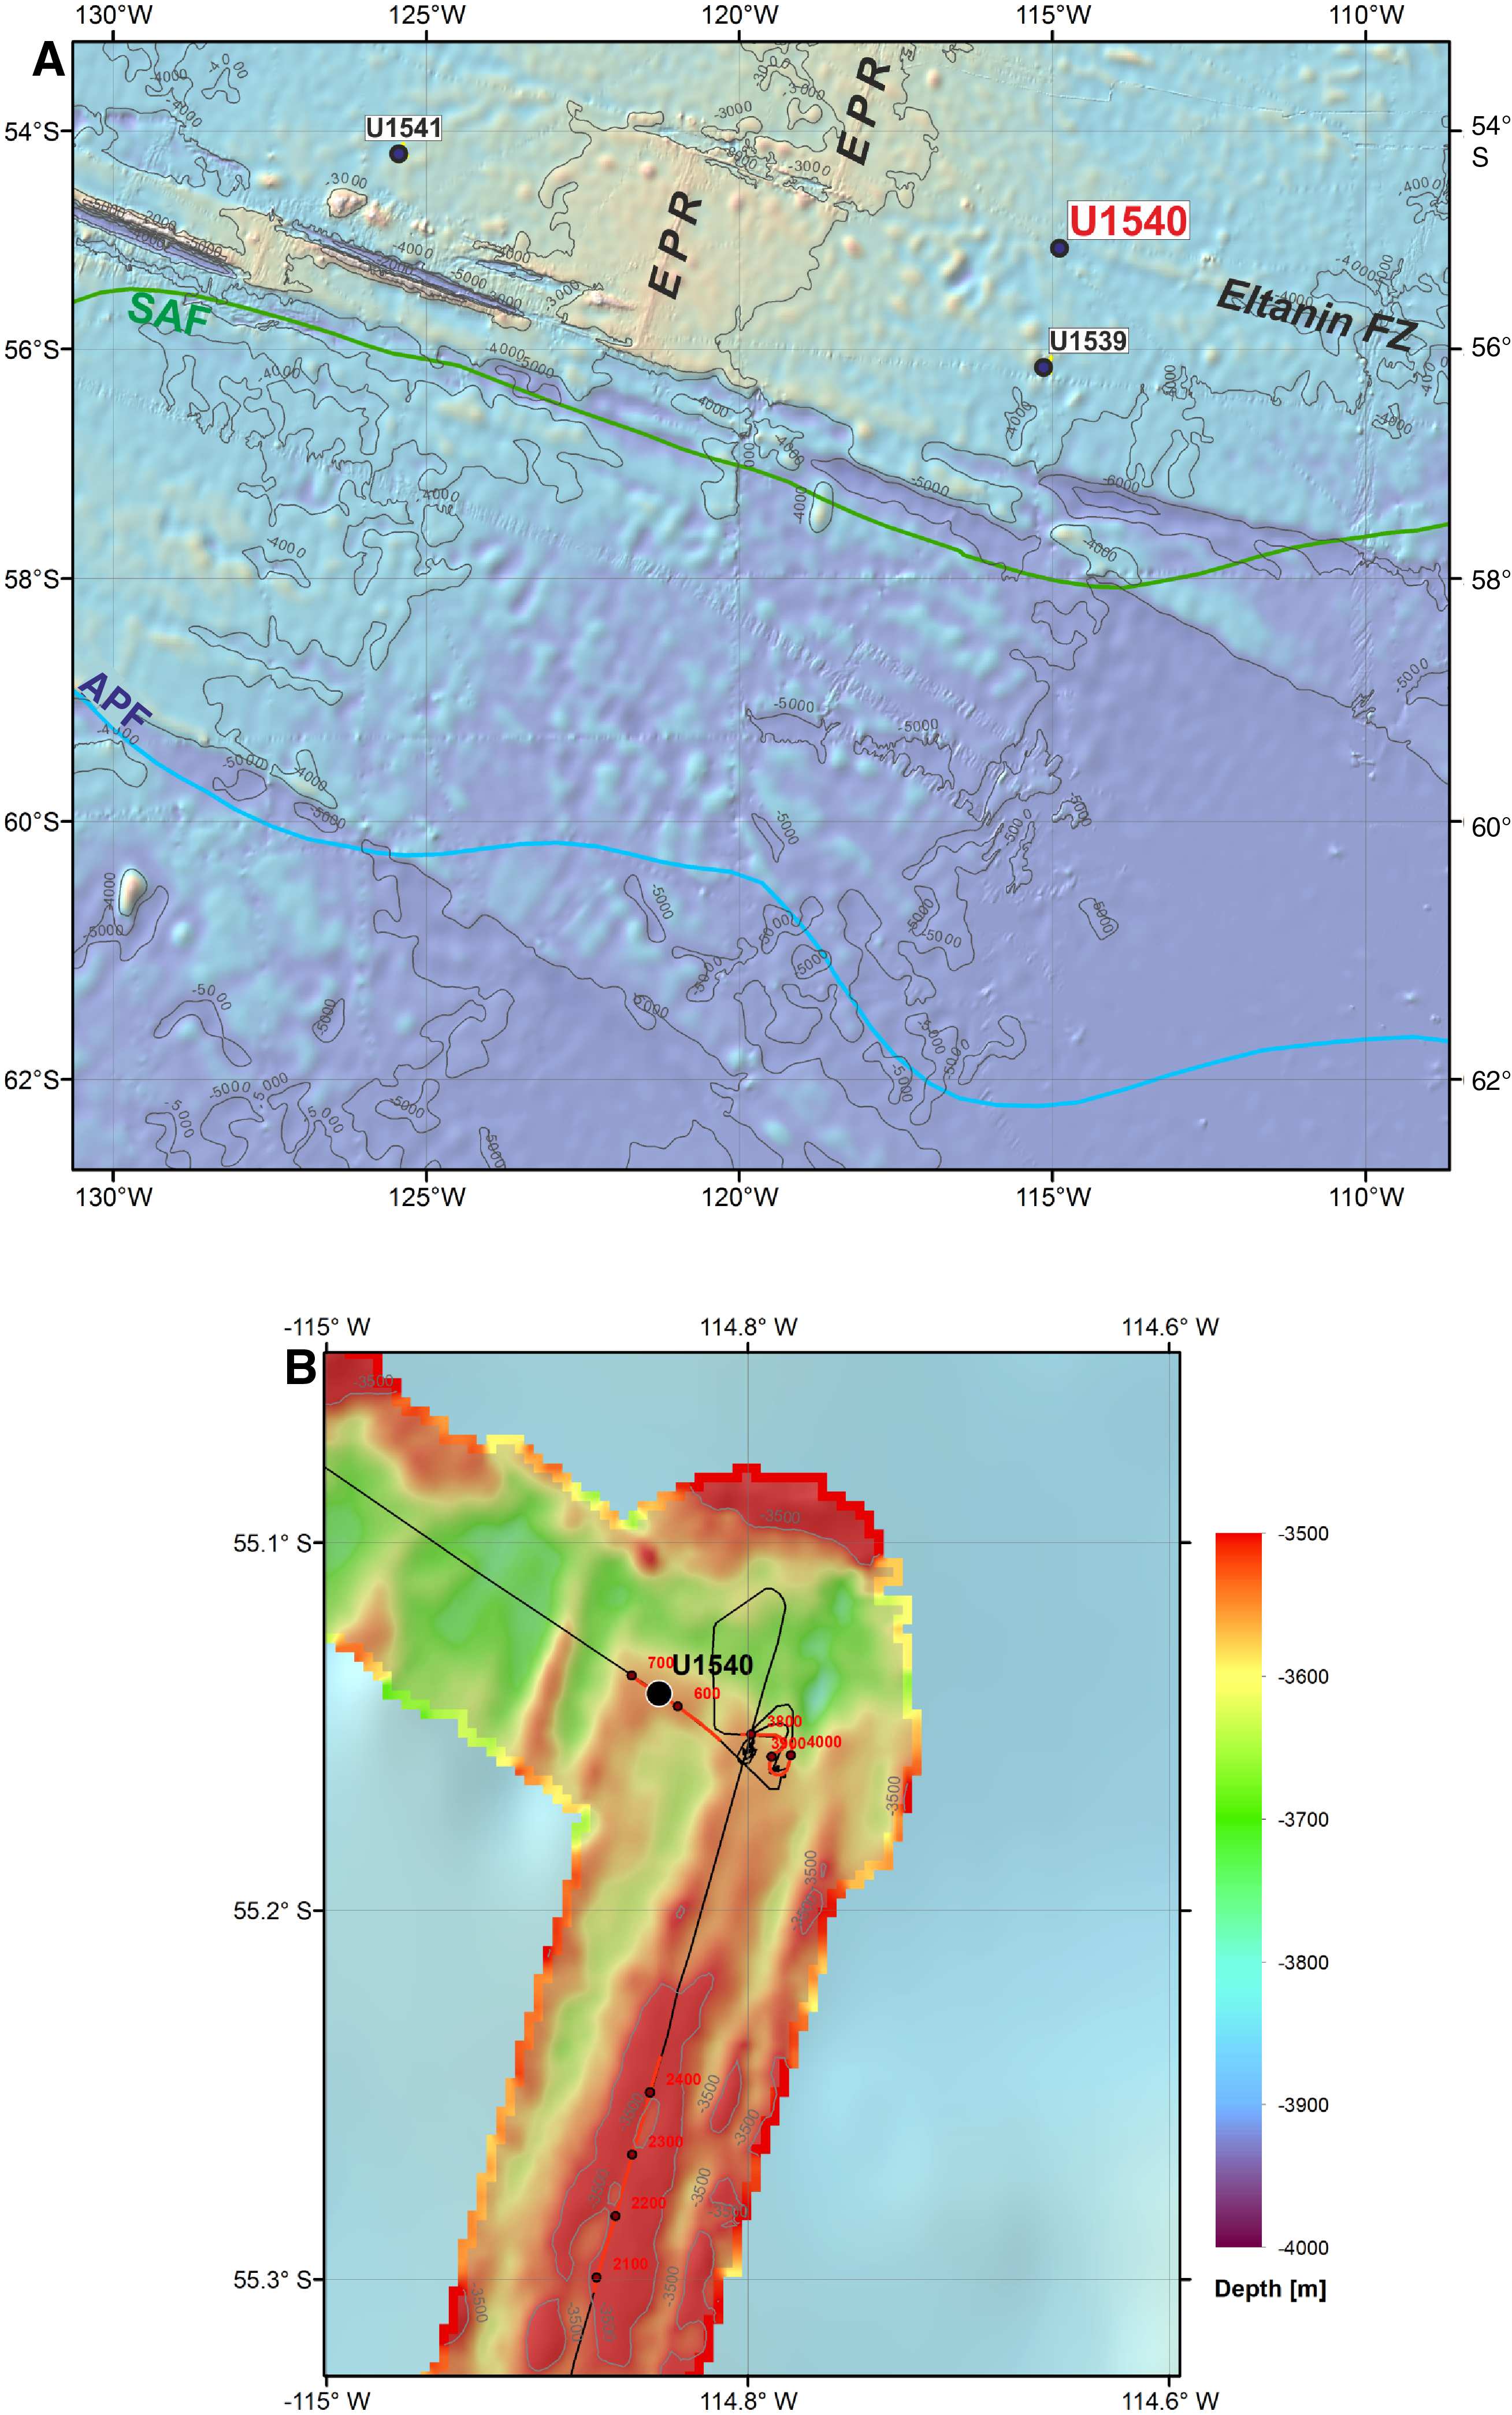
Figure F20. Oceanographic and bathymetric setting, Site U1540.
Site U1540 is crossed by a sediment echo sound (Parasound) profile that is oriented northwest–southeast. The Parasound profile documents excellent penetration (>150 m) with distinct layering (Figure F21), suggesting a succession of fine-grained soft sediments with varying lithologic composition. The site is also located ~2 nmi northwest of site survey Core PS75/056-1 (Gersonde, 2011) (Figure F5).
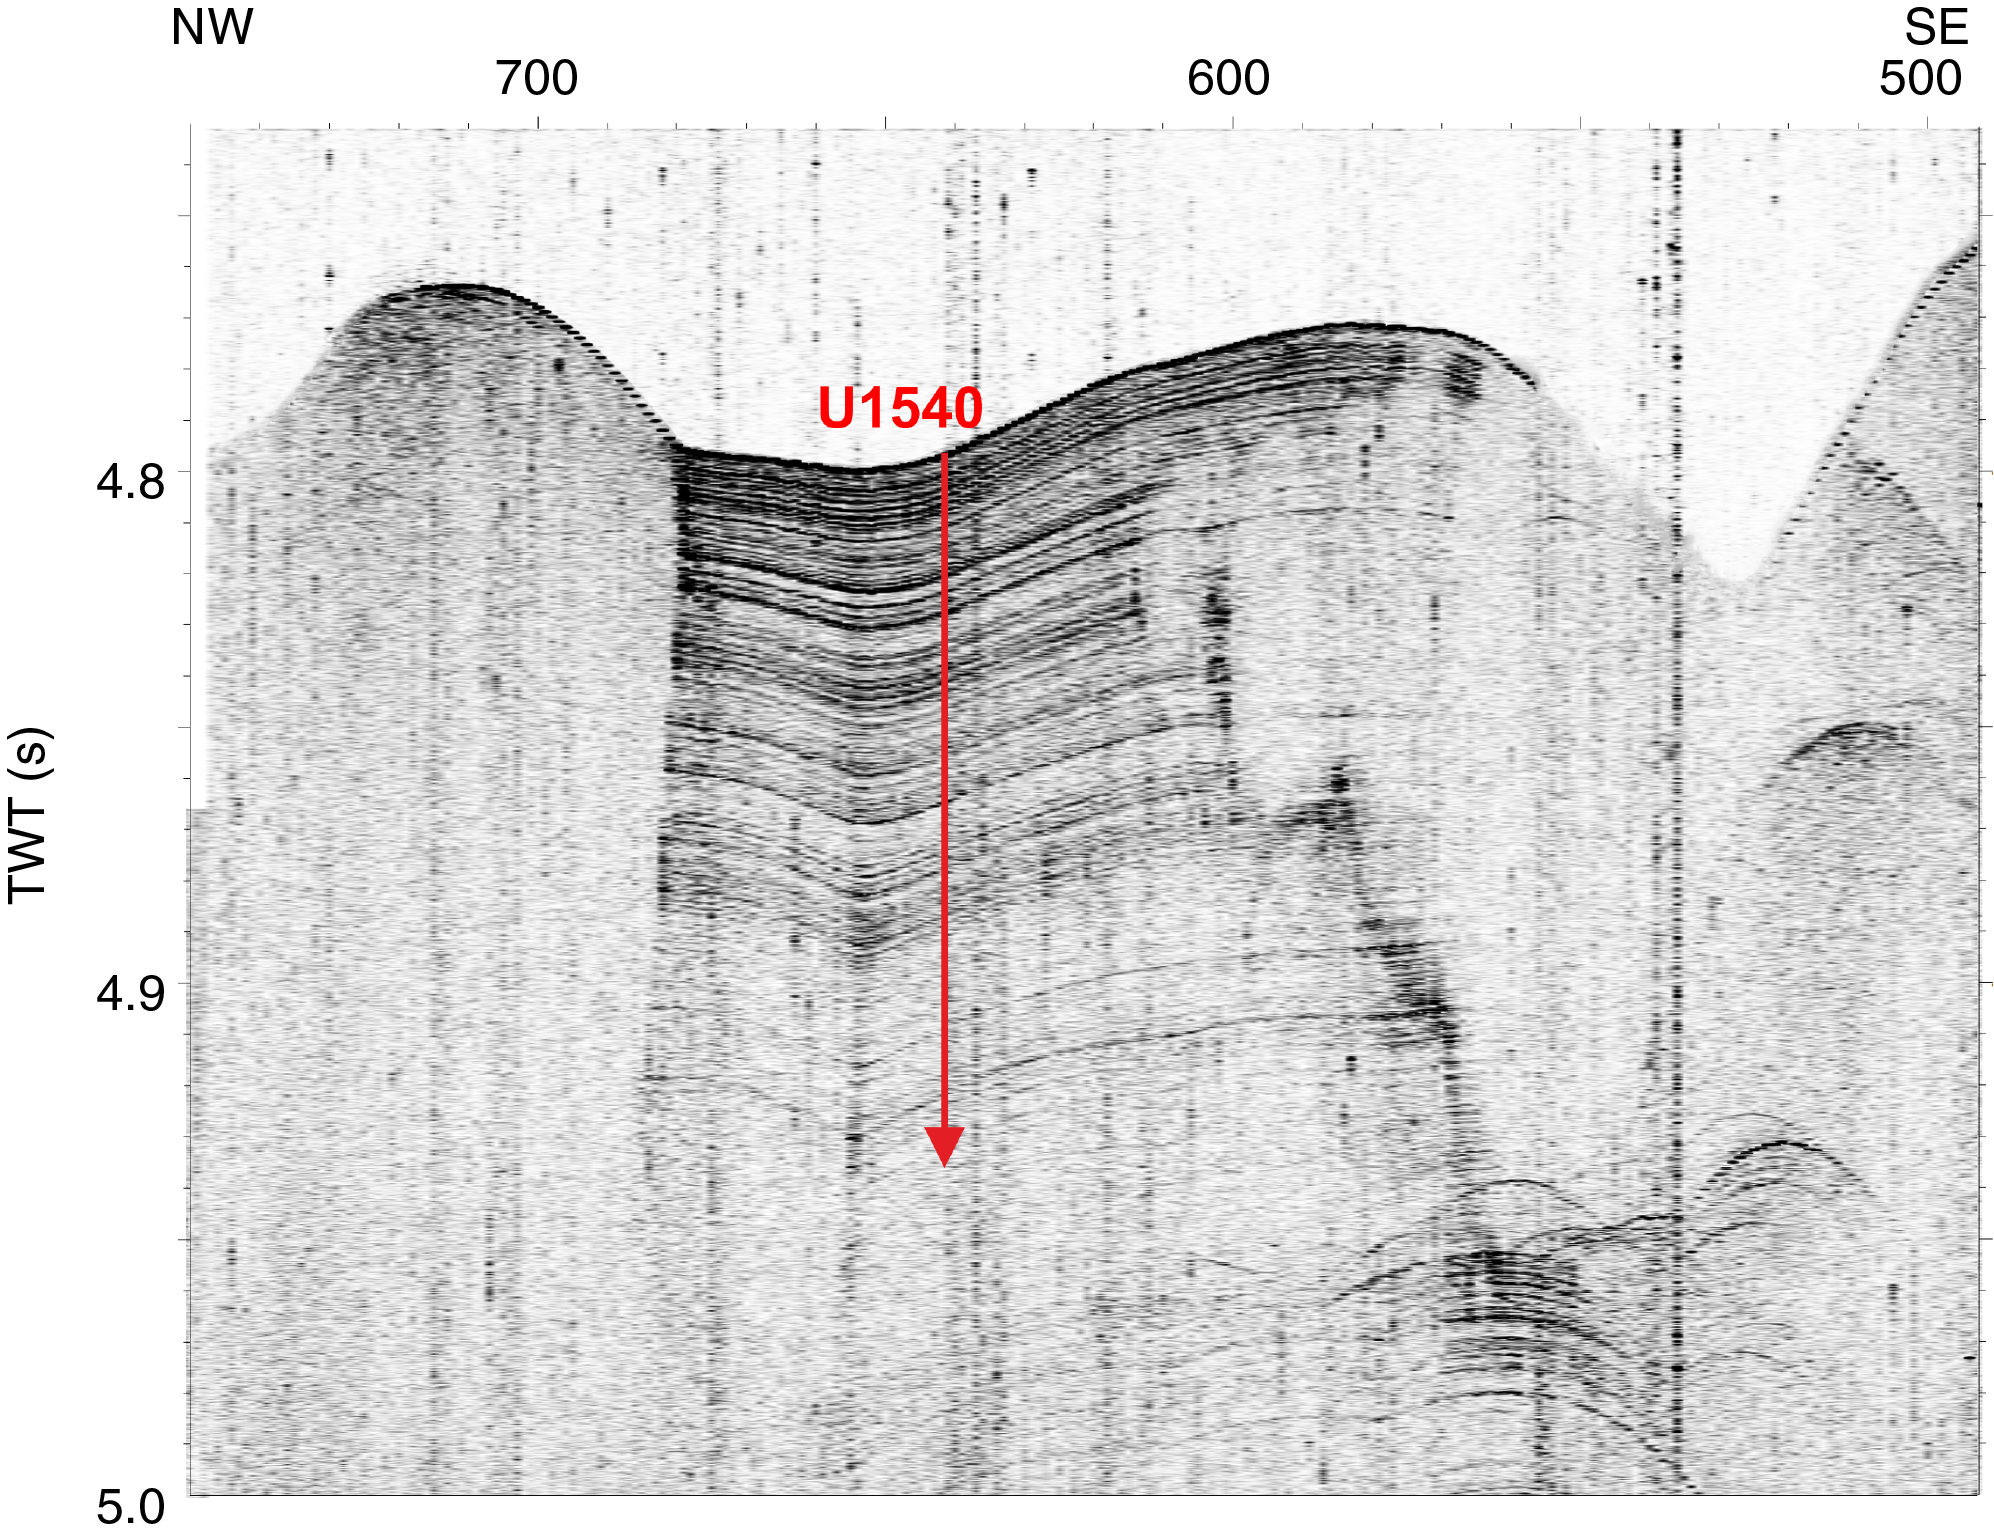
Figure F21. Parasound profile, Site U1540.
Site U1540 lies in the pathway of the Subantarctic ACC, ~170 nmi north of the modern mean position of the SAF in a zonal transition zone of the ACC. West of the site, the ACC and the associated fronts are strongly steered by the topography of seafloor spreading systems (Udintsev and Eltanin-Tharp Fracture Zone systems), whereas to the east, the vast Amundsen Sea basin does not influence the position of the ACC strongly.
SSTs seasonally vary between ~2.5°C (July–September) and ~7°C (January–March). The area is located west of the main AAIW and Mode Water formation regions in the Southeast Pacific. The 3580 m water depth places Site U1540 within LCDW (Figure F14). This hydrographic setting makes it ideal to evaluate past changes in frontal position, associated export production, ACC current speed and position, and aeolian dust and IRD input during the Pleistocene and Pliocene.
The main objectives at Site U1540 were to
- Recover a moderate- to high-resolution Subantarctic Pliocene–Quaternary sediment record close to the SAF;
- Characterize the stratigraphy of siliceous and calcareous oozes, allowing for a wide range of paleoceanographic reconstructions;
- Reconstruct high-amplitude Subantarctic SSTs and sea ice variations;
- Provide a record of LCDW and glacial AABW;
- Reconstruct export production (opal versus carbonate), nutrient distribution, and dust-productivity coupling; and
- Recover a potential far-field record of WAIS variability.
Operations
The sea voyage to Site U1540 began at 0224 h on 7 June 2019. It was a short 61 nmi transit that was completed in only 6.1 h, and the ship arrived on site at 0830 h. The thrusters were lowered, and the vessel was in full dynamic positioning mode over the site coordinates by 0929 h. The drill crew made up an APC/extended core barrel (XCB) bottom-hole assembly (BHA) and lowered the drill string to the seafloor, placing the bit at 2171 meters below rig floor (mbrf) by 1645 h. The vessel began experiencing heave above 7 m with a roll of ~5° at that time, and it was decided to wait for the seas to calm before continuing operations.
By 0415 h on 8 June, the seas had calmed sufficiently to continue operations. With an estimated depth of 3600.6 mbrf (calculated by the precision depth recorder [PDR]), the bit was lowered to 3595.0 mbrf to spud Hole U1540A. Core 1H recovered 9.0 m of sediment and determined a seafloor depth of 3584.6 mbsl. Hole U1540A was deepened to 150 m CSF-A, and Cores 1H–16H recovered 155.1 m (103%) by 0815 h on 9 June. The top drive was set back, and the bit was pulled to 3561 mbrf, clearing the seafloor at 0900 h on 9 June and ending Hole U1540A. Formation temperature measurements were taken with the advanced piston corer temperature (APCT-3) tool on Cores 4H, 7H, 10H, 13H, and 16H, and orientation measurements were taken on all cores. Misfires were recorded on Cores 1H, 7H, and 16H. A misfire on Core 7H caused an unreliable temperature reading.
The vessel was moved 20 m east, and the bit was lowered to 3575 mbrf to spud Hole U1540B. Our first attempt to take a mudline core did not retrieve any sediment. The bit was then lowered 9.5 m to 384.5 mbrf, and Hole U1540B was started at 1220 h on 9 June. Based on the recovery in Core 1H, the seafloor was calculated at 3580.0 mbsl. APC coring continued to 150 m CSF-A with three drilled intervals (totaling 10 m) to help obtain good overlap with cores from Hole U1540A. A total of 16 cores were taken over a 140.8 m interval with 101% recovery. Misfires were recorded on Cores 1H, 6H, 8H, and 11H. The bit was raised, clearing the seafloor at 0958 h on 10 June and ending Hole U1540B.
After coring Hole U1540B, permission was requested from the IODP Environmental Protection and Safety Panel to extend the allowed penetration depth at Site U1540 from 150 to 275 m CSF-A. This request was based on the successful recovery of a complete and continuous Pleistocene sedimentary record from Holes U1540A and U1540B. The increase in penetration depth would allow us to extend this record into the Pliocene, which was expected directly below the already cored maximum depth of 150 m CSF-A. An additional reason for the request was the prevailing sea conditions, which predicted two additional days of reasonably calm seas, thus allowing for further drilling, whereas significantly worst sea conditions were forecast at our two other primary sites in the CSP.
Hole U1540C was spudded 20 m south of Hole U1540B at 1110 h on 10 June with the bit positioned at 3587.5 mbrf. Core 383-U1540C-1H recovered 6.8 m, but the top of the core lacked the characteristic light brown oxidized layer that would have indicated the recovery of a good sediment–water interface. Therefore, we decided to end Hole U1540C and attempt another mudline core.
We repositioned the vessel 20 m west of Hole U1540C and started Hole U1540D with the bit at 3587.5 mbrf. Core 1H recovered 8.9 m (100%) with a noticeable light brown sediment layer at the top of the core. The amount of core recovered determined a water depth of 3577.5 mbsl. APC coring continued to 79.2 m CSF-A with three interspersed, short drilled intervals to ensure adequate core overlap for stratigraphic correlation between Holes U1540A–U1540C.
Permission to extend the penetration depth at Site U1540 to 275 m CSF-A was received while retrieving Core 383-U1540D-11H from 79.2 m CSF-A. At that point, we drilled ahead without recovery to 131.0 m CSF-A before resuming coring operations. The APC coring system was redeployed, and the hole was deepened until we reached APC refusal at 210.5 m CSF-A. Cores 21H and 22H (207.0–210.5 m CSF-A) recovered just 3.39 and 0.5 m of sediment, respectively, with numerous rock fragments. We chose to deploy the XCB system for one more core in an attempt to recover more of the presumed basement material, but after coring for 45 min with only 0.5 m of advancement, the core barrel was pulled back on board with no recovery. We raised the bit, which cleared the seafloor at 1710 h on 11 June, ending Hole U1540D. A total of 19 cores were taken over a 151.8 m interval with 151 m recovered (99%). Misfires were recorded on Cores 4H and 6H, and partial strokes were recorded on Cores 22H and 23H.
The vessel was offset another 20 m west of Hole U1540D, and the bit was spaced out for spudding another hole using the seafloor depth calculated from Hole U1540D. Hole U1540E was spudded at 1840 h on 11 June and drilled ahead without recovery to 135.0 m CSF-A. At that point, we deployed the APC system and cored continuously until APC refusal at 213.3 m CSF-A (Cores 2H–10H). The pipe was recovered on board, and the bit cleared the rotary table at 1900 h on 12 June. The rig was secured and readied for transit by 1905 h. A total of eight cores were taken from Hole U1540E with the APC system over a 76.0 m interval with 78.9 m recovered (104%). Core 10H experienced a partial stroke. Two drilled intervals advanced 137.0 m.
With the seas too high to raise the thrusters, the vessel waited on weather until the seas calmed down at 1545 h on 13 June. The thrusters were then raised, and the vessel began the transit to Site U1541.
Principal results
A ~213 m thick continuous sequence of Holocene to early Pliocene sediments was recovered at Site U1540 (Figure F22). A bottom-hole age of ~4.8 Ma and a mean sedimentation rate of ~4.5 cm/ky were determined. The deepest cored sediments were recovered in Hole U1540E. A spliced sedimentary sequence ~227 m in length was constructed from Holes U1540A–U1540E. Five primary lithofacies were identified at this site (Figure F23). The numbering of facies is based on all facies documented for Expedition 383 so far. The sequence is dominated by light greenish gray to gray carbonate-bearing to carbonate-rich diatom oozes (Lithofacies 2). These are frequently interbedded with light gray or light greenish gray diatom-bearing to diatom-rich nannofossil or calcareous oozes (Lithofacies 3). Less abundant are white to very light gray nannofossil oozes of heavily bioturbated, massive appearance (Lithofacies 4) and greenish gray to gray clay-bearing to clay-rich biogenic oozes (Lithofacies 6) and carbonate- and/or biosilica-bearing clay (Lithofacies 7). Based on the distribution and co-occurrence of the defined lithofacies, we divided the Site U1540 sedimentary sequence into two lithostratigraphic units and divided Unit I into two subunits, IA and IB. Subunit IA extends to ~58 m CSF-A (~62.3 m CCSF-A) and is dominated by Lithofacies 2 and thin intercalated beds of Lithofacies 4. It is therefore broadly equivalent to Subunit IA at Site U1539. Subunit IB spans from ~58 to ~156 m CSF-A (~62.3 to 177.8 m CCSF-A) and shows an increased occurrence of Lithofacies 3 and a decreased contribution of Lithofacies 2. Lithofacies 1, 4, and 6 are virtually missing in this subunit. Unit II extends from 178 m CCSF-A to the base of the record at 227.13 m CCSF-A (165.83–210.50 m CSF-A in Hole U1540D and 165.33–213.3 m CSF-A in Hole U1540E). This unit is marked by a significant increase in the proportion of calcareous Lithofacies 3 and 4 and the appearance of the clay-bearing to clay-rich Lithofacies 6 in the lowermost ~40 m of the unit. Lithofacies 7 occupies parts of the lowermost ~8 m of Unit II, is pale yellowish brown to dark reddish brown, and the sediment appears to be enriched in iron (hydr)oxides. The last two sections of Core 383-U1540D-21H and the core catcher of Core 22H contain altered volcanic glass.
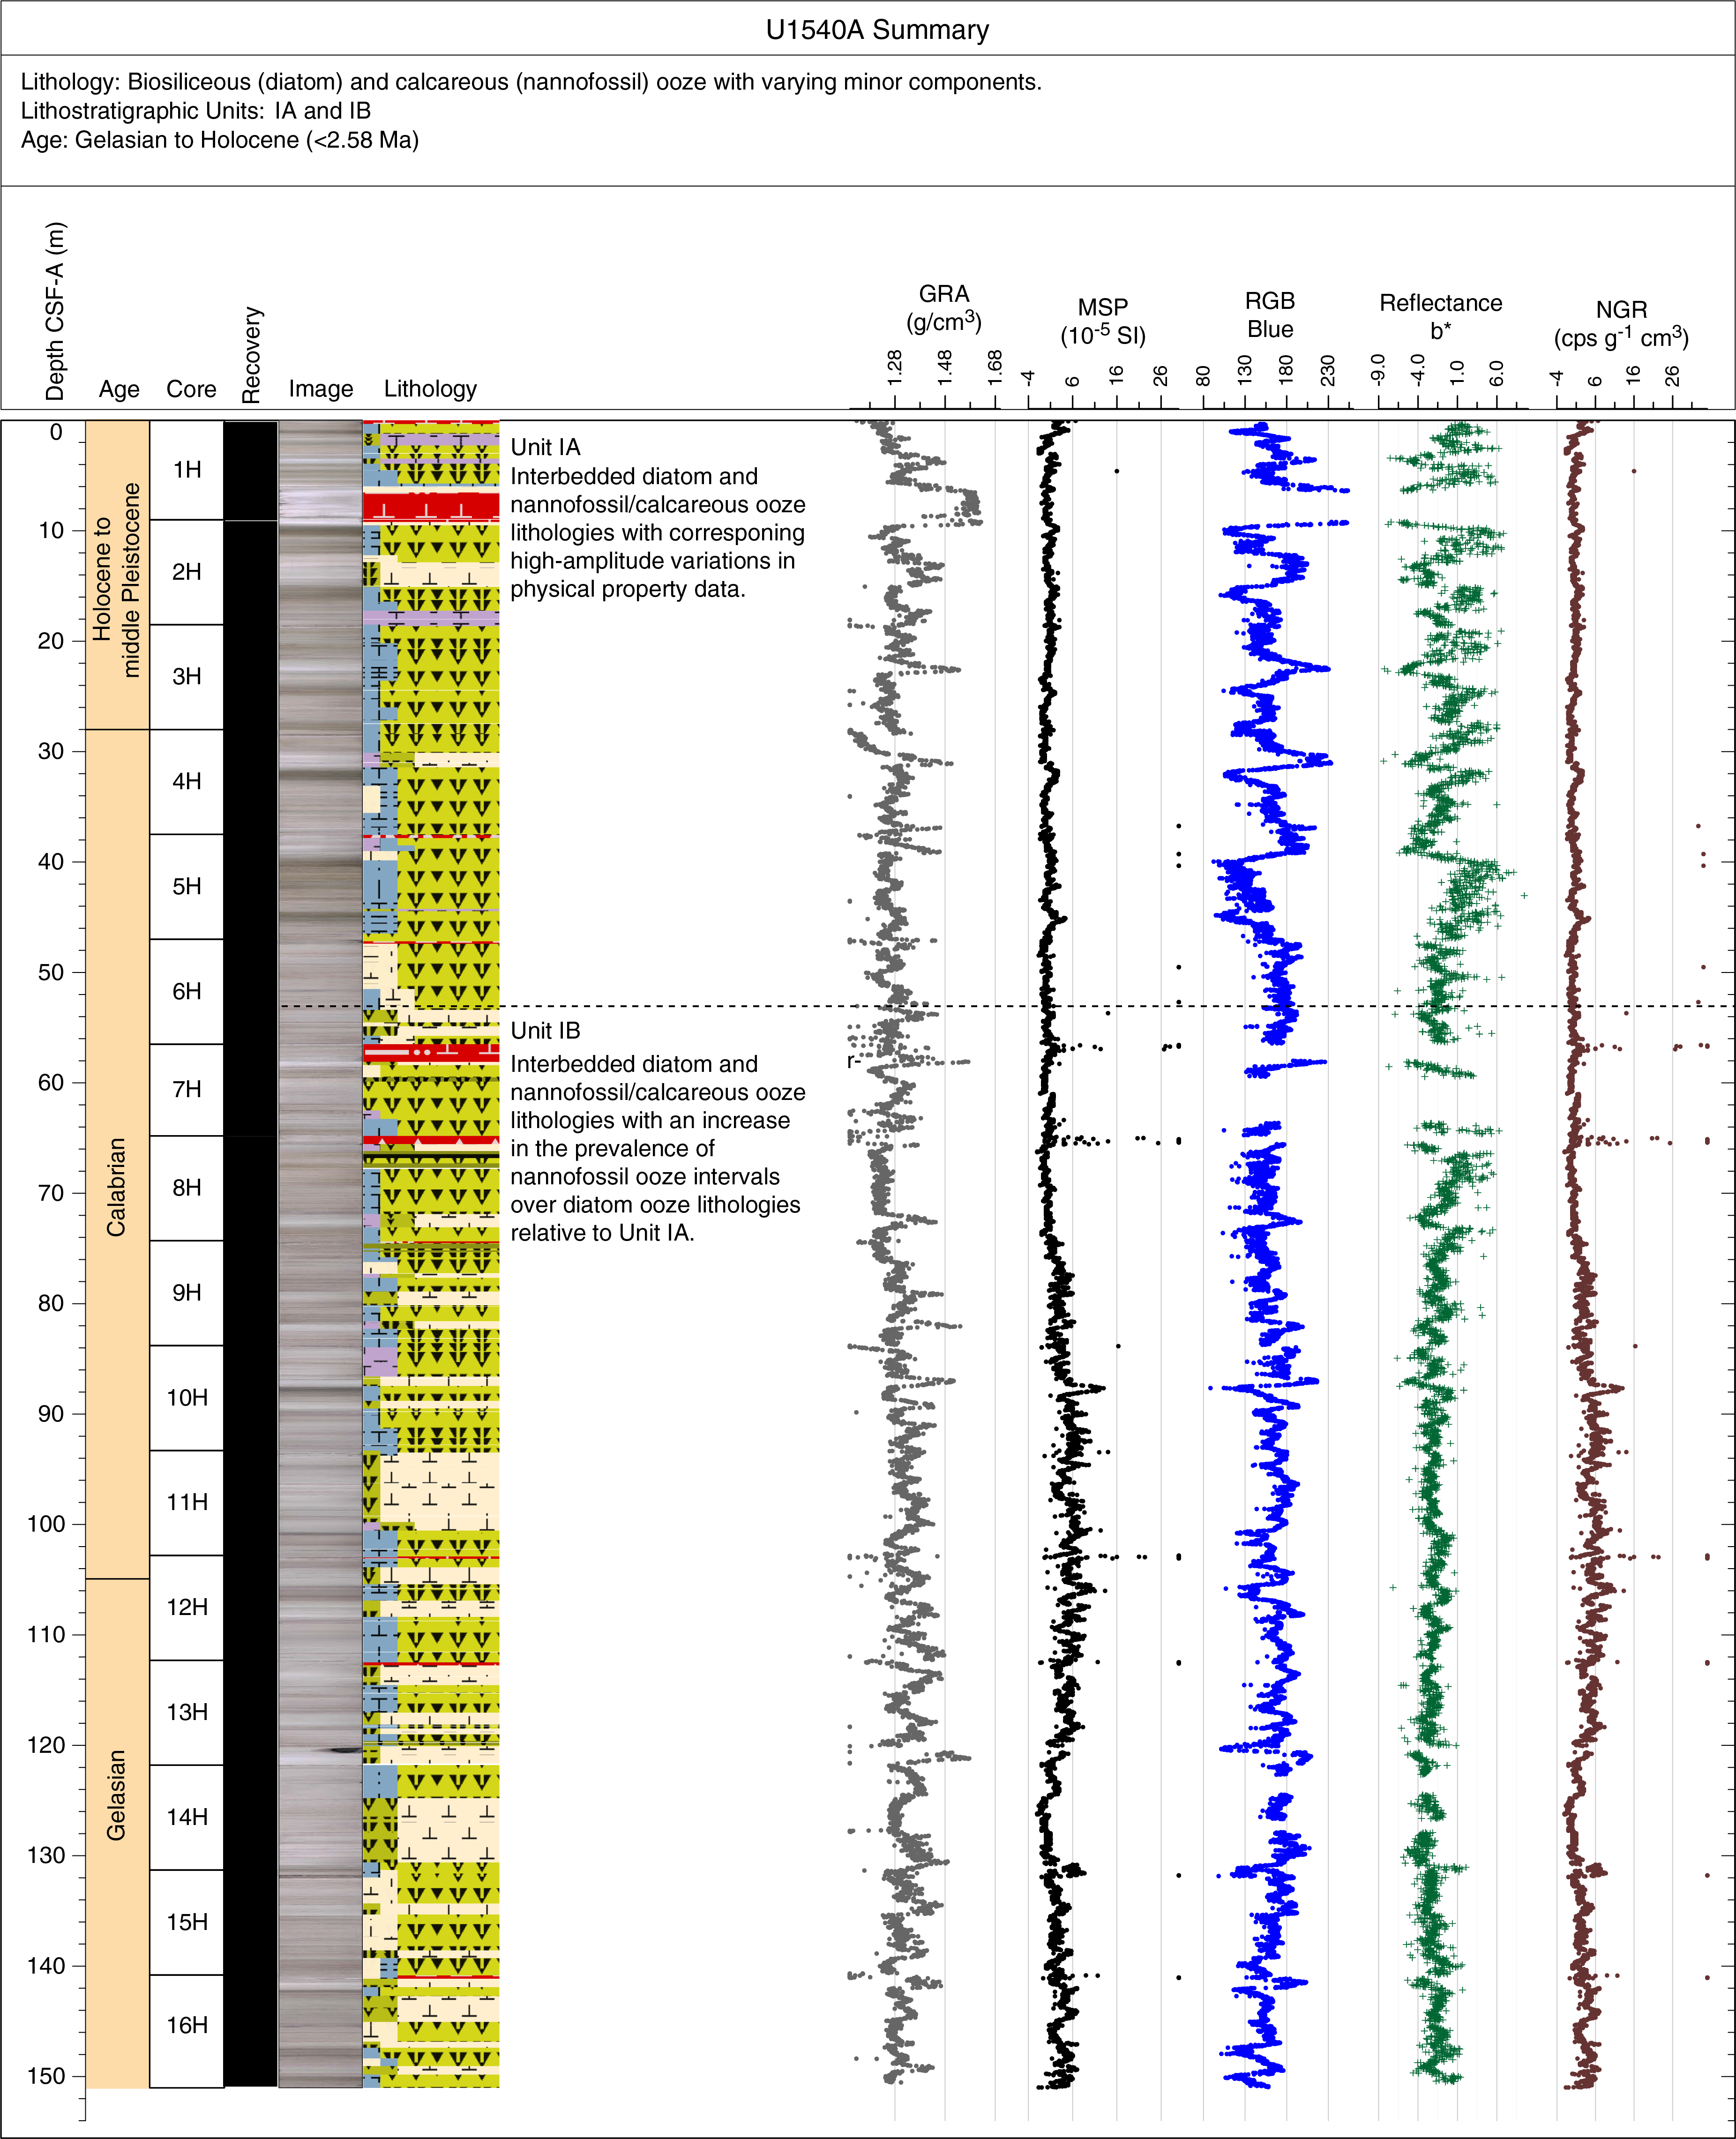
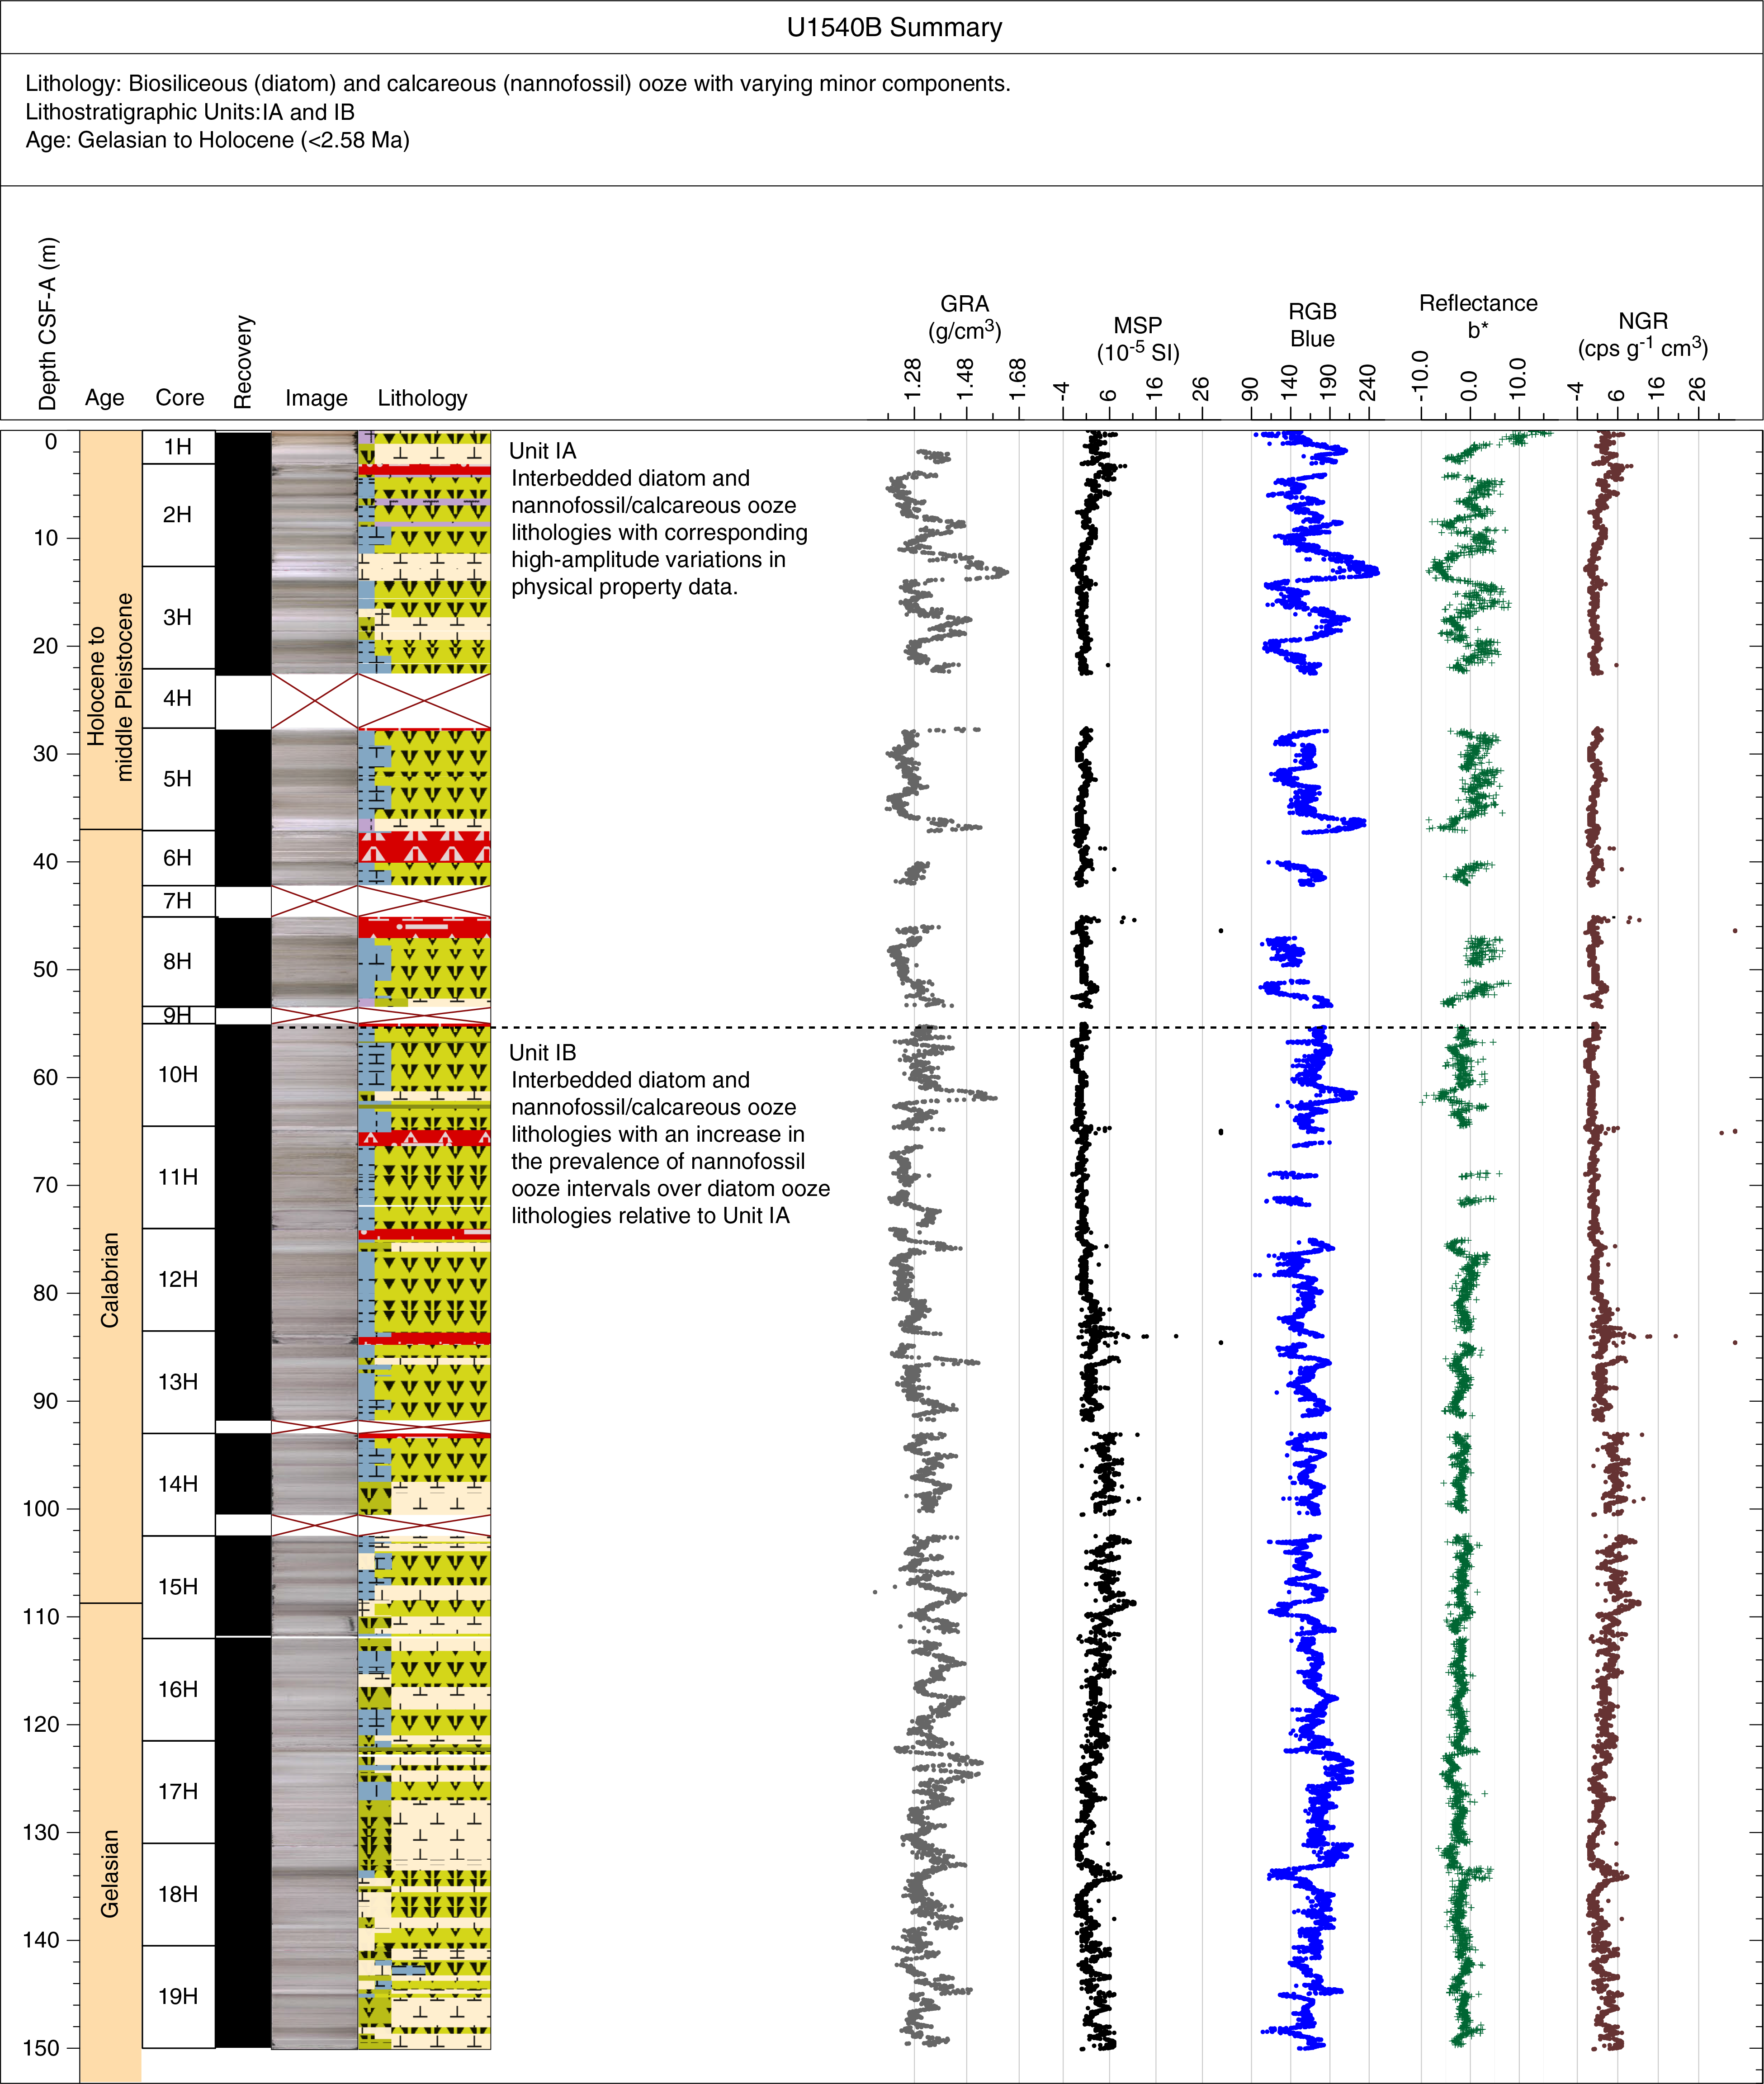

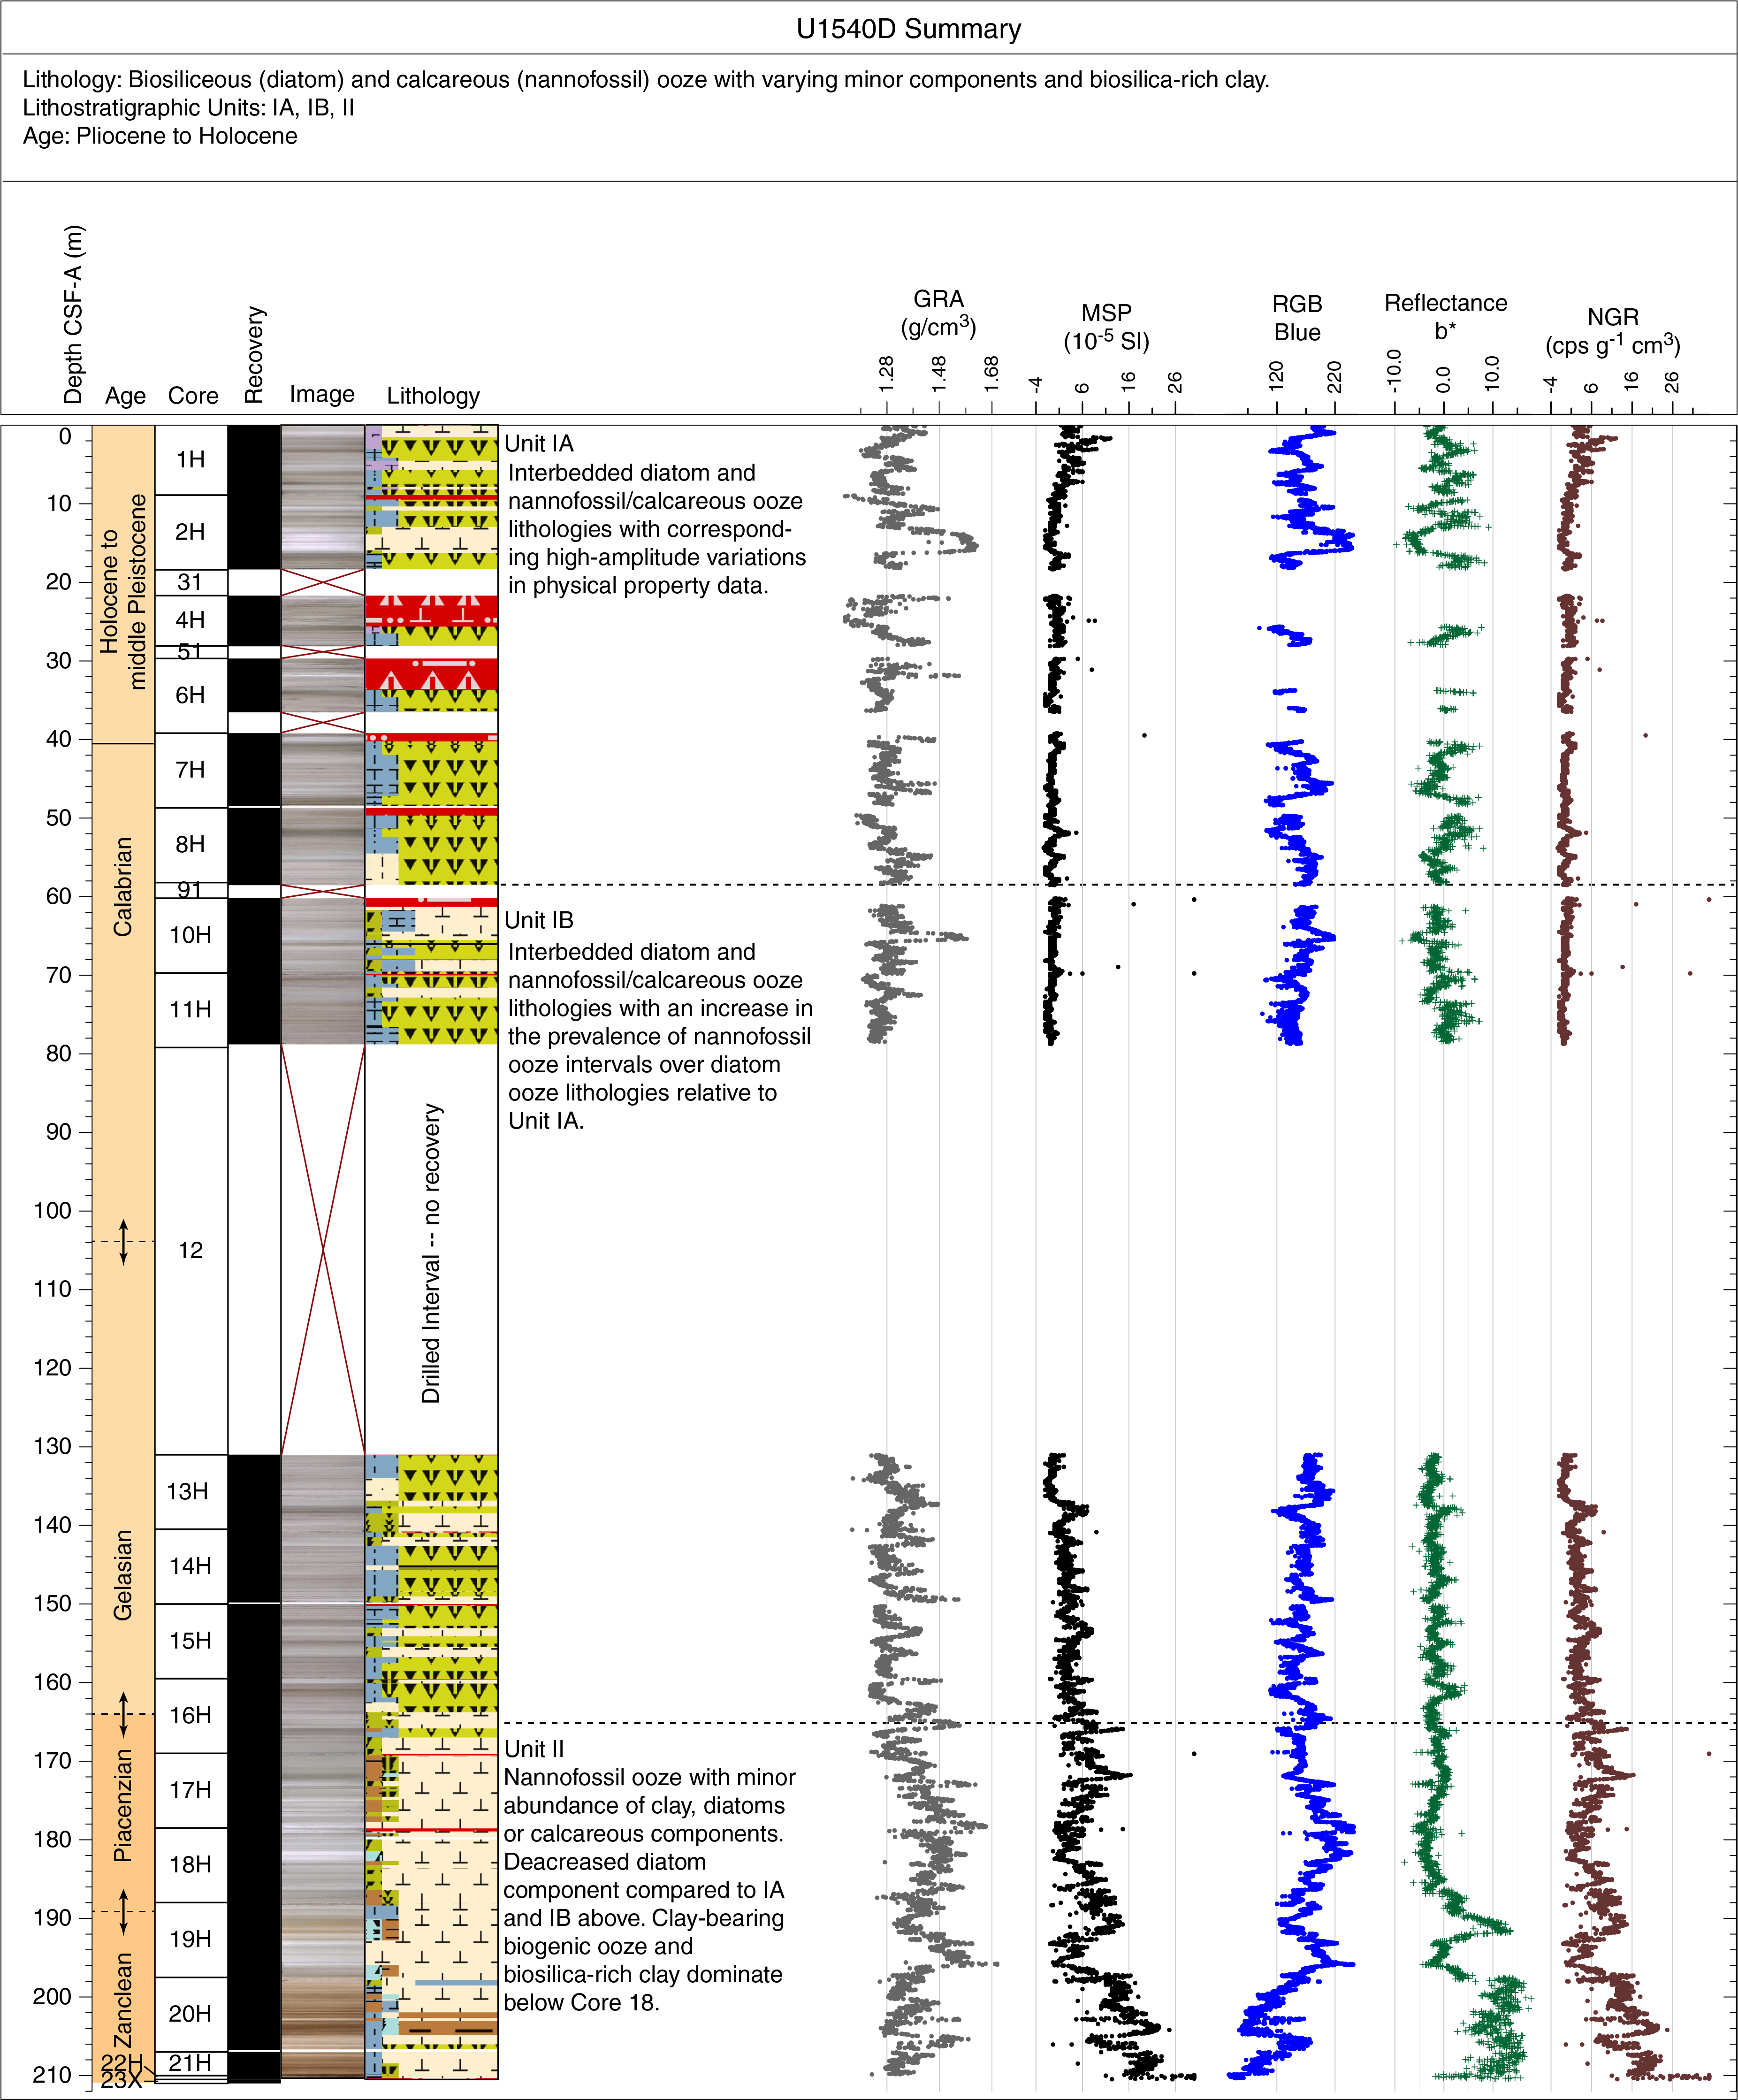
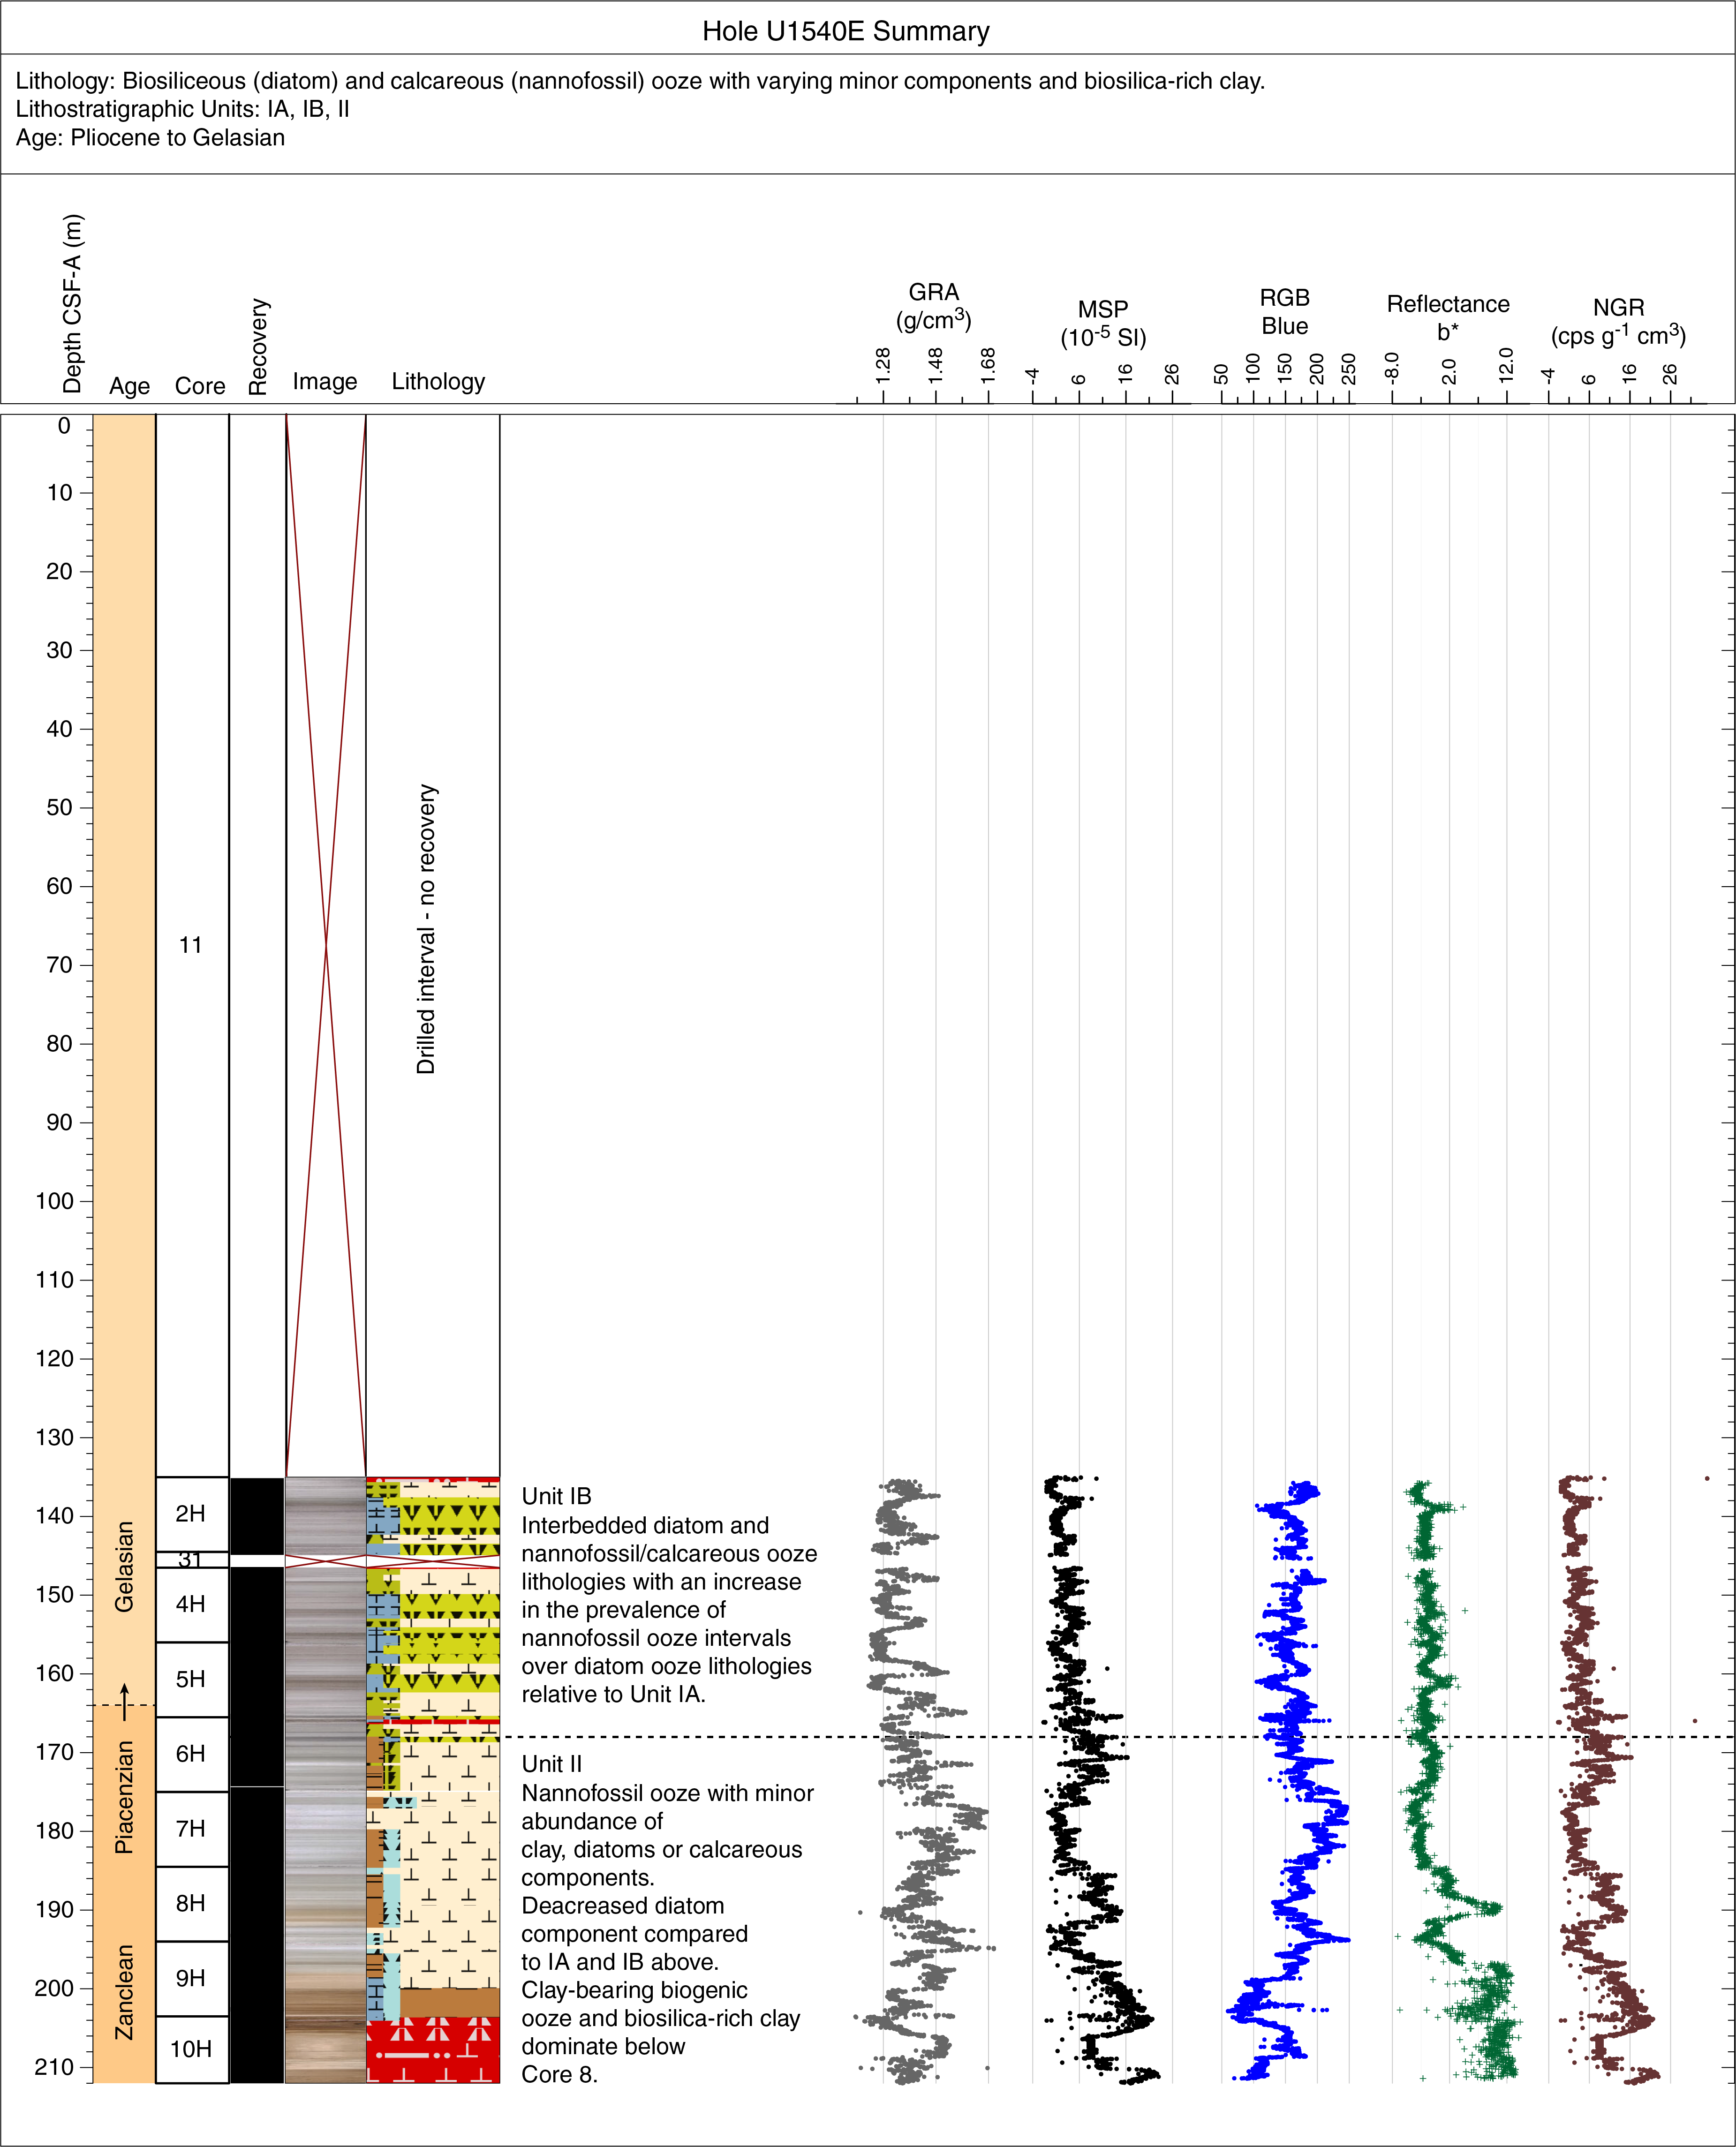
Figure F22. Hole summaries, Site U1540.
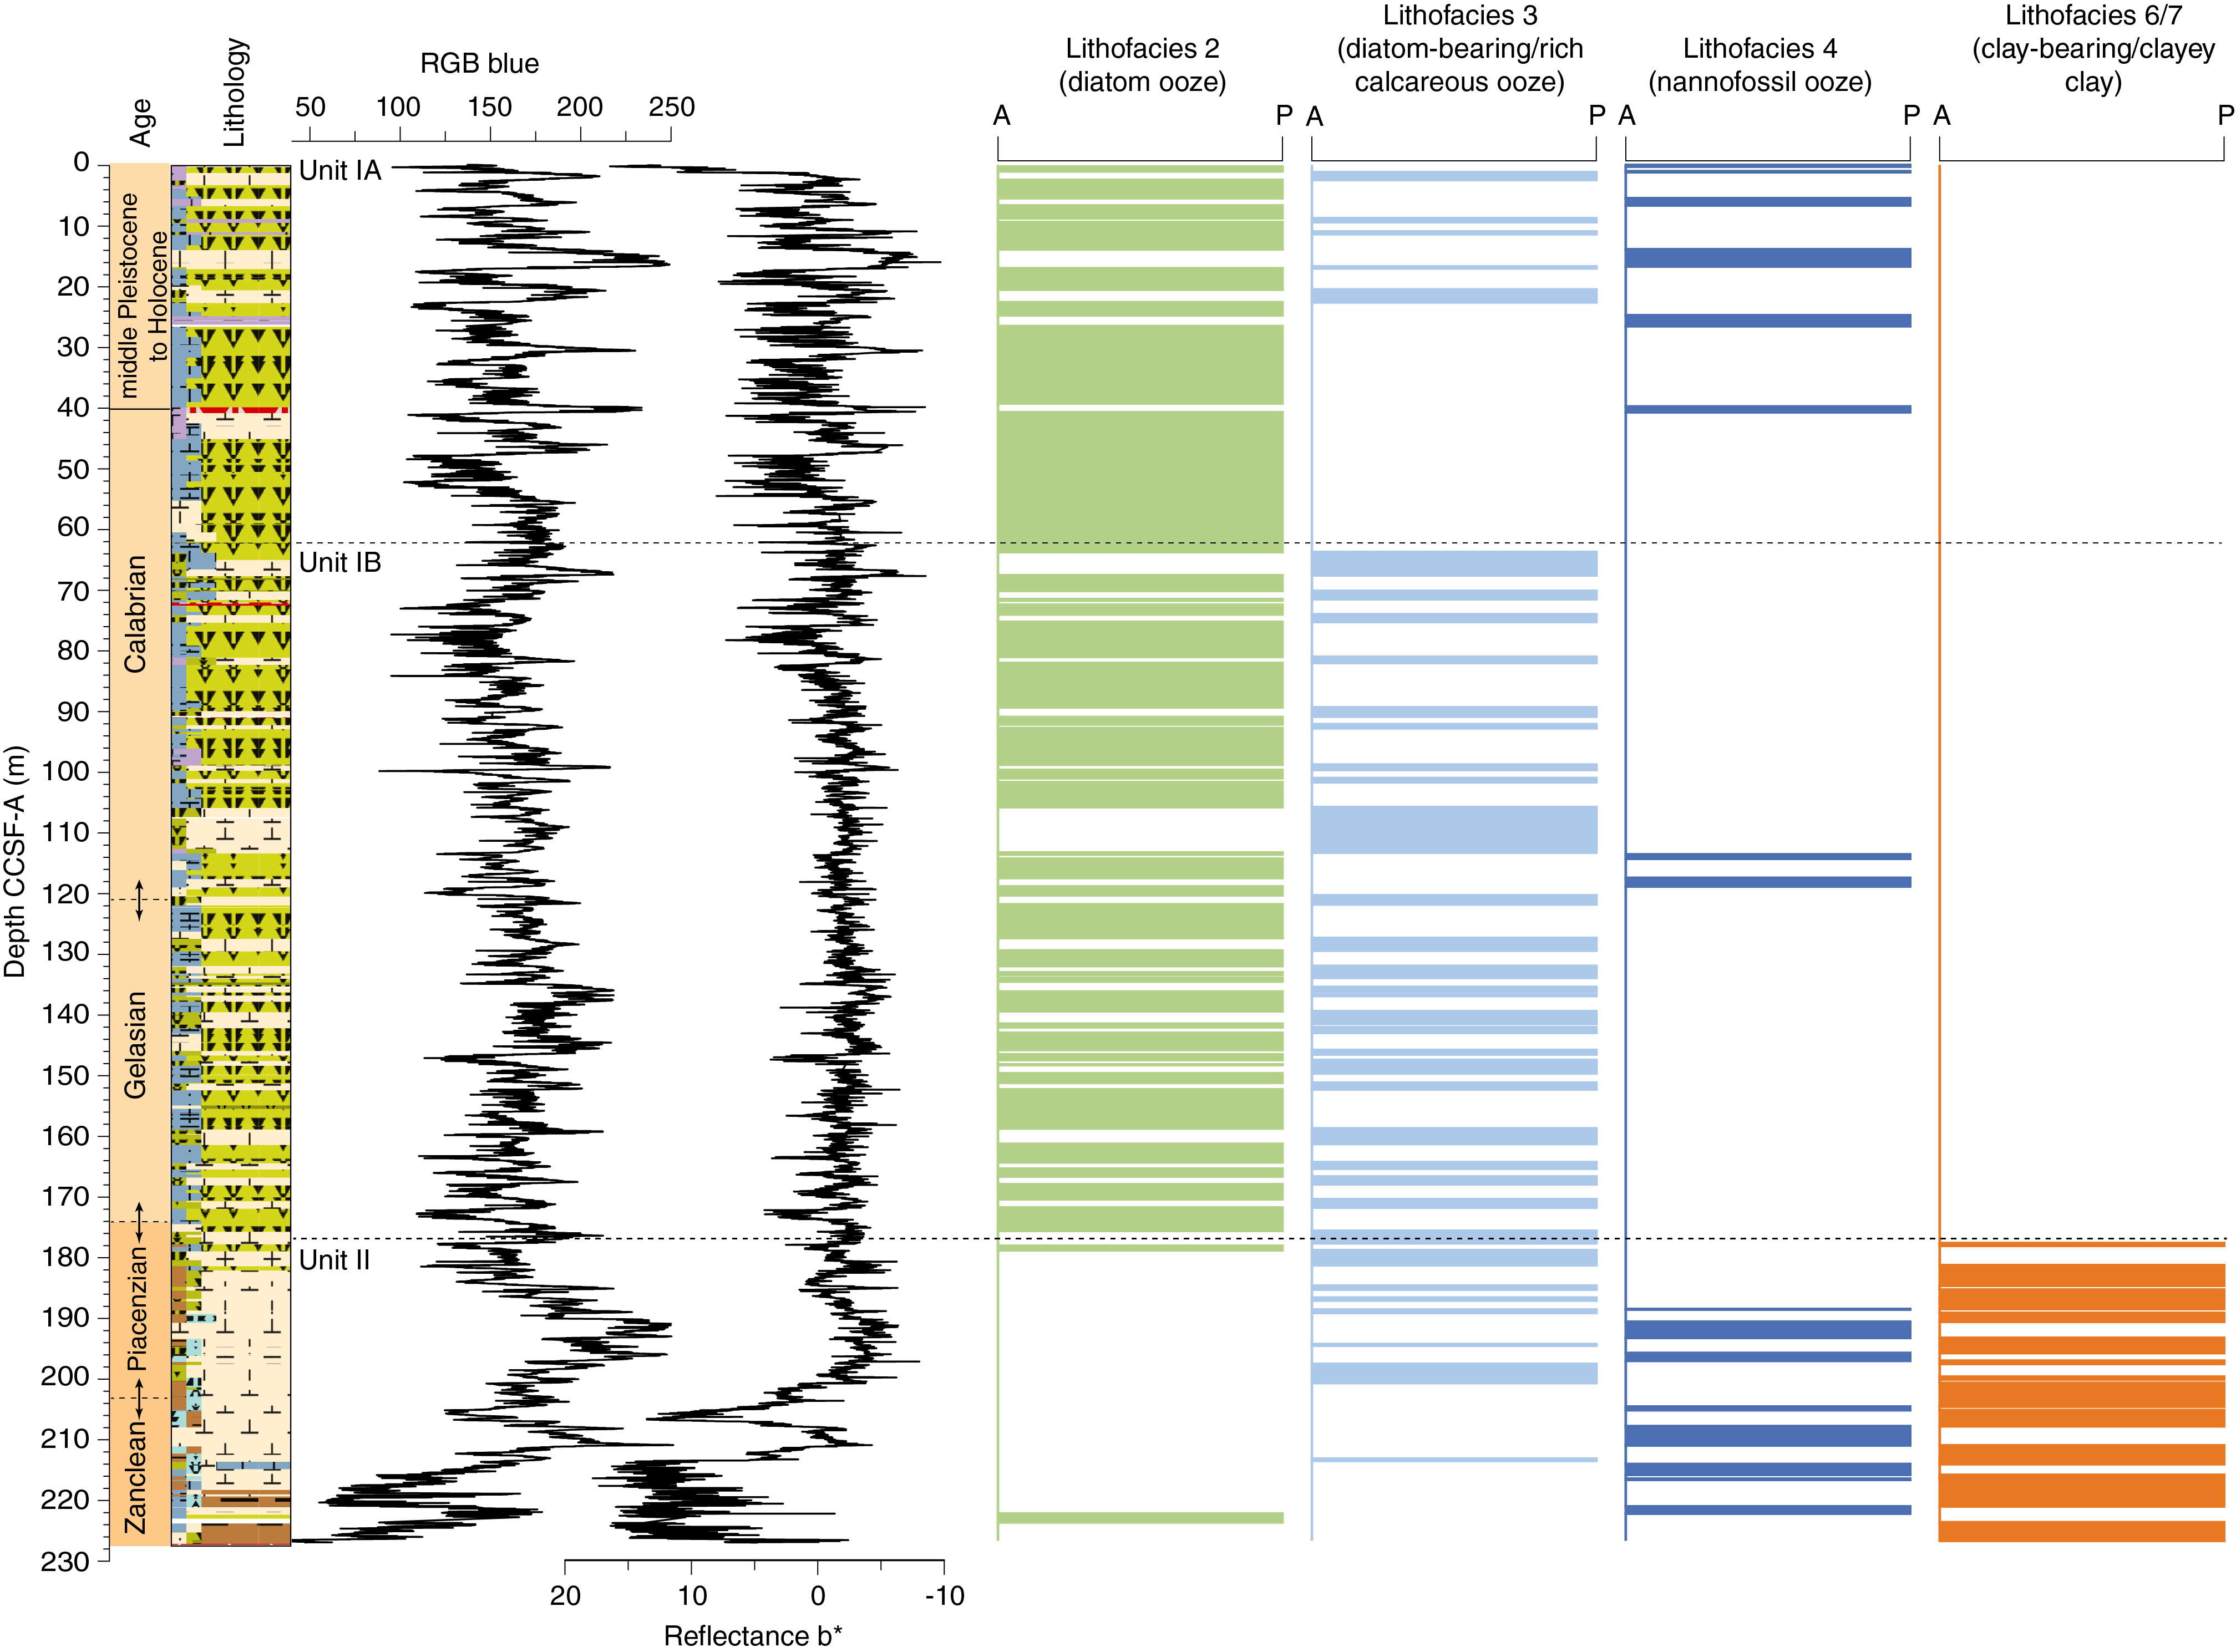
Figure F23. Primary lithostratigraphic variations, Site U1540.
Biostratigraphic age assignments are overall consistent with each other and are mainly derived from diatom, radiolarian, and calcareous nannofossil datums as well as planktonic foraminifer biozonations. None of the different biozonations record any major hiatuses, indicating that a continuous sediment sequence from the early Pliocene through the Holocene was recovered at this site. The core catcher sample of the deepest core from Hole U1540E (Core 10H) contained a few reworked taxa from the Miocene. However, the in situ microfossils present in this interval indicate a maximum early Pliocene age at the base of Site U1540.
Paleomagnetic measurements indicate a number of polarity changes that are best illustrated by downhole changes in inclination. The boundaries that define each polarity reversal are overall reasonably distinct. Prior to demagnetization, inclinations in the uppermost 40 m are dominantly positive, which is opposite to the expected inclination during the normal polarity Brunhes Chron. After demagnetization, inclinations become steeply negative and largely consistent with values expected for a geocentric axial dipole for the site’s location. Positive inclinations associated with reversed polarity of the Matuyama Chron were observed in Holes U1540A, U1540B, and U1540D. However, the Matuyama–Brunhes polarity transition is not definitively captured within any core other than possibly at the base of Core 383-U1540B-5H. Three normal polarity subchrons within the Matuyama Chron were observed. The upper polarity transition of the Jaramillo Subchron was observed at the base of Core 383-U1540D-8H and somewhat more noisily in Core 383-U1540A-6H, and the lower Jaramillo polarity transition from the Matuyama Chron was observed in Cores 383-U1540B-10H and 383-U1540D-10H. The upper polarity transition from the Olduvai Subchron (C2n) was observed in Core 383-U1540B-17H and somewhat more noisily in Core 383-U1540A-12H. The lower polarity transition from the Matuyama Chron was observed in Core 383-U1540B-16H and possibly the upper part of Core 383-U1540A-13H. The normal polarity Reunion Subchron is recognized in all cored holes with varying fidelity. Below ~180 m CCSF-A, polarity becomes more difficult to interpret because well-defined intervals of both polarities were observed on a decimeter scale.
We analyzed samples for headspace gas, interstitial water chemistry, and bulk sediment chemistry at a resolution of three samples per core from 0 to 120 m CSF-A, two per core from 120 to 150 m CSF-A, and one per core from 150 m CSF-A to the bottom of the hole (Cores 383-U1540A-1H through 16H, 383-U1540B-2H, and 383-U1540D-15H through 21H). Methane concentrations are very low at this site overall, ranging from 6 to 2 ppm with an average content of 4 ppm. Ethane and propane remained below detection limit throughout the entire hole.
Above ~134 m CSF-A (Holes U1540A and U1540B), alkalinity and pH show no obvious trends, varying around averages of 3.4 ± 0.5 mM and 7.96 ± 0.07, respectively. Below this depth, alkalinity and pH exhibit almost identical behavior, first increasing to a local peak at ~157 m CSF-A and then decreasing steadily to the bottom of Hole U1540D.
The composite carbonate record at Site U1540 shows downhole variability ranging from 6 to 93.5 wt% and a strong correlation with RGB blue and reflectance L* (Figure F24) and GRA bulk density measurements. TOC content has a mean value of 0.36 wt% and a standard deviation of 0.13 across the entire cored interval. TOC values range from 0.75 wt% at 20.63 m CSF-A in Hole U1540A to 0.13 wt% at 204.4 m CSF-A in Hole U1540D. The TOC record shows no correlation to the CaCO3 record (r2 = 0.004) downhole.
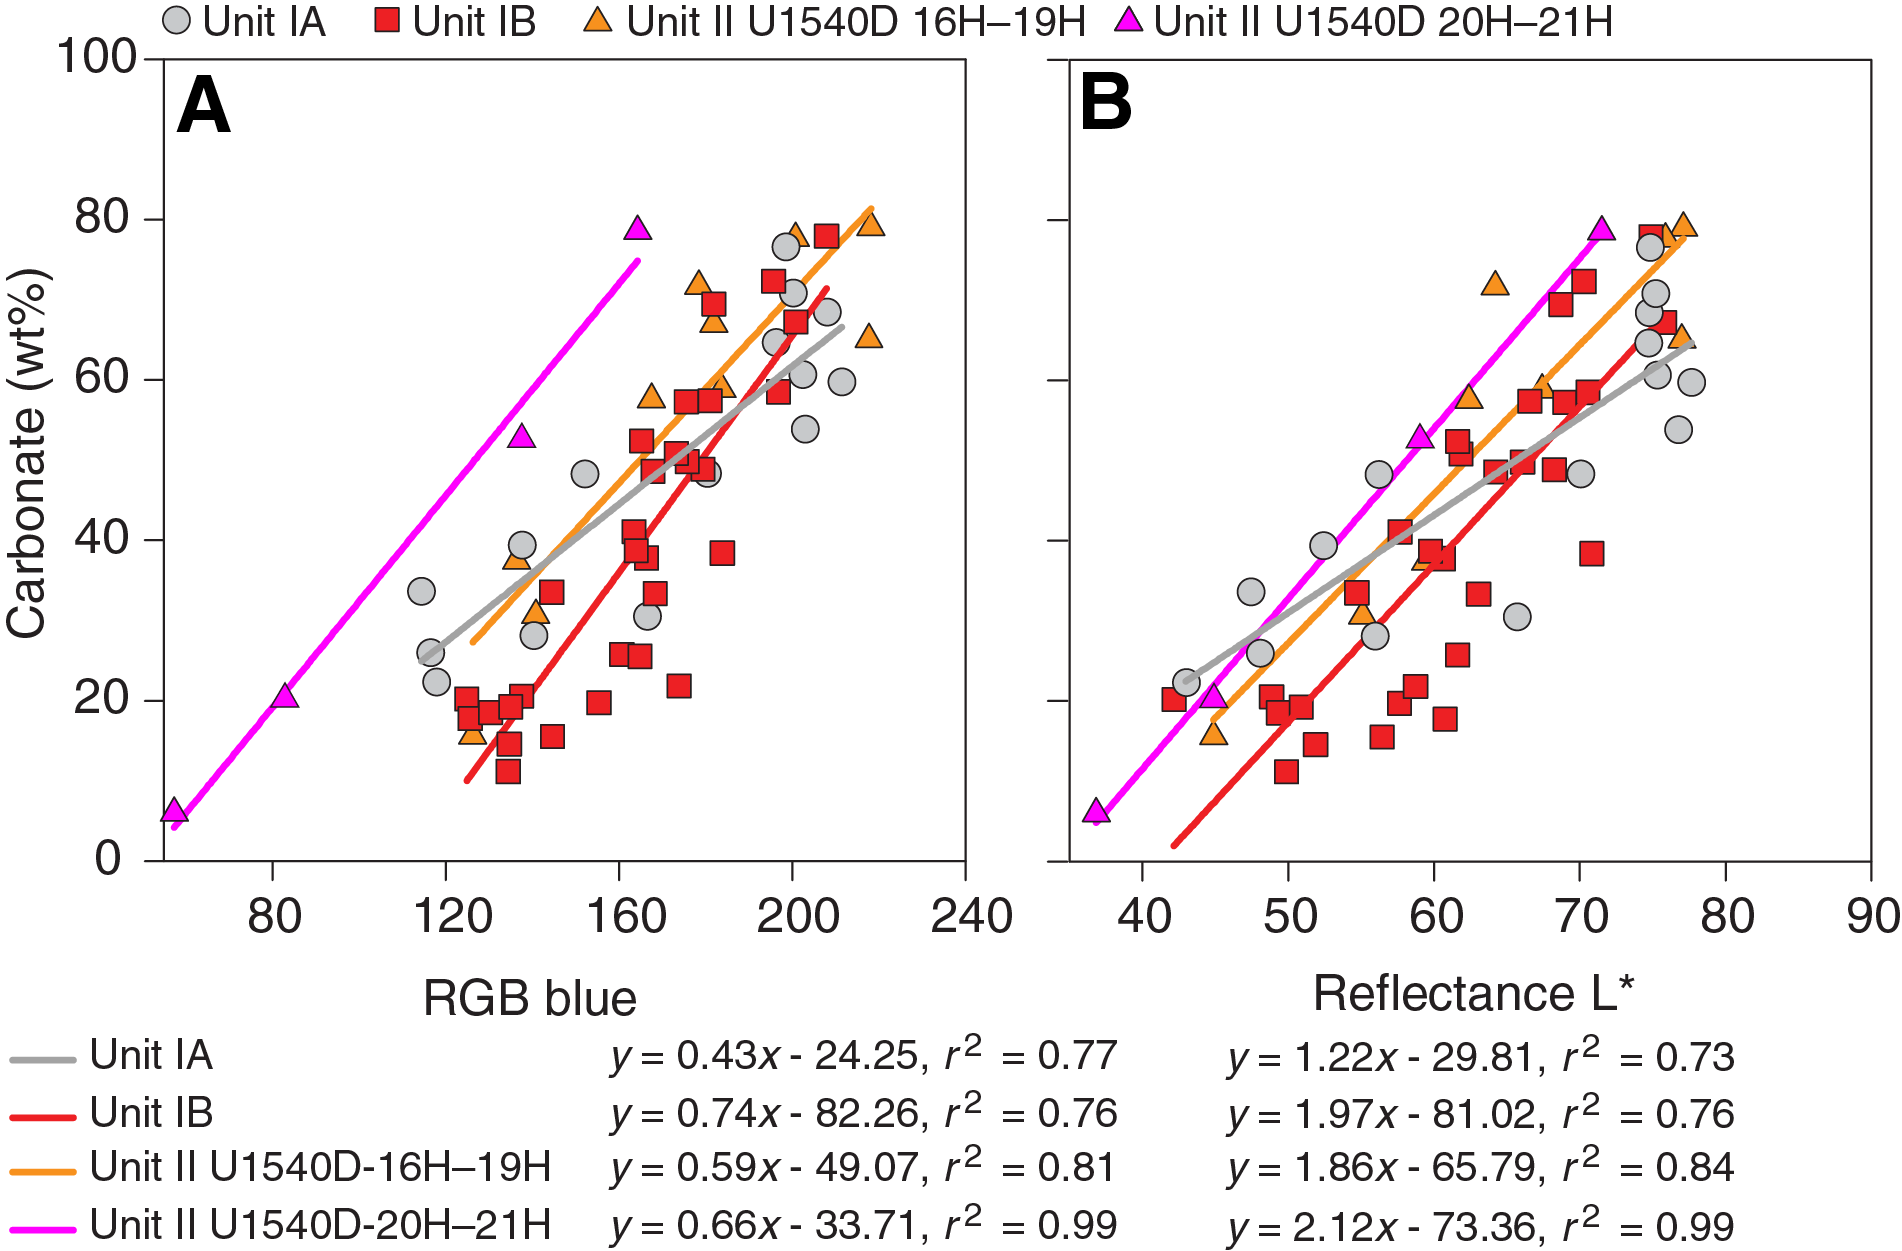
Figure F24. Bulk sedimentary carbonate content, RGB blue, and L*, Holes U1540A, U1540B, and U1540D.
Physical property measurements at Site U1540 include nondestructive whole-round measurements of GRA bulk density, MS, WRMSL P-wave velocity, and NGR on core sections from Holes U1540A–U1540E. Additional physical properties collected include thermal conductivity on whole-round cores from all holes. Data acquired from whole-round measurements are generally in good agreement with those from split-core measurements and discrete samples. In particular, discrete moisture and density and GRA bulk densities correlate well, and GRA bulk density is also well correlated to discrete carbonate measurements from the different holes. Major bulk density peaks, which correspond to the lowest P-wave velocities, correlate with high-carbonate nannofossil content. Higher GRA densities reflect the nannofossil-rich facies and correspond to lower P-wave velocity and lower porosity. The older part of the record at the site, from 185 m CCSF-A to the bottom, shows a clear inverse correlation of MS and GRA bulk density, indicating that the oldest sediments are mainly composed of only two components, nannofossils and clay. NGR data also imply that total counts and the derived potassium content can be used as a semiquantitative proxy for the abundance of terrigenous material delivered by dust or sea ice and iceberg transport. Downhole changes in physical property characteristics overall are thus in good agreement with the identified lithostratigraphic units based on sedimentologic characteristics (Figure F25). Comparison of the different physical properties allows the discrimination of intervals consisting of mainly two components from intervals consisting of three or more components and could help provide a more quantitative determination of the sediment composition.
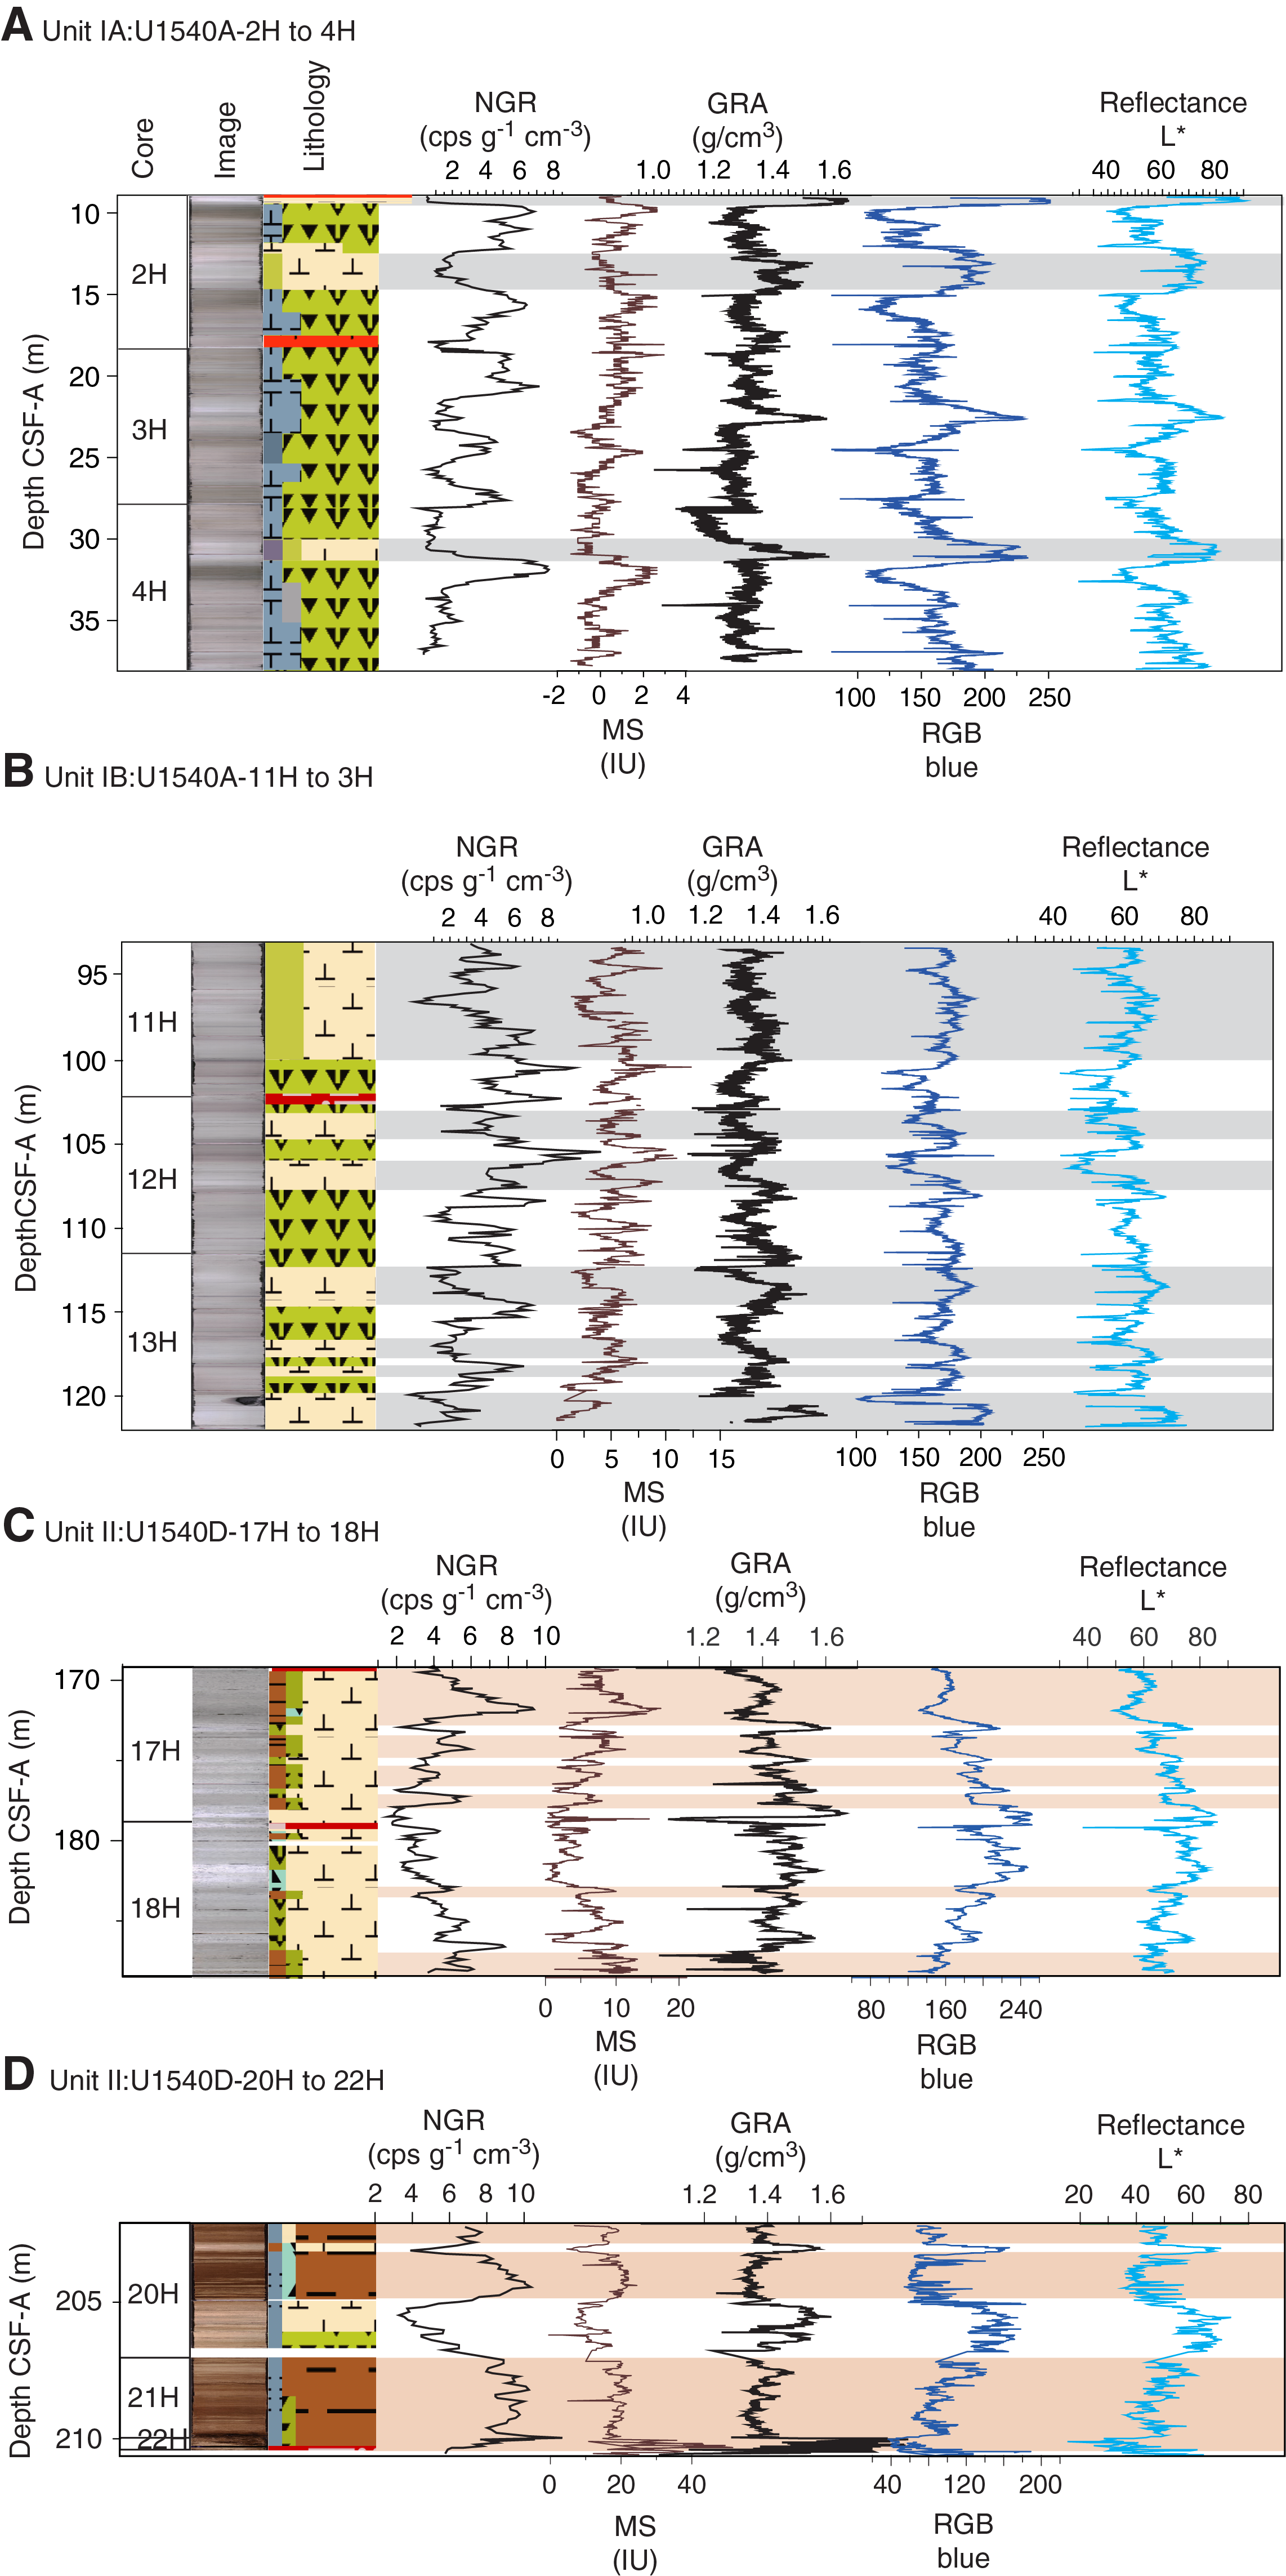
Figure F25. Physical properties, Holes U1540A and U1540D.
Correlations between holes were accomplished using the Correlator software (version 3.0). Tie points were established mostly using the RGB blue channel extracted from the Section Half Imaging Logger (SHIL) digital images, but in many cases a combination of measurements was used. We constructed a splice from 0 to 222.95 m CCSF-A using four holes (U1540A, U1540B, U1540D, and U1540E). However, because some misfired cores that were disturbed could not be used, the splice contains two gaps. The deepest cores of Holes U1540D and U1540E, 383-U1540D-22H and 23X and 383-U1540E-10H, were excluded from the spliced interval because of poor recovery and high levels of drilling disturbance.
We constructed a preliminary age model based on biostratigraphic and paleomagnetic age markers. These data suggest that the sedimentary sequence recovered at Site U1540 covers the past ~4.8 My (Figure F26). Though substantially lower than at Site U1539, sedimentation rates at Site U1540 are remarkably high for a pelagic setting. Below a condensed shallow section downhole to ~0.3 Ma, sedimentation rates average 7.5 cm/ky downhole to ~2.7 Ma and decrease to ~1.5 cm/ky during most of the Pliocene (2.7–4.8 Ma). This age model is generally consistent with preliminary stratigraphic tuning performed on board based on physical property data such as color measurements (RGB blue) and GRA bulk density.
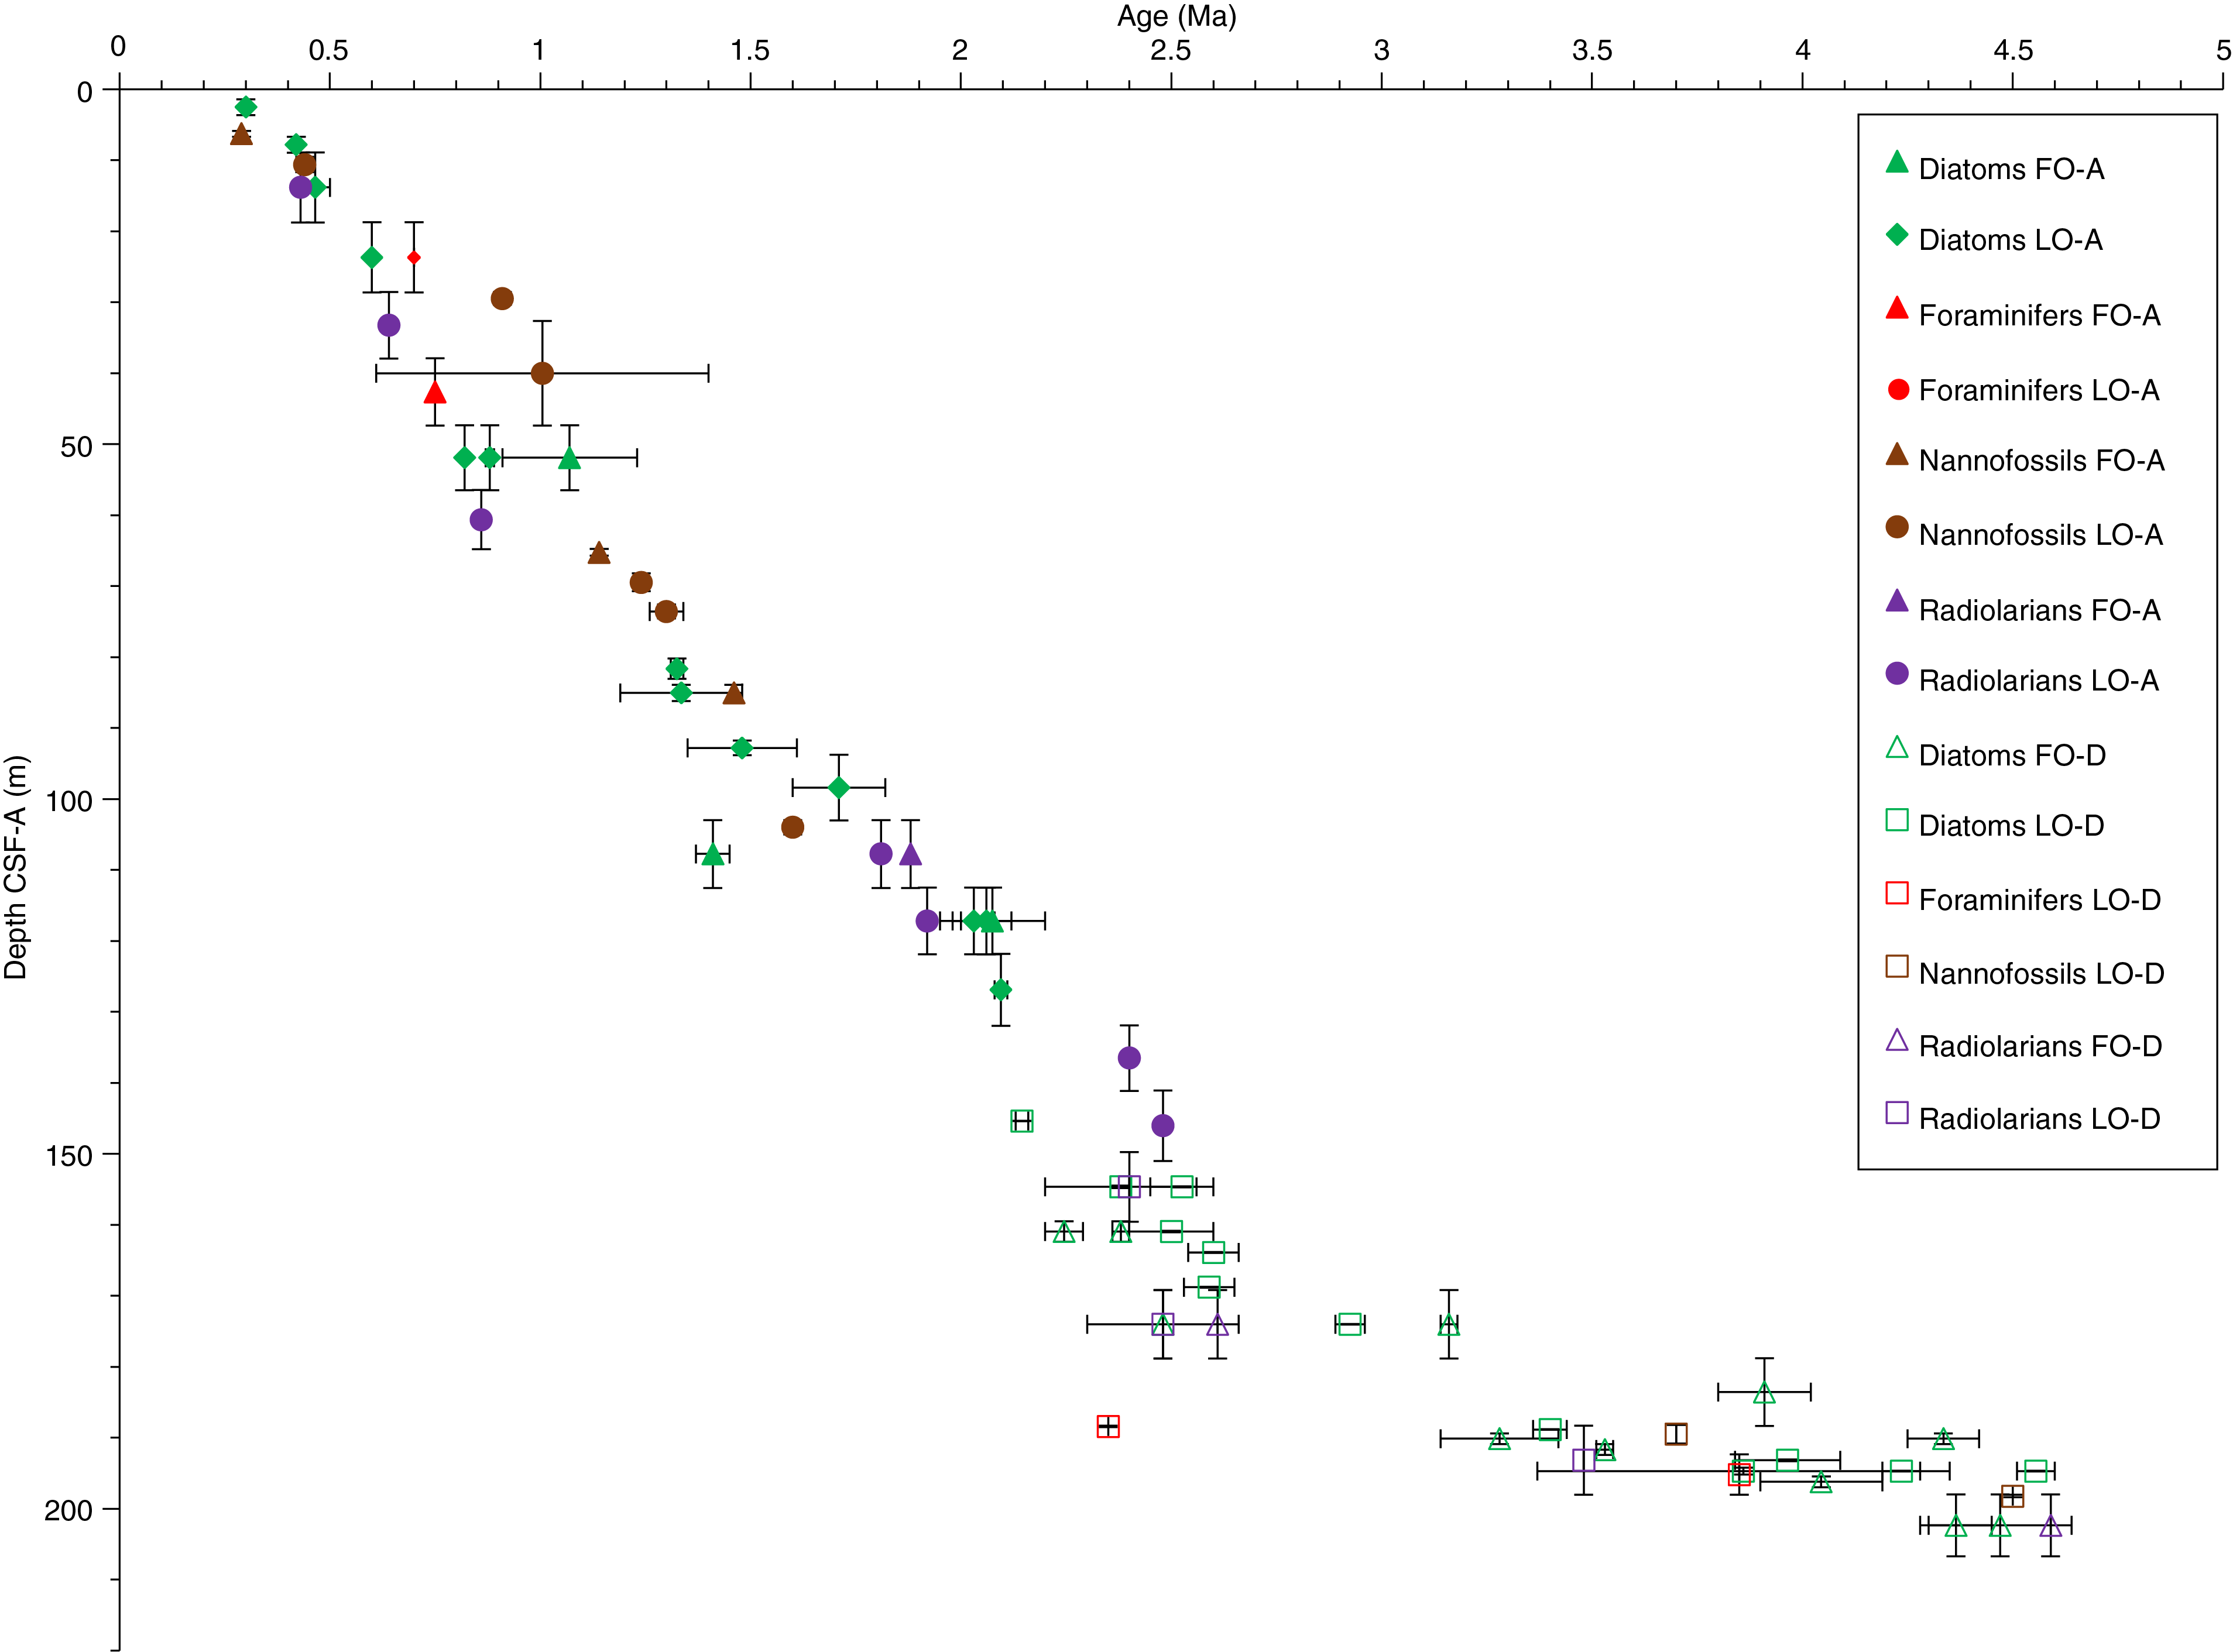
Figure F26. Preliminary age model, Site U1540.
The combination of nearly continuous recovery, very high sedimentation rates driven by high diatom productivity during glacial periods and potential sediment focusing, clear patterns in physical properties and sediment color, and a rich array of well-preserved diatoms combined with calcareous microfossils will provide unprecedented opportunities for improving our understanding of the dynamics of the ACC and its link to global carbon cycle changes at orbital and suborbital timescales.
Site U1541
Background and objectives
Site U1541 (Proposed Site CSP-1A) is located in the CSP at 54°12.756ʹS, 125°25.540ʹW, ~1830 nmi west of the Strait of Magellan, at 3604 m water depth (Figure F27). The site sits at the western flank of the southernmost EPR, ~50 nmi north of the Tharp Fracture Zone and ~160 nmi west of the modern seafloor spreading axis, and is underlain by oceanic crust formed at the EPR at ~6–8 Ma (Eagles, 2006). Assuming overall constant seafloor half spreading rates of ~4.5 cm/y (Pitman and Heirtzler, 1966), the plate tectonic backtrack path of Site U1541 moves the site eastward, placing it ~100 nmi closer to the crest of the EPR at a water depth shallower by several hundred meters in the early Pliocene. At a smaller scale, the site is located in a ~4 nmi wide trough oriented NNE–SSW, parallel to the orientation of the EPR. The adjacent ridges rise to ~3400 m water depth southeast of the site and to ~3500 m water depth to the northwest (Figure F27).
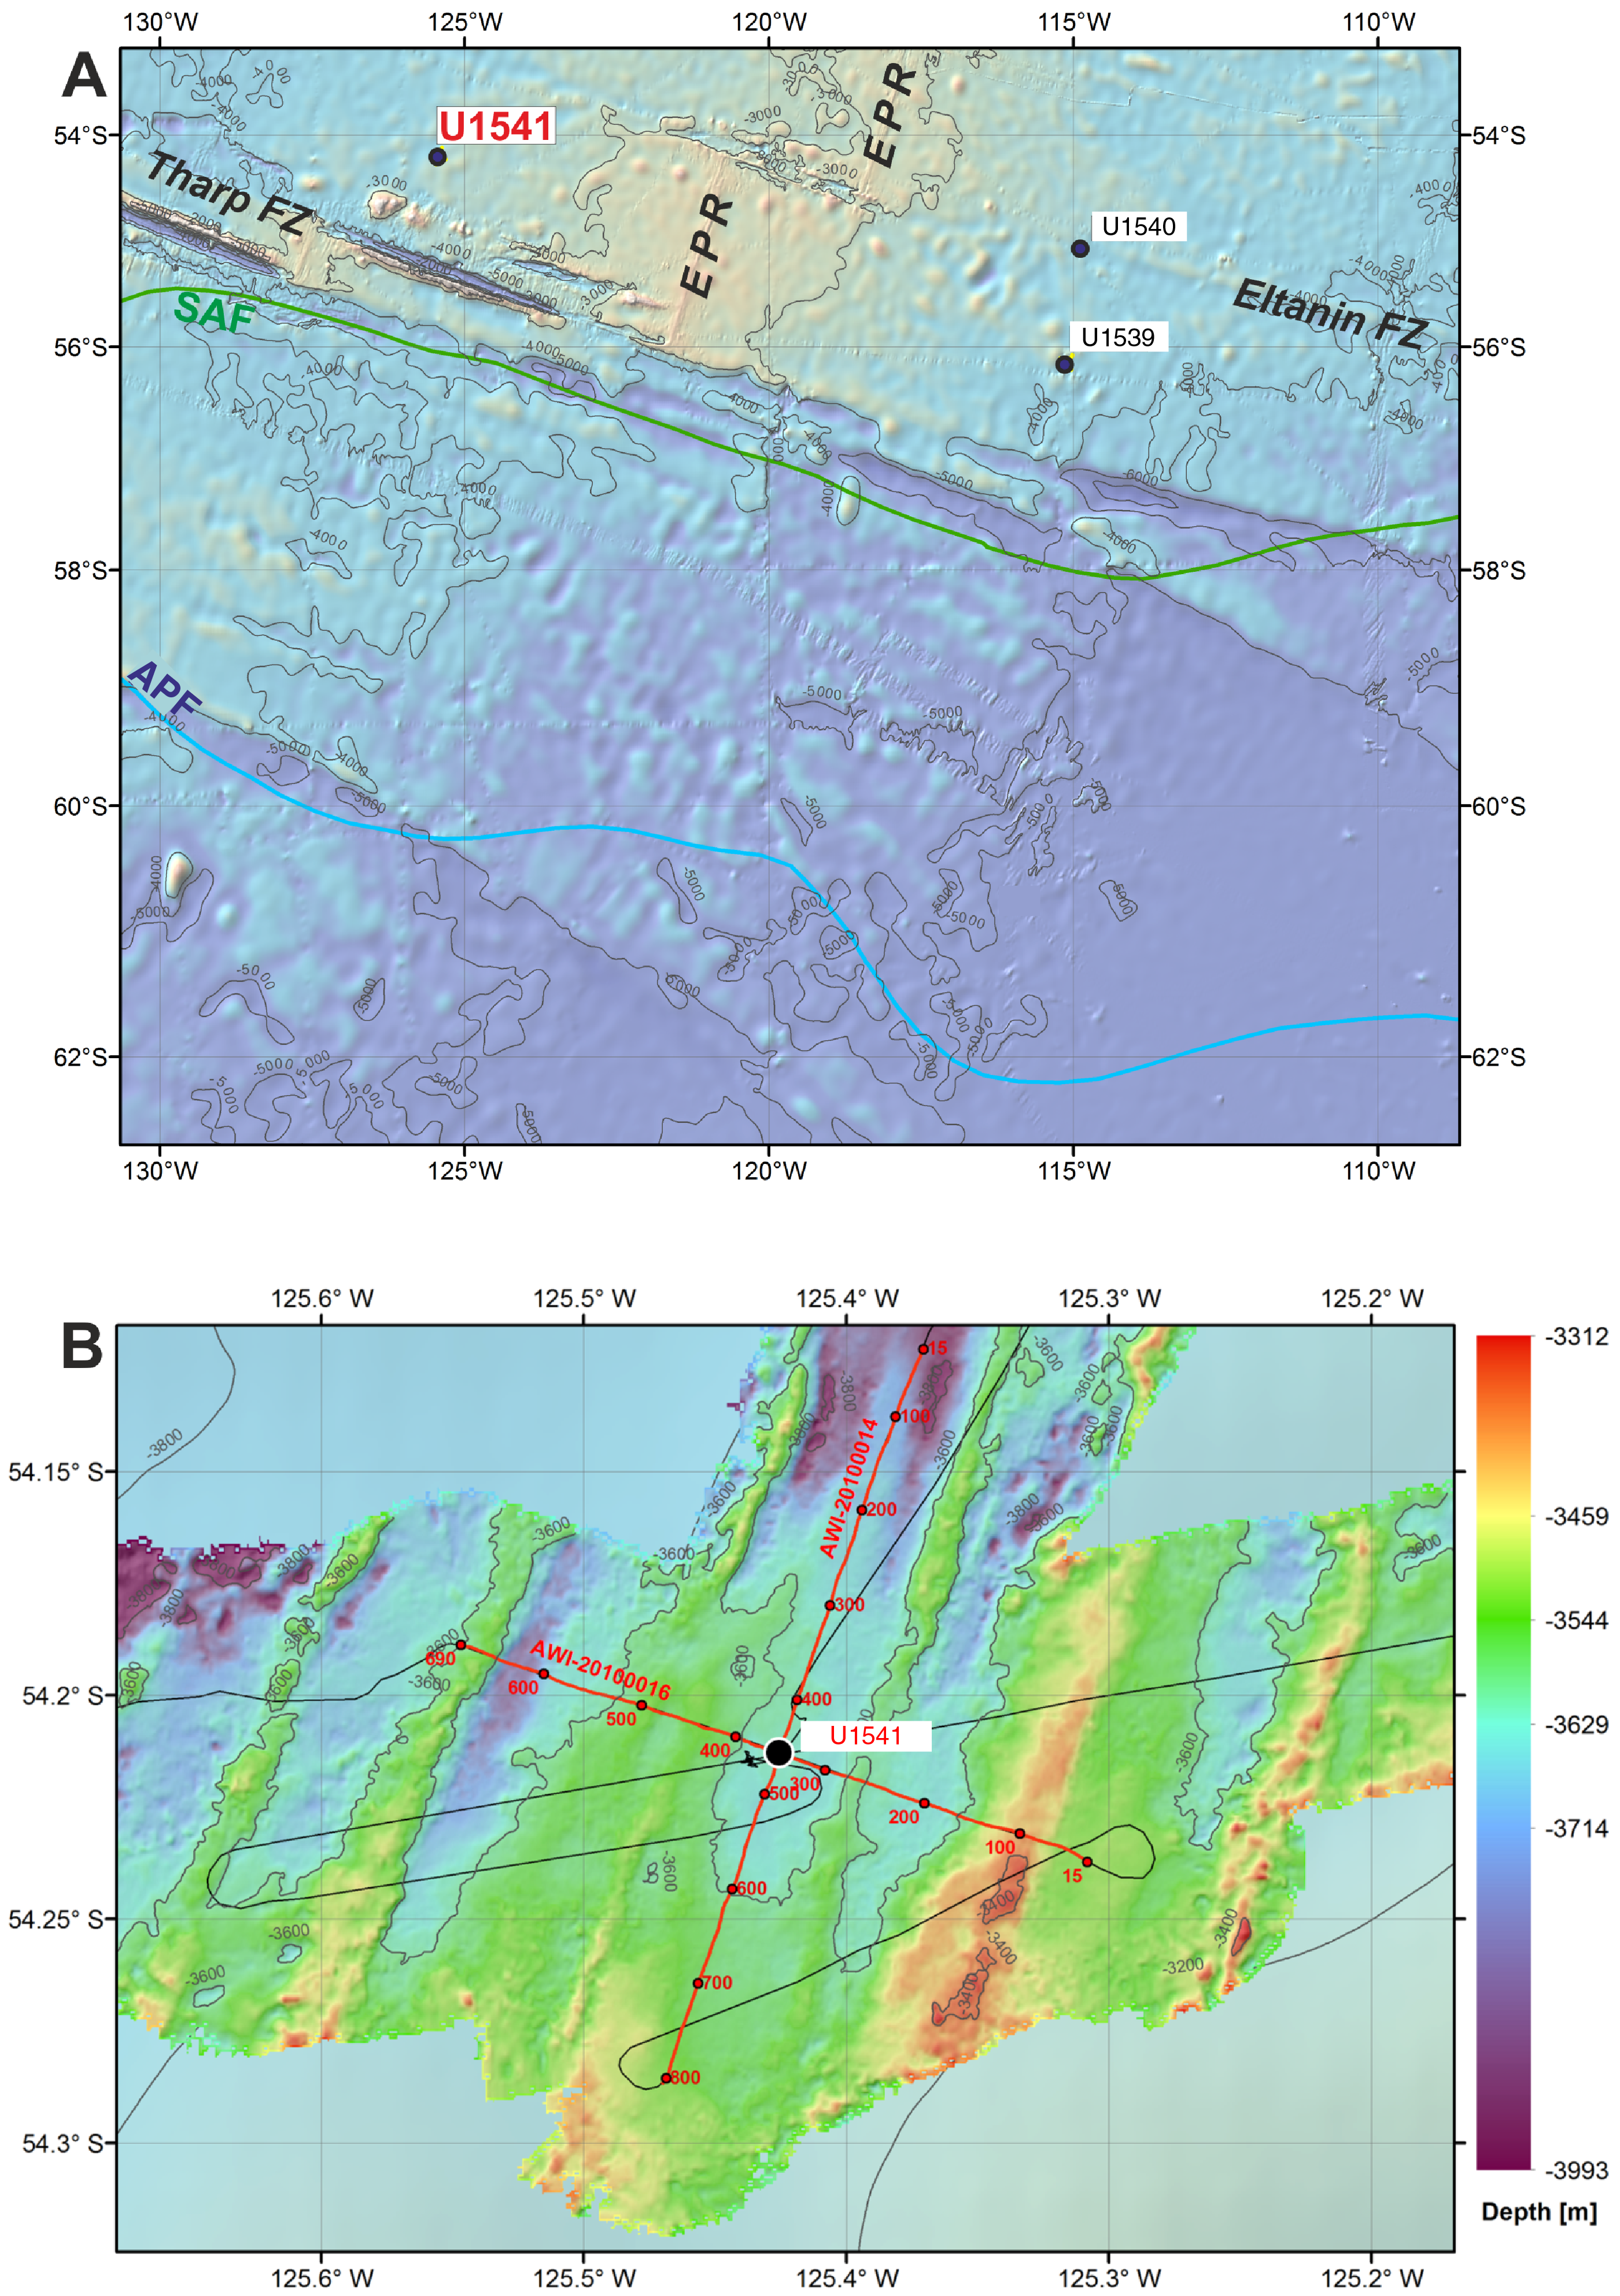
Figure F27. Oceanographic and bathymetric setting, Site U1541.
Site U1541 is located on MCS Line AWI-201000014 at the intersection with Line AWI-2010000016 (Figure F28A) (Gersonde, 2011). The seismic cross-lines indicate ~180 m thick sediments above oceanic basement. Sediments are mostly well stratified with flat lying, slightly irregular reflectors. Low to moderately reflecting layers become stronger below ~120–140 m CSF-A. Sediment echo sound (Parasound) profiles (Gersonde, 2011) indicate moderate penetration (~80 m) with distinct layering (Figure F28B), suggesting a succession of fine-grained soft sediments with varying lithologic composition.
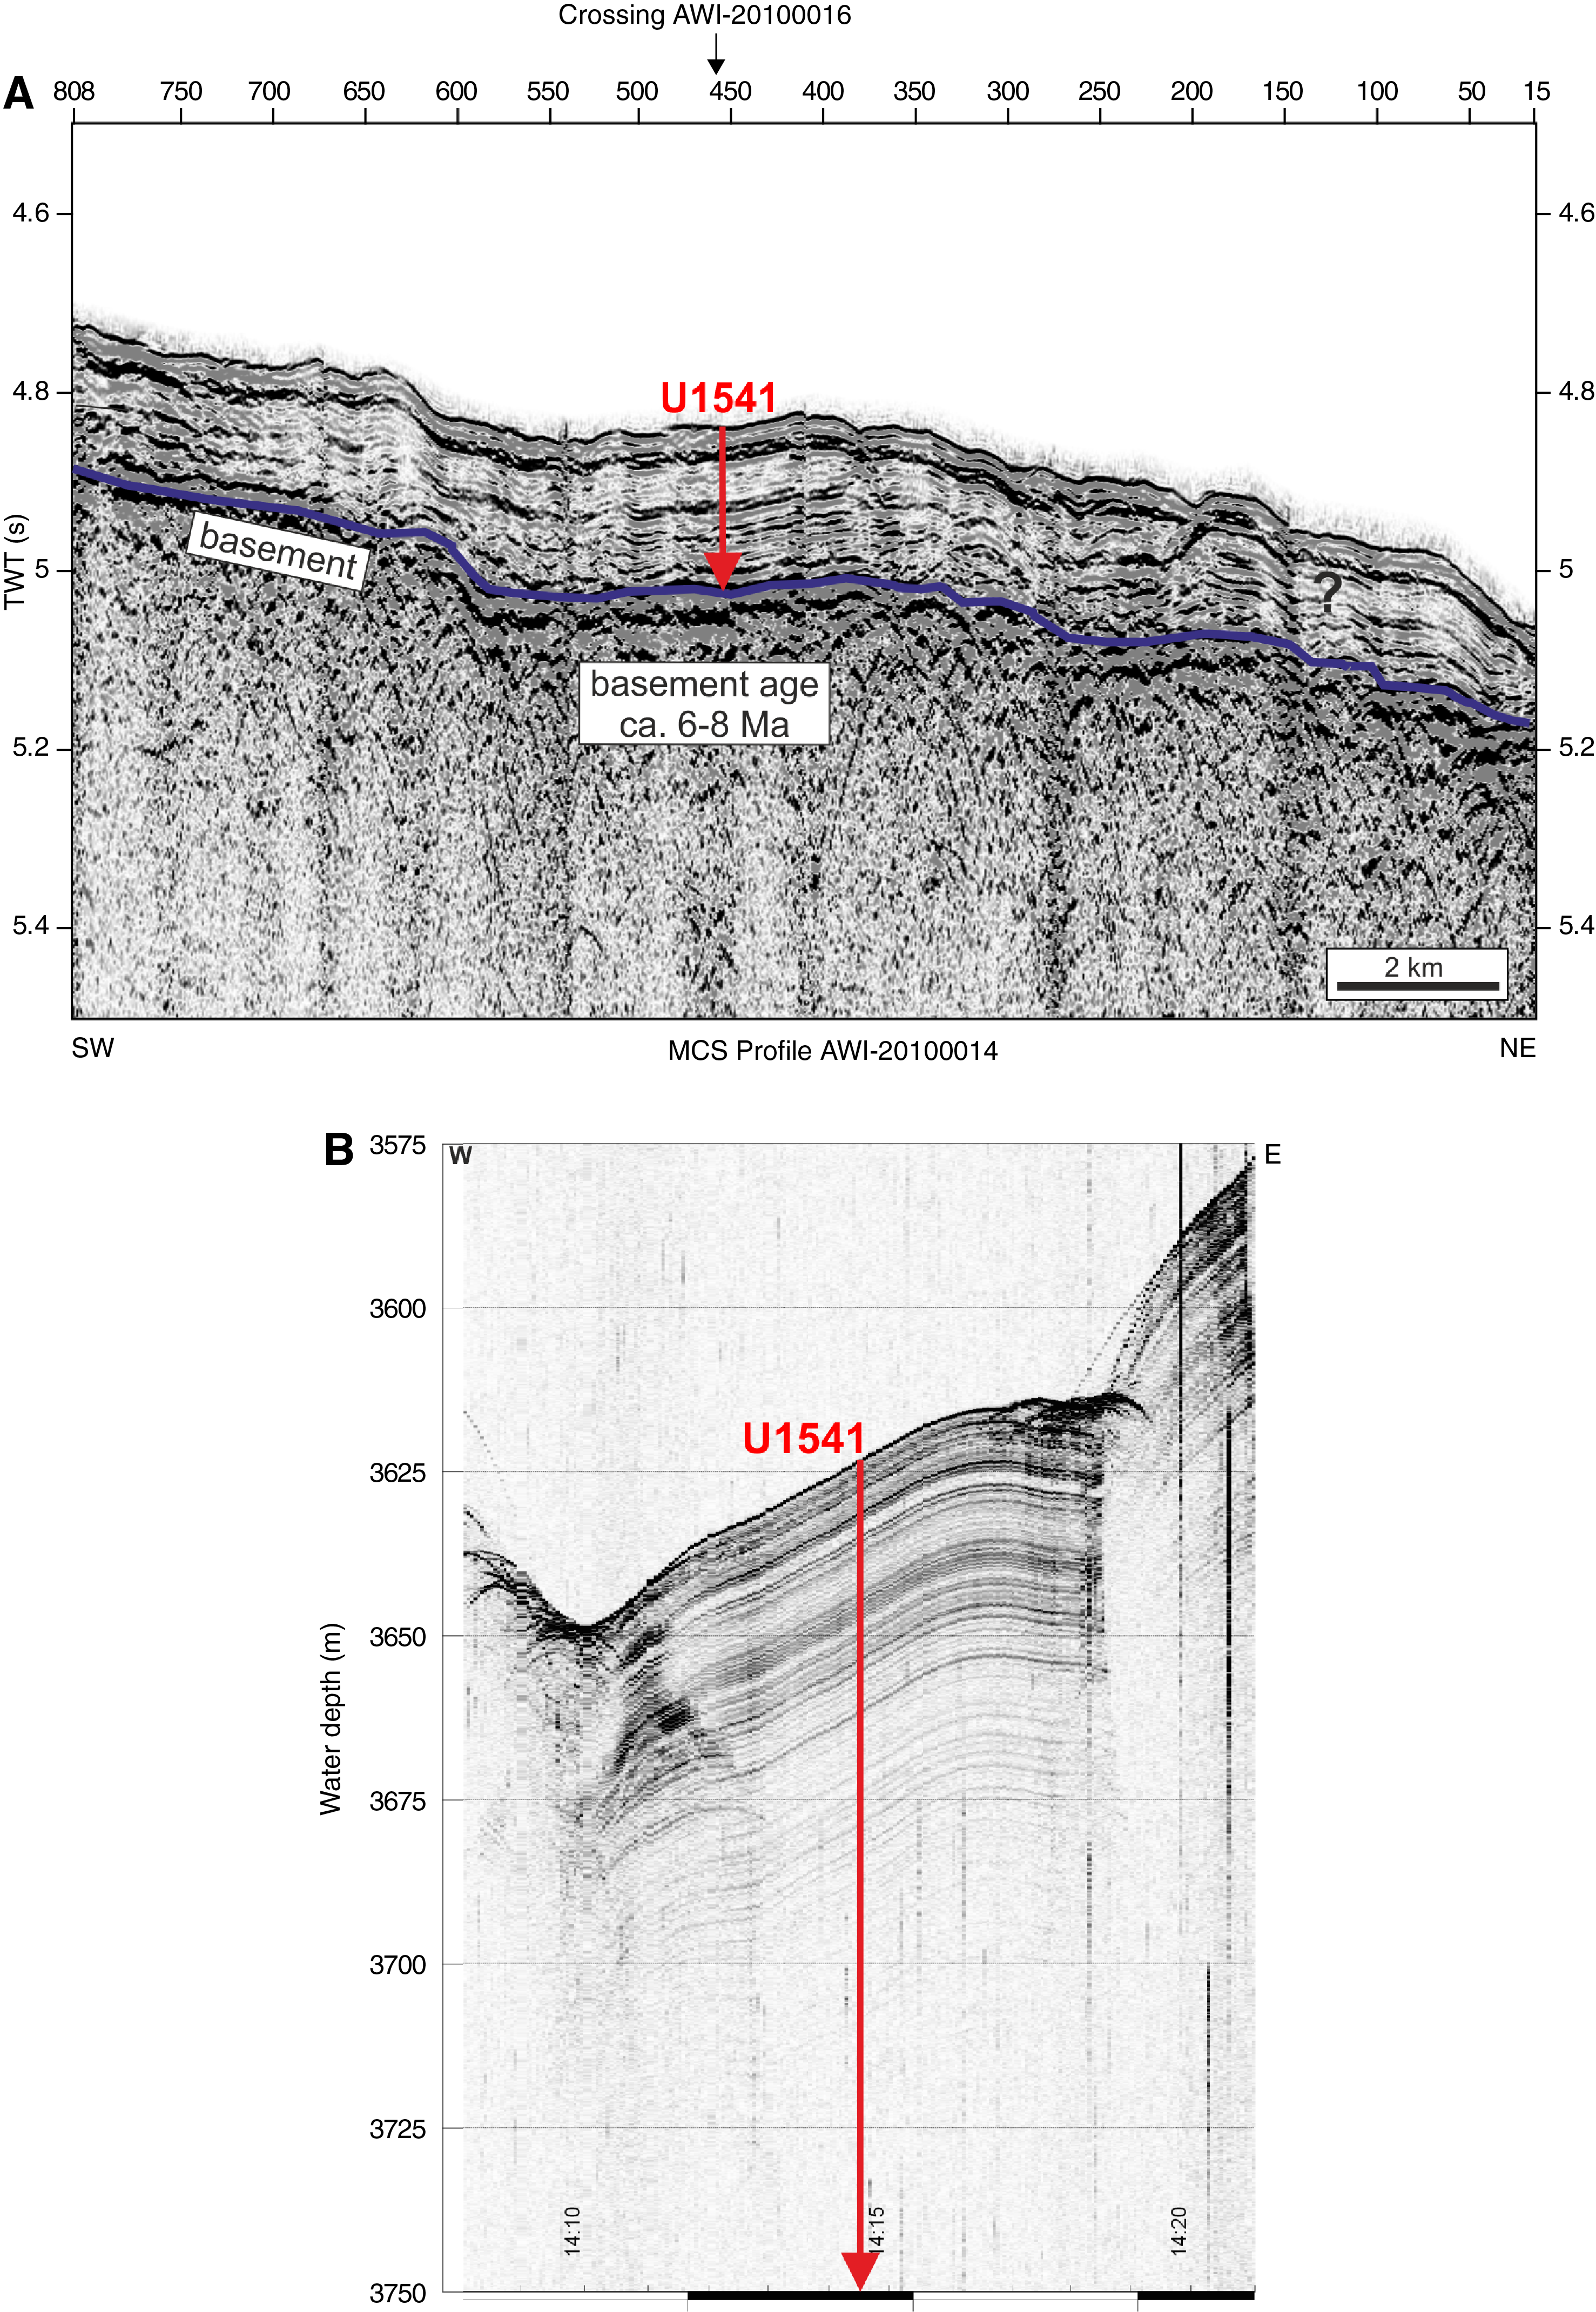
Figure F28. MCS and Parasound profiles, Site U1541.
Site U1541 lies in the pathway of the Subantarctic ACC, ~100 nmi north of the modern mean position of the SAF. In this sector of the ACC, the associated fronts are strongly steered by the topography of seafloor spreading systems (Udintsev and Eltanin-Tharp Fracture Zone systems).
SSTs seasonally vary between ~3°C (July–September) and ~7°C (January–March). The area is located west of the main Antarctic Intermediate and Mode Water formation regions in the ESP. The 3604 m water depth places Site U1541 within LCDW (Figure F14).
The main objectives at Site U1541 were to
- Recover a moderate-resolution Subantarctic Miocene–Quaternary sediment record close to the SAF;
- Characterize the stratigraphy of calcareous and siliceous oozes, allowing for a wide range of paleoceanographic reconstructions;
- Reconstruct high-amplitude Subantarctic SSTs based on multiple proxies;
- Investigate long-term changes in dust input;
- Provide a record of LCDW and potential influence of AABW during glacial periods;
- Reconstruct productivity (opal versus carbonate), nutrient distribution, and dust-productivity coupling; and
- Recover a potential far-field record of WAIS variability.
Operations
During the transit to Site U1541, rough weather systems moved in, causing high seas at the site location. Therefore, upon reaching the site coordinates at ~2300 h on 15 June 2019, the vessel continued at reduced speed on a 245° weather avoidance course for another ~100 nmi past the site. At 2105 h on 16 June, the sea state had sufficiently calmed down to turn the ship around and head back.
We completed the sea voyage and arrived at Site U1541 at 0736 h on 17 June. We lowered the thrusters and the vessel was placed over the site coordinates and on dynamic positioning mode by 0820 h. Soon after, the drill crew started to build the APC/XCB BHA and to lower the drill string to the seafloor.
By 1815 h on 17 June, the drill bit was lowered to 3597 mbrf, 5 m above the seafloor depth calculated by the onboard PDR. We attempted to spud Hole U1541A, but the first core came up empty. Three more attempts followed with the bit at 3602, 3607, and 3617 mbrf before we successfully recovered any sediment. Finally, we spudded Hole U1541A at 2330 h on 17 June. Core 1H recovered 9.5 m of sediment, indicating a missed mudline, and we ended the hole at that point.
The bit was raised to 3612.0 mbrf, and Hole U1541B was spudded at 0055 h on 18 June. Based on the recovery in Core 1H, the seafloor was calculated at 3614.4 mbrf (or 3603.7 mbsl). Coring continued without incident until a partial stroke was recorded on Core 15H. When the core was recovered, the APCT-3 tool cutting shoe showed damage, and the driller pulled back the next APC core barrel before it arrived at the bottom. An XCB core barrel was dropped to attempt Core 16X. After drilling for 45 min and advancing only 0.5 m, the barrel was pulled back on board. Core 16X retrieved three large pebble-sized basalt pieces (2–5 cm in diameter) in the core catcher. The bit was pulled out of the hole, clearing the seafloor at 0100 h and ending Hole U1541B.
A total of 16 cores were taken in Hole U1541B. The APC system was used for 15 of these, reaching 138.0 m CSF-A before APC refusal and recovering 129.3 m (94%). The XCB system was used for one core; it advanced 0.5 m and recovered 0.06 m of basalt (12%). The APCT-3 tool was used on Cores 4H, 7H, 11H, and 15H. Misfires were recorded on Cores 1H, 4H, and 6H, and a partial stroke was registered on Core 15H. A total of 25 h were spent in Hole U1541B.
The vessel was offset 20 m east of Hole U1541B, the bit was raised to 3608.0 mbrf, and Hole U1541C was spudded at 0325 h on 19 June. The hole was deepened with the APC system to 118.1 m CSF-A (Cores 1H–13H) before coring was terminated at 1805 h on 19 June to allow the vessel to evade approaching heavy weather.
The drill pipe was retrieved, and the rig floor was secured for transit at 0204 h on 20 June, ending Hole U1541C and Site U1541. A total of 13 APC cores were taken over a 118.1 m interval with a recovery of 100.4 m (85%).
In summary, three holes were cored at Site U1541 using the full-length APC coring system. Hole U1541A was cored to 9.5 m CSF-A (9.67 m recovered; 101.8%), Hole U1541B was cored to 138.5 m CSF-A (129.27 m recovered; 93.3%), and Hole U1541C was cored to 118.1 m CSF-A (100.37 m recovered; 85%).
Principal results
A ~145 m spliced sedimentary sequence of Holocene–Miocene age was recovered at Site U1541 from Holes U1541A–U1541C (Figure F29). The sedimentary sequence includes four lithofacies: carbonate-bearing to carbonate-rich diatom ooze (Lithofacies 2), diatom-bearing to diatom-rich nannofossil/calcareous ooze (Lithofacies 3), nearly pure nannofossil ooze (Lithofacies 4), and clay-bearing to clayey biogenic ooze (Lithofacies 6) (Figure F30). Based on the distribution and co-occurrence of the defined lithofacies, we divided the Site U1541 sedimentary sequence into three lithostratigraphic units. The youngest, Unit I, is divided into two subunits: IA to ~25 m CSF-A (~27 m CCSF-A) and IB from ~25 to ~63 m CSF-A (~66 m CCSF-A). The subunit boundary is determined by a transition from frequent and marked changes between Lithofacies 2, 3, and 4 to a dominance of Lithofacies 3. Unit II spans from ~63 to ~95 m CSF-A (~66 to ~98 m CCSF-A) and differs from Unit I above by an absence of diatom ooze (Lithofacies 2), resulting in a dominance of different varieties of nannofossil ooze (Lithofacies 3 and 4). Subunit IIIA, from ~95 to ~119 m CSF-A (~99 to ~127 m CCSF-A), can be distinguished from Unit II above by a distinct color change in Lithofacies 3 and 4 from white and light greenish gray to very pale brown and pale orange yellow and an increased contribution from Lithofacies 3. Subunit IIIB spans from ~119 to ~137 m CSF-A (~127 to ~145 m CCSF-A) and shows a dominance of Lithofacies 4 in contrast to Subunit IIIA. The presence of basalt rock and volcanic glass fragments at the base of Hole U1541B in Sections 15H-5 and 16X-CC suggests the complete recovery of the pelagic sediment sequence above oceanic basement at this site.
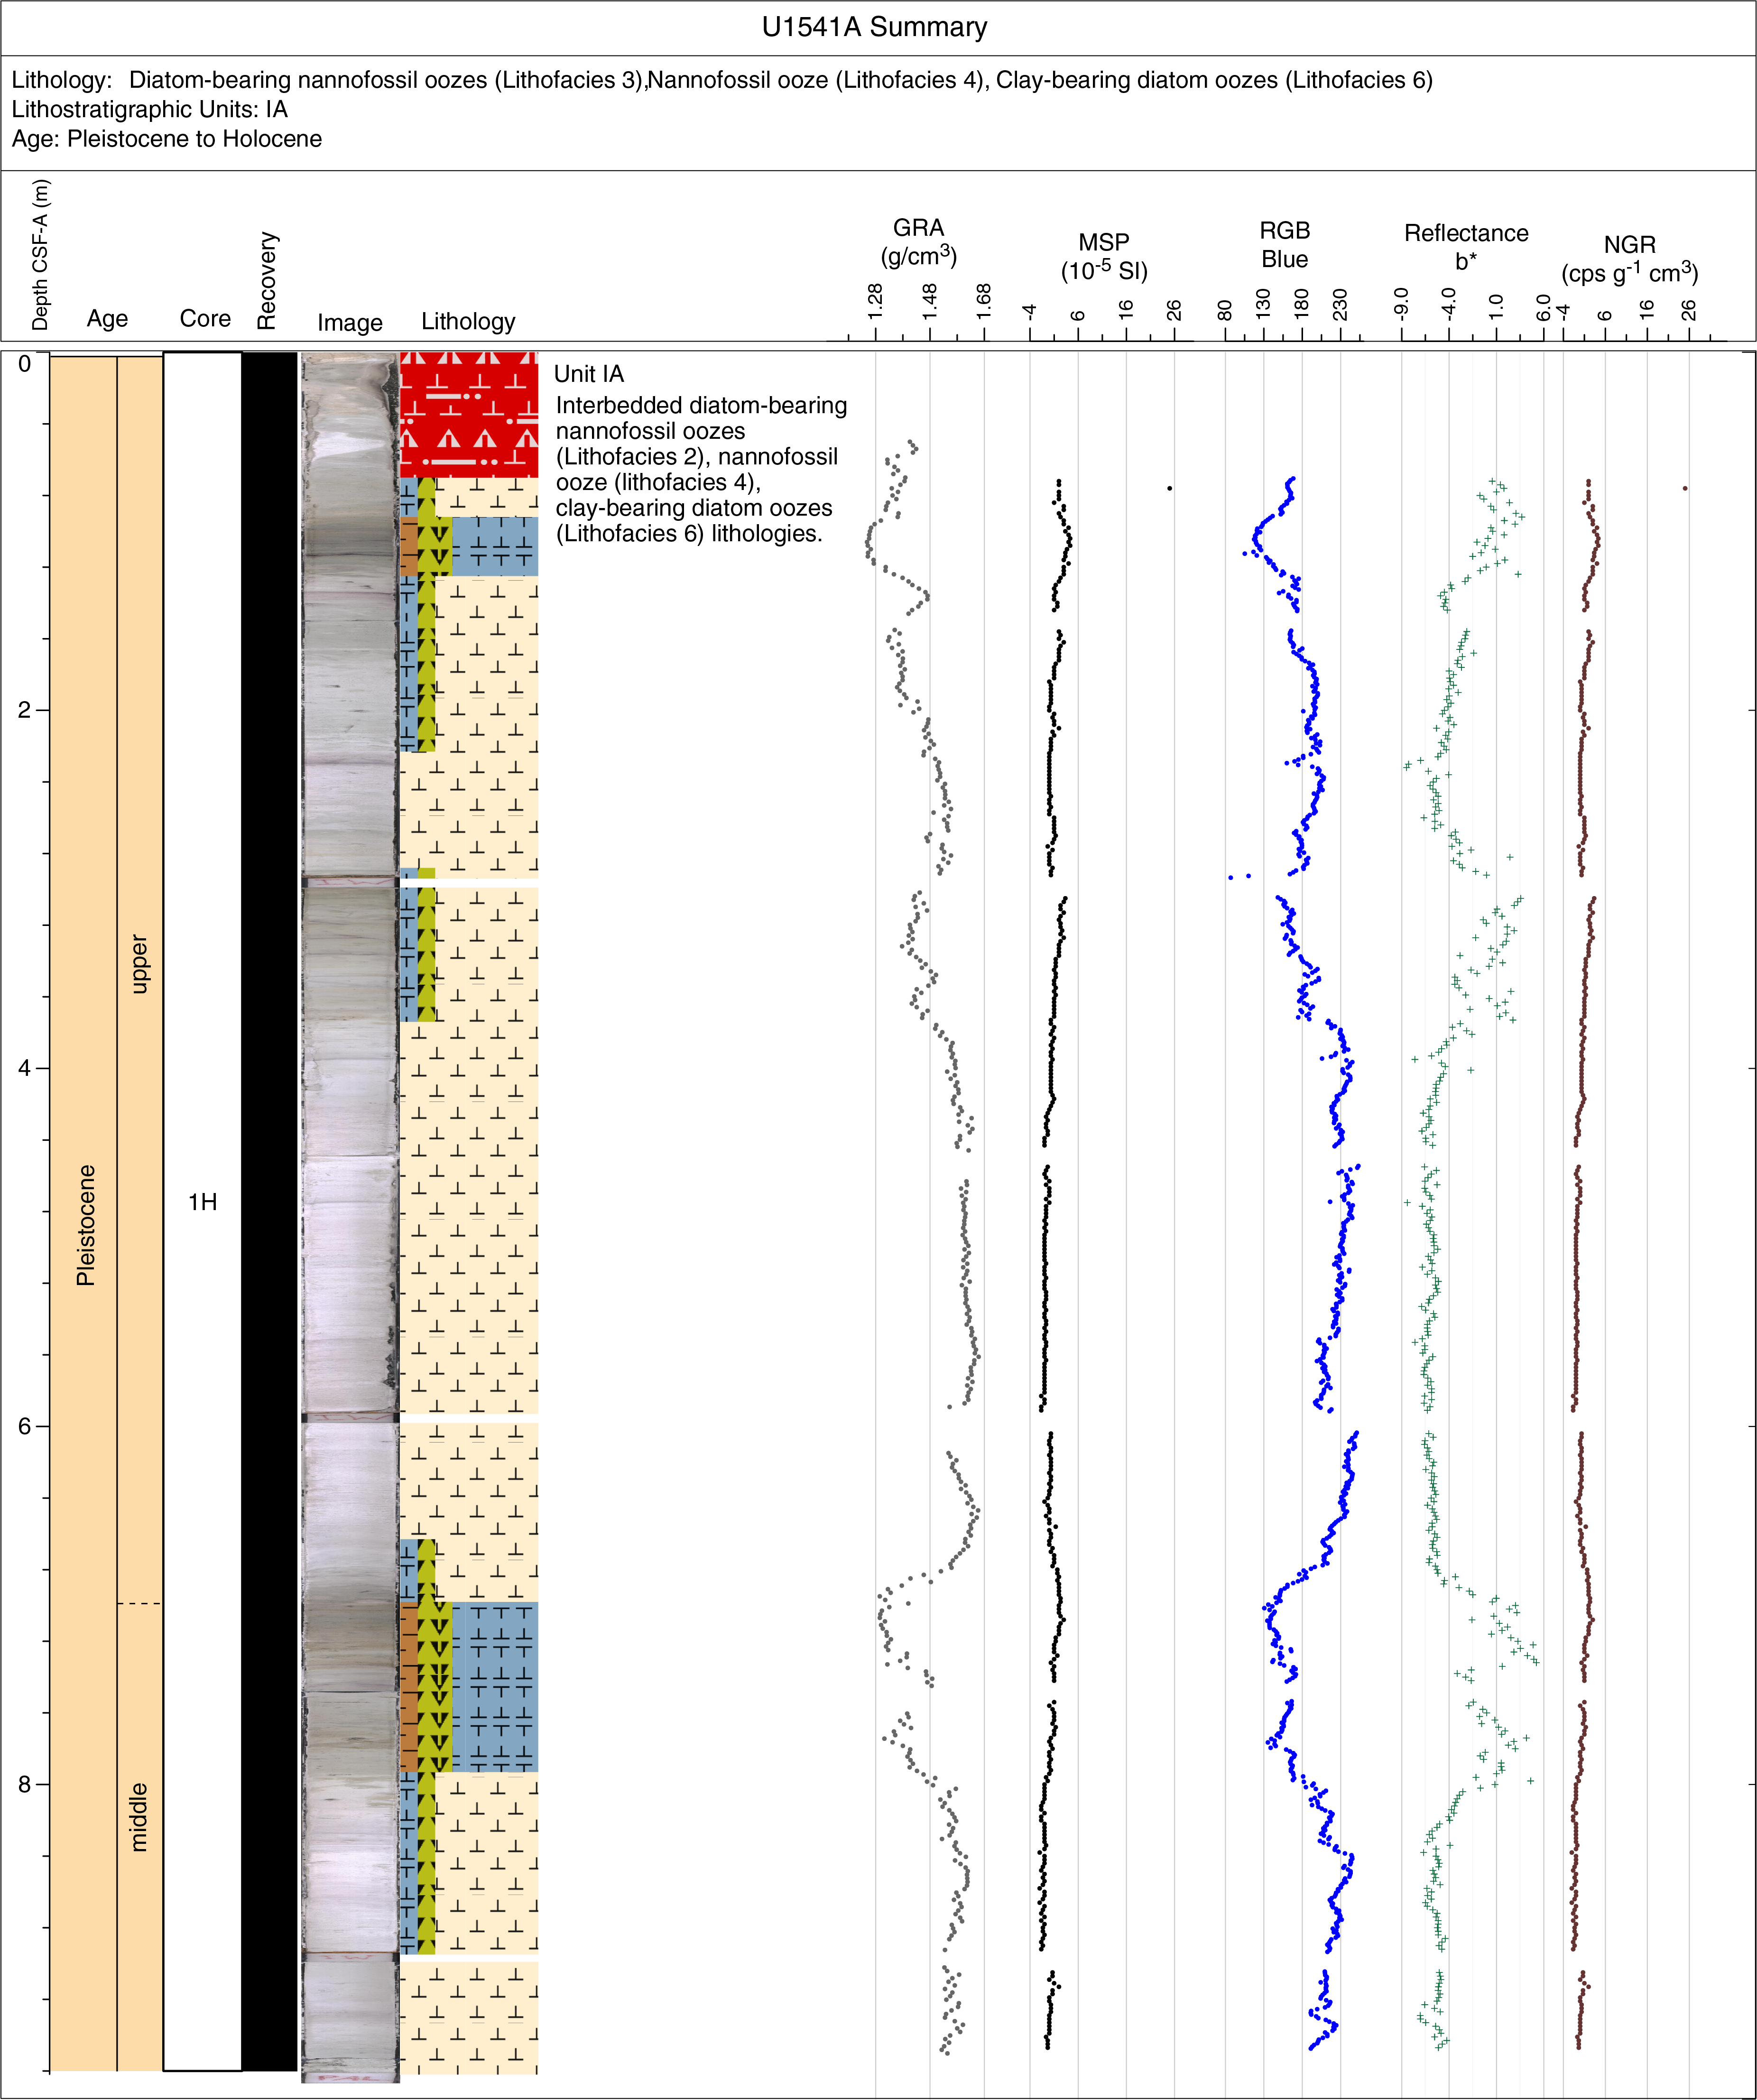
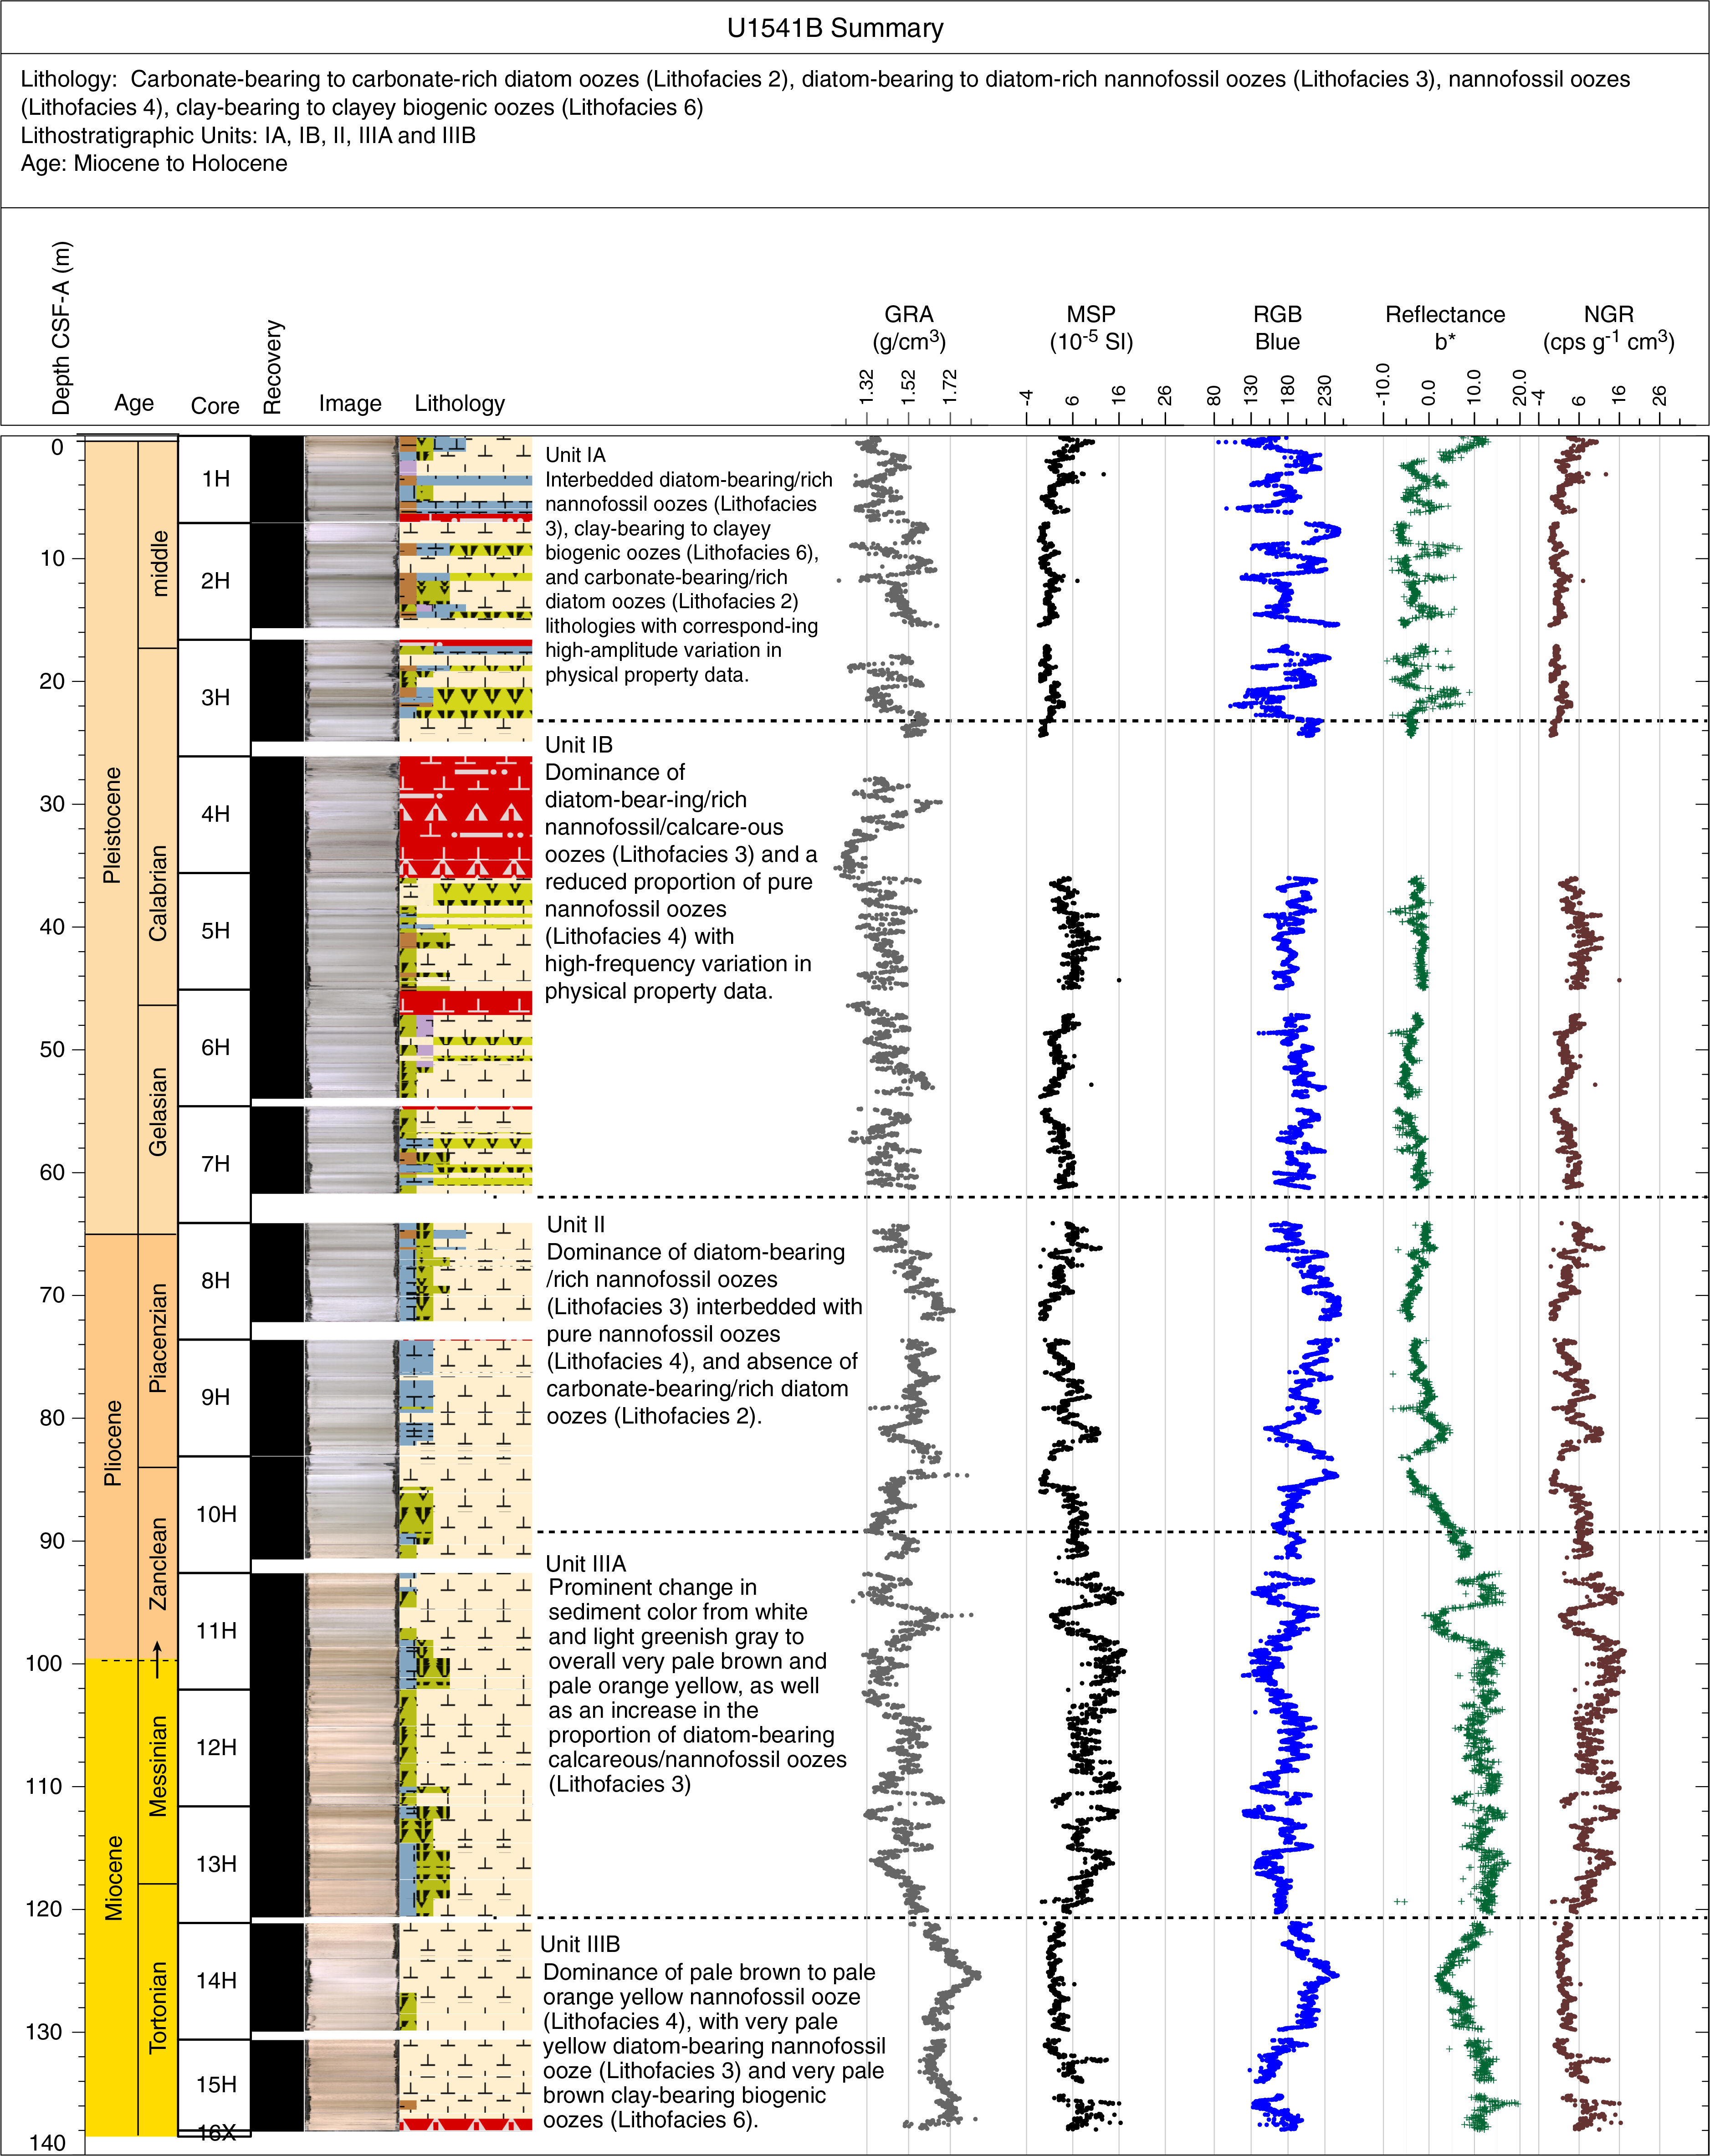

Figure F29. Hole summaries, Site U1541.

Figure F30. Primary lithostratigraphic variations, Site U1541.
All microfossil groups studied on board (diatoms, radiolarians, silicoflagellates, benthic and planktonic foraminifers, nannofossils, and ostracods) are present at the site. The preservation of diatoms is moderate overall. Radiolarians are generally very well preserved except for a few samples. Silicoflagellates are rare to barren throughout the core except for four samples in which they are common to abundant. Calcareous nannofossils are present in all the samples. They are common to abundant except for a few samples and become dominant in specific nannofossil ooze intervals. Planktonic and benthic foraminifers and ostracods show good to moderate preservation in the upper part of Hole U1541B and moderate preservation in the lowermost core catcher samples. Ostracods are particularly abundant in Sample 9H-CC.
The biostratigraphic age model at Site U1541 was mainly based on analyses from Hole U1541B with additional samples from Hole U1541C analyzed for diatoms and nannofossils. Split-core samples were taken in both holes to refine the stratigraphy in the lower half of the site. In total, 117 biostratigraphic events were recognized, and they indicate an estimated age of ~7.7 Ma at the bottom of both holes. The integrated biostratigraphy of diatoms, radiolarians, calcareous nannofossils, and planktonic foraminifers showed no major hiatuses at Site U1541, suggesting a continuous sequence of late Miocene to Holocene sediments.
Paleomagnetic measurements indicate a number of polarity changes that are best illustrated by downhole changes in inclination. These capture a series of apparent polarity reversals that are consistent between Holes U1541B and U1541C, where they overlap and together provide a long and almost continuous record of polarity change over the past 8 My (Figure F31). The Matuyama/Brunhes and upper/lower Jaramillo polarity boundaries, which define the upper part of the Matuyama Chron (C1r.1r and C1r.1n), were observed. Most reversal boundaries from the Olduvai Chron (C2n) to Chron C4r.1n (8.254 Ma) are generally well characterized. The record of inclination and intensity after 20 mT peak AF demagnetization for the splice composite record allows polarity interpretations and correlation to the geomagnetic polarity timescale (GPTS; Cande and Kent, 1995). Only the boundaries associated with the reversed polarity intervals of the Gauss Chron (C2An) (Kaena and Mountain) and the short normal polarity Subchron C3BR.2n that spans from 7.454 to 7.485 Ma are not clearly recognized over the 8.5 Ma interval.
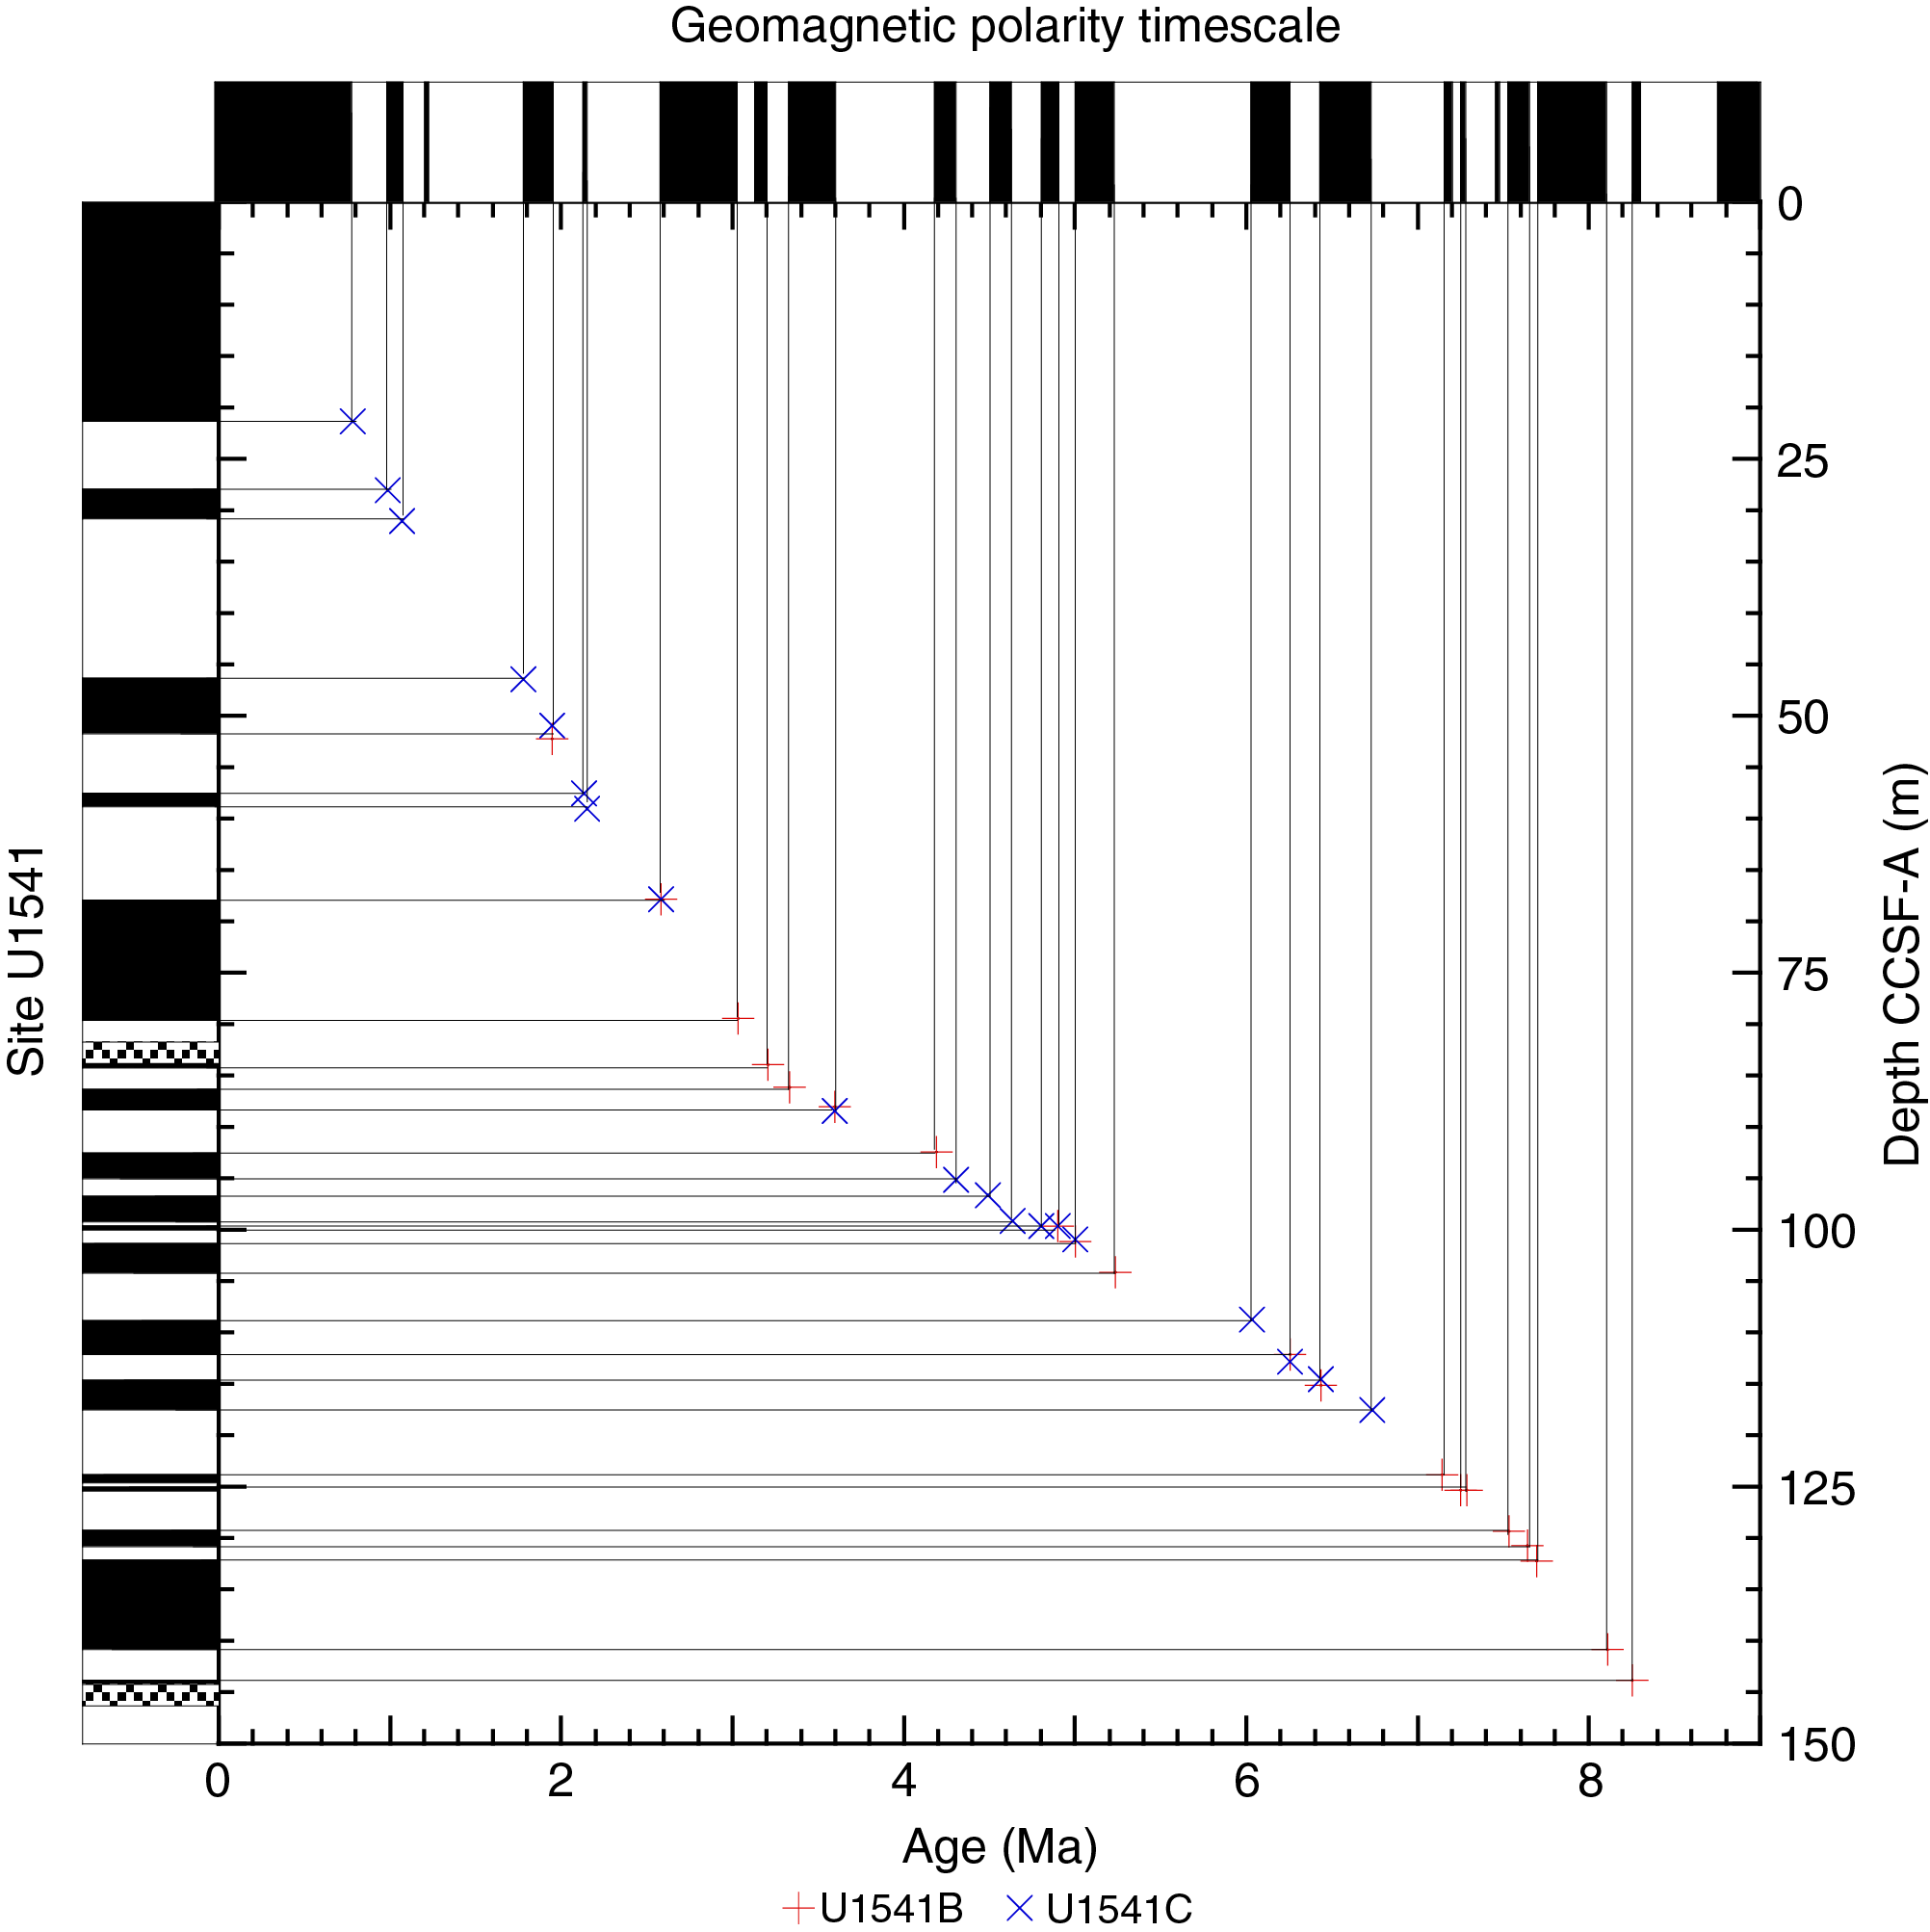
Figure F31. Age-depth relationship, Holes U1541B and U1541C.
We analyzed samples for headspace gas, interstitial water chemistry, and bulk sediment chemistry at a resolution of three per core from 0 to 9.5 m CSF-A in Hole U1541A and 0 to 138.5 m CSF-A in Hole U1541B and two per core from 0 to 32.6 m CSF-A in Hole U1541C. Methane concentrations are low at this site overall, never exceeding 3.47 ppmv. Ethane and propane remain below detection limit throughout the entire hole.
Alkalinity and pH decrease with depth starting around 80 m CSF-A. Interstitial water iron concentration deeper than 86 m CSF-A drops below detection limits, and interstitial water manganese concentration drops below detection limits deeper than 105.05 m CSF-A.
Calcium carbonate content is relatively high at this site; it never falls below 21.6 wt% and has a downhole average content of 68.6 wt%. Calcium carbonate content shows a good correlation with sediment color reflectance parameter L* and RGB blue data (Figure F32). TOC contributes a maximum of 0.8 wt% to the total carbon pool throughout this site and shows no clear correlation with calcium carbonate content. TN is very low at this site, never exceeding 0.06 wt%.
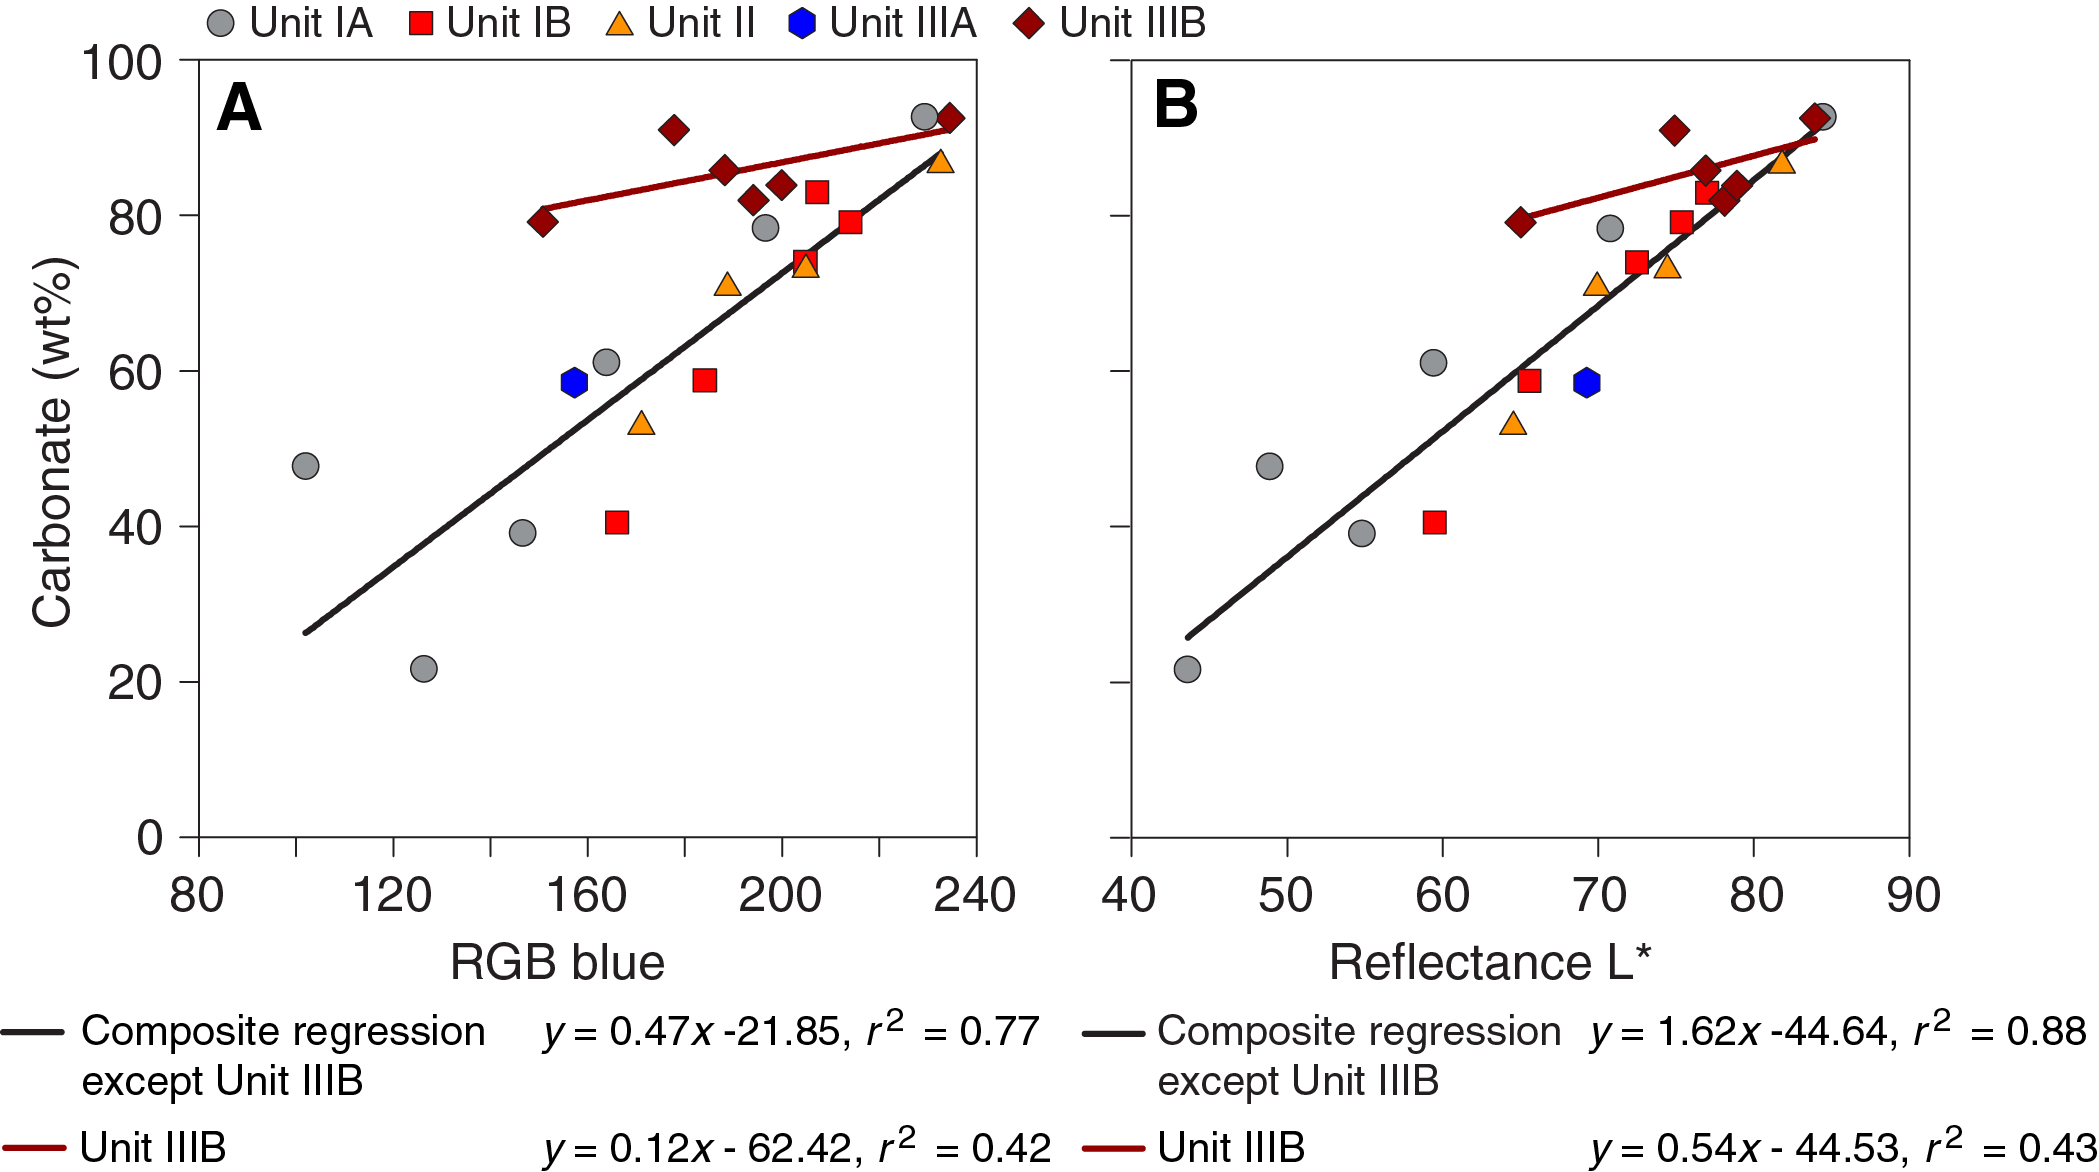
Figure F32. Bulk sedimentary carbonate content, RGB blue, and L*, Holes U1541A and U1541B.
The bulk sediment elemental composition shows marked increase in concentrations toward the bottom at 135.85 m CSF-A, indicating interaction between basement rocks and the sediment. Oxide contents of magnesium, potassium, iron, silica, and titanium co-vary strongly with aluminum oxides, suggesting that these elements are present primarily in clay minerals. High coherency between the downhole calcium and strontium concentration patterns suggests that strontium is incorporated in biogenic carbonate.
Physical property data acquired from whole-round measurements are generally in good agreement with those from split-core measurements for MS loop and point measurements. GRA bulk density and P-wave logger (PWL) velocity values indicate shorter term variations in Lithostratigraphic Unit I and at the top of Unit II, and the shortest term variations at the top of Unit II and in Subunit IB are probably linked to 40 ky cycles in the early Pleistocene. MS shows both high amplitude and large timescale variability all along the record. GRA bulk density shows higher values in Unit II and Subunit IIIB, corresponding to a higher fraction of carbonate/nannofossils compared to diatoms, whereas MS and NGR show higher values in Subunit IIIA likely linked to higher terrigenous content.
Downhole changes in physical property characteristics overall are in good agreement with the defined lithofacies (Figure F33) but show different relationships with one another compared to Sites U1539 and U1540 in intervals of low diatom content.
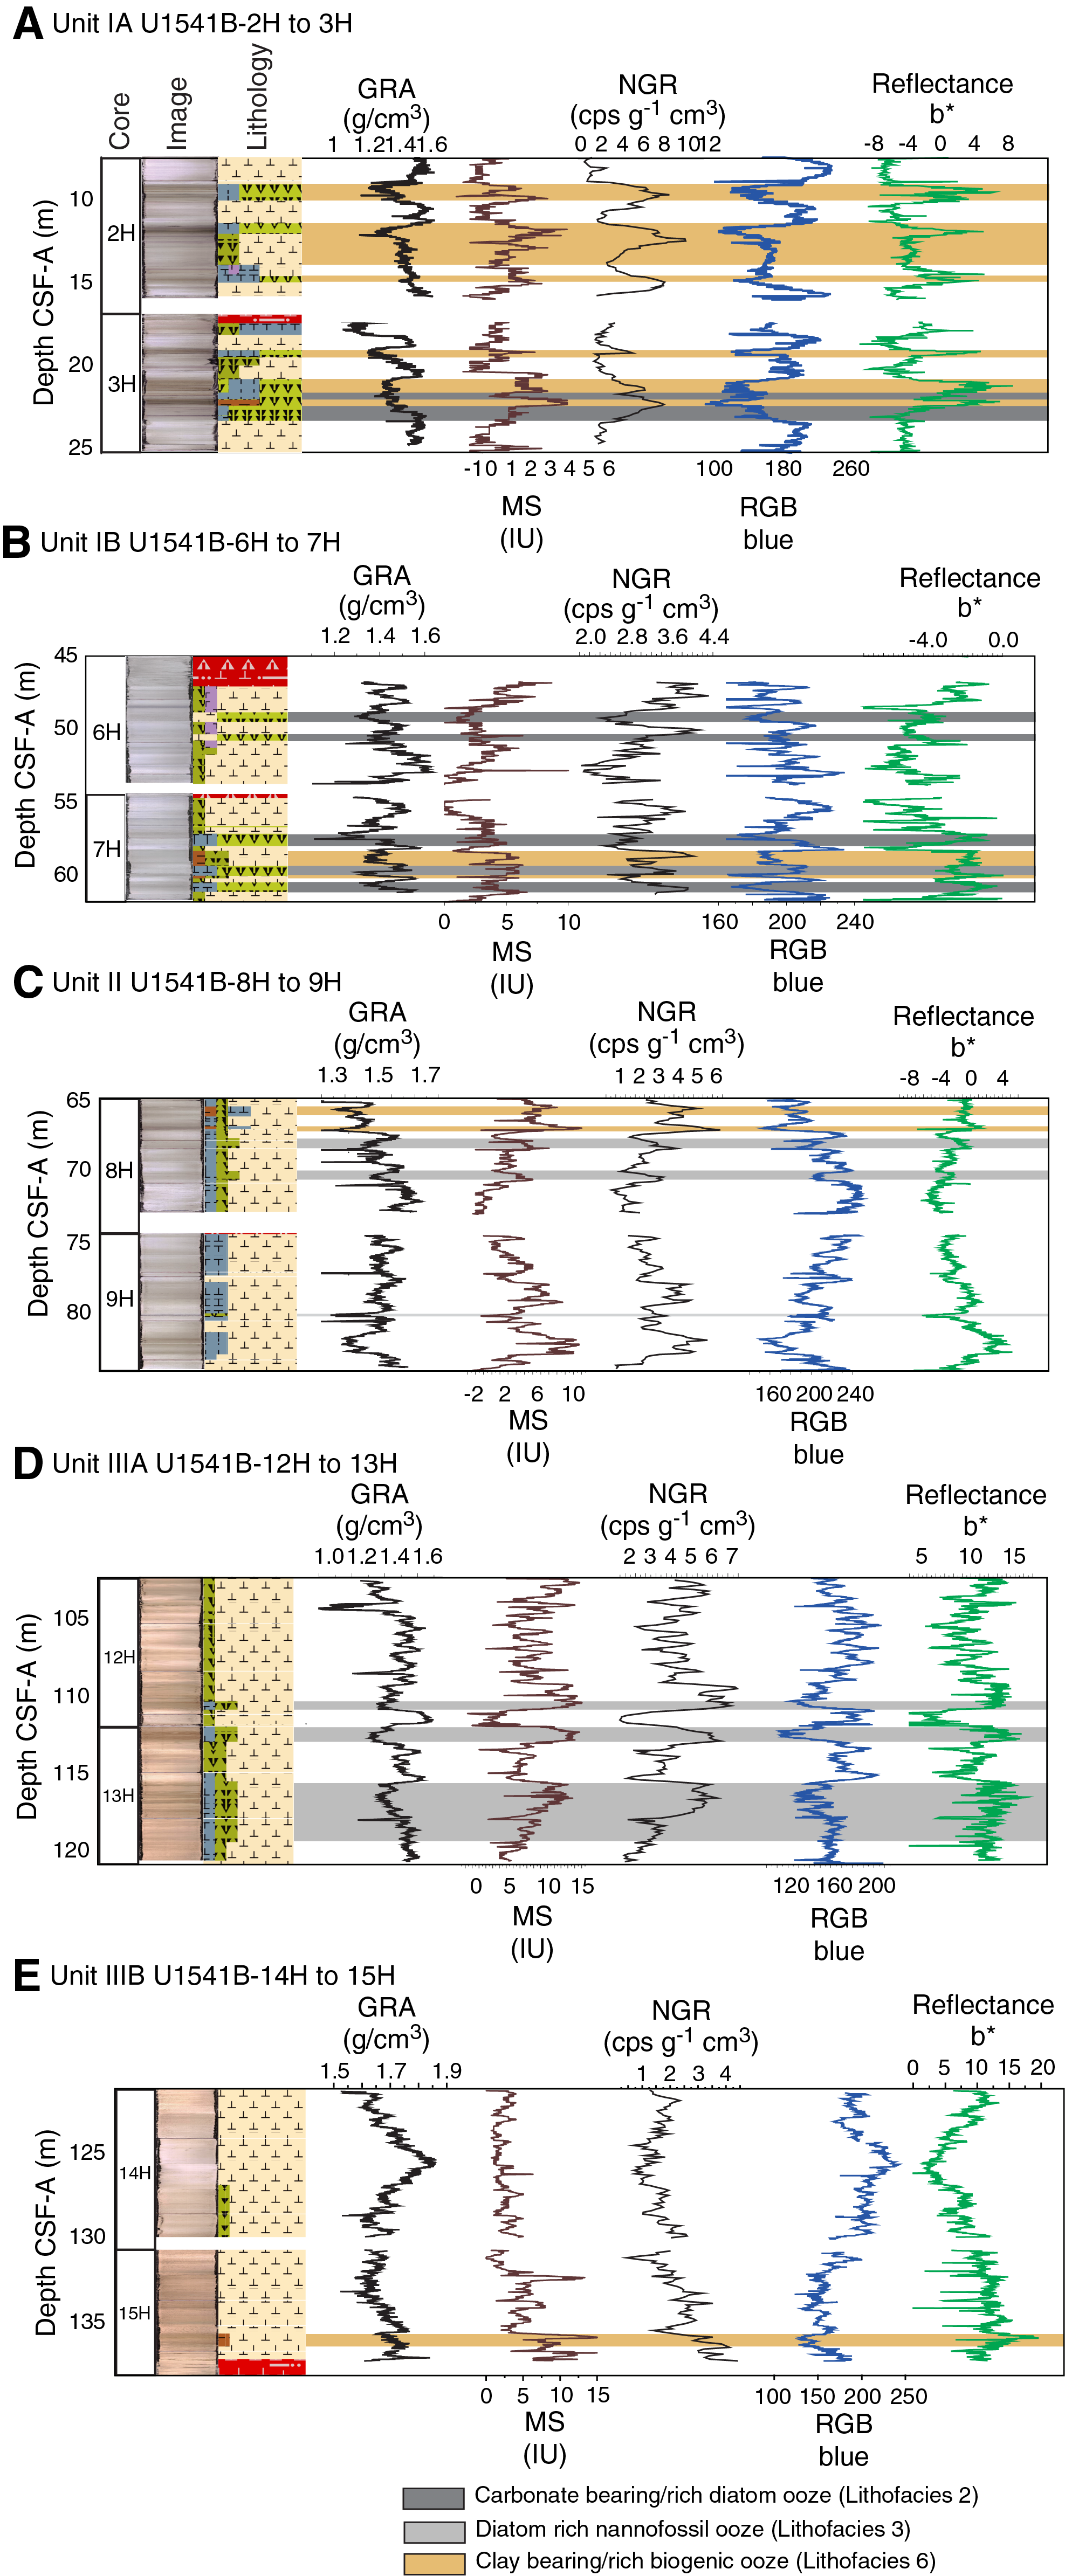
Figure F33. Physical properties, Hole U1541B.
Correlations between holes at Site U1541 were accomplished using Correlator software (version 3.0). Tie points were established mostly using the core image RGB blue channel, but in many cases a combination of measurements was used. We constructed a splice from 0 to 127.254 m CCSF-A using three holes; however, because of some disturbed cores or cores that were too short to be used, the splice contains two gaps. Because Hole U1541B was drilled deeper than either of the other holes, the last two cores in Hole U1541B were appended to the bottom of the splice.
We constructed a preliminary age model based on biostratigraphic and paleomagnetic age markers. These data suggest that the sedimentary sequence recovered at Site U1541 covers the past ~8 My (Figure F34). Though substantially lower than at Site U1539 and U1540, sedimentation rates at Site U1541 average 2.7 cm/ky downhole to ~3 Ma and decrease to ~1.3 cm/ky during most of the Pliocene and late Miocene. This age model is generally consistent with preliminary stratigraphic tuning performed on board based on physical property data such as color measurements (RGB blue) and GRA bulk density.
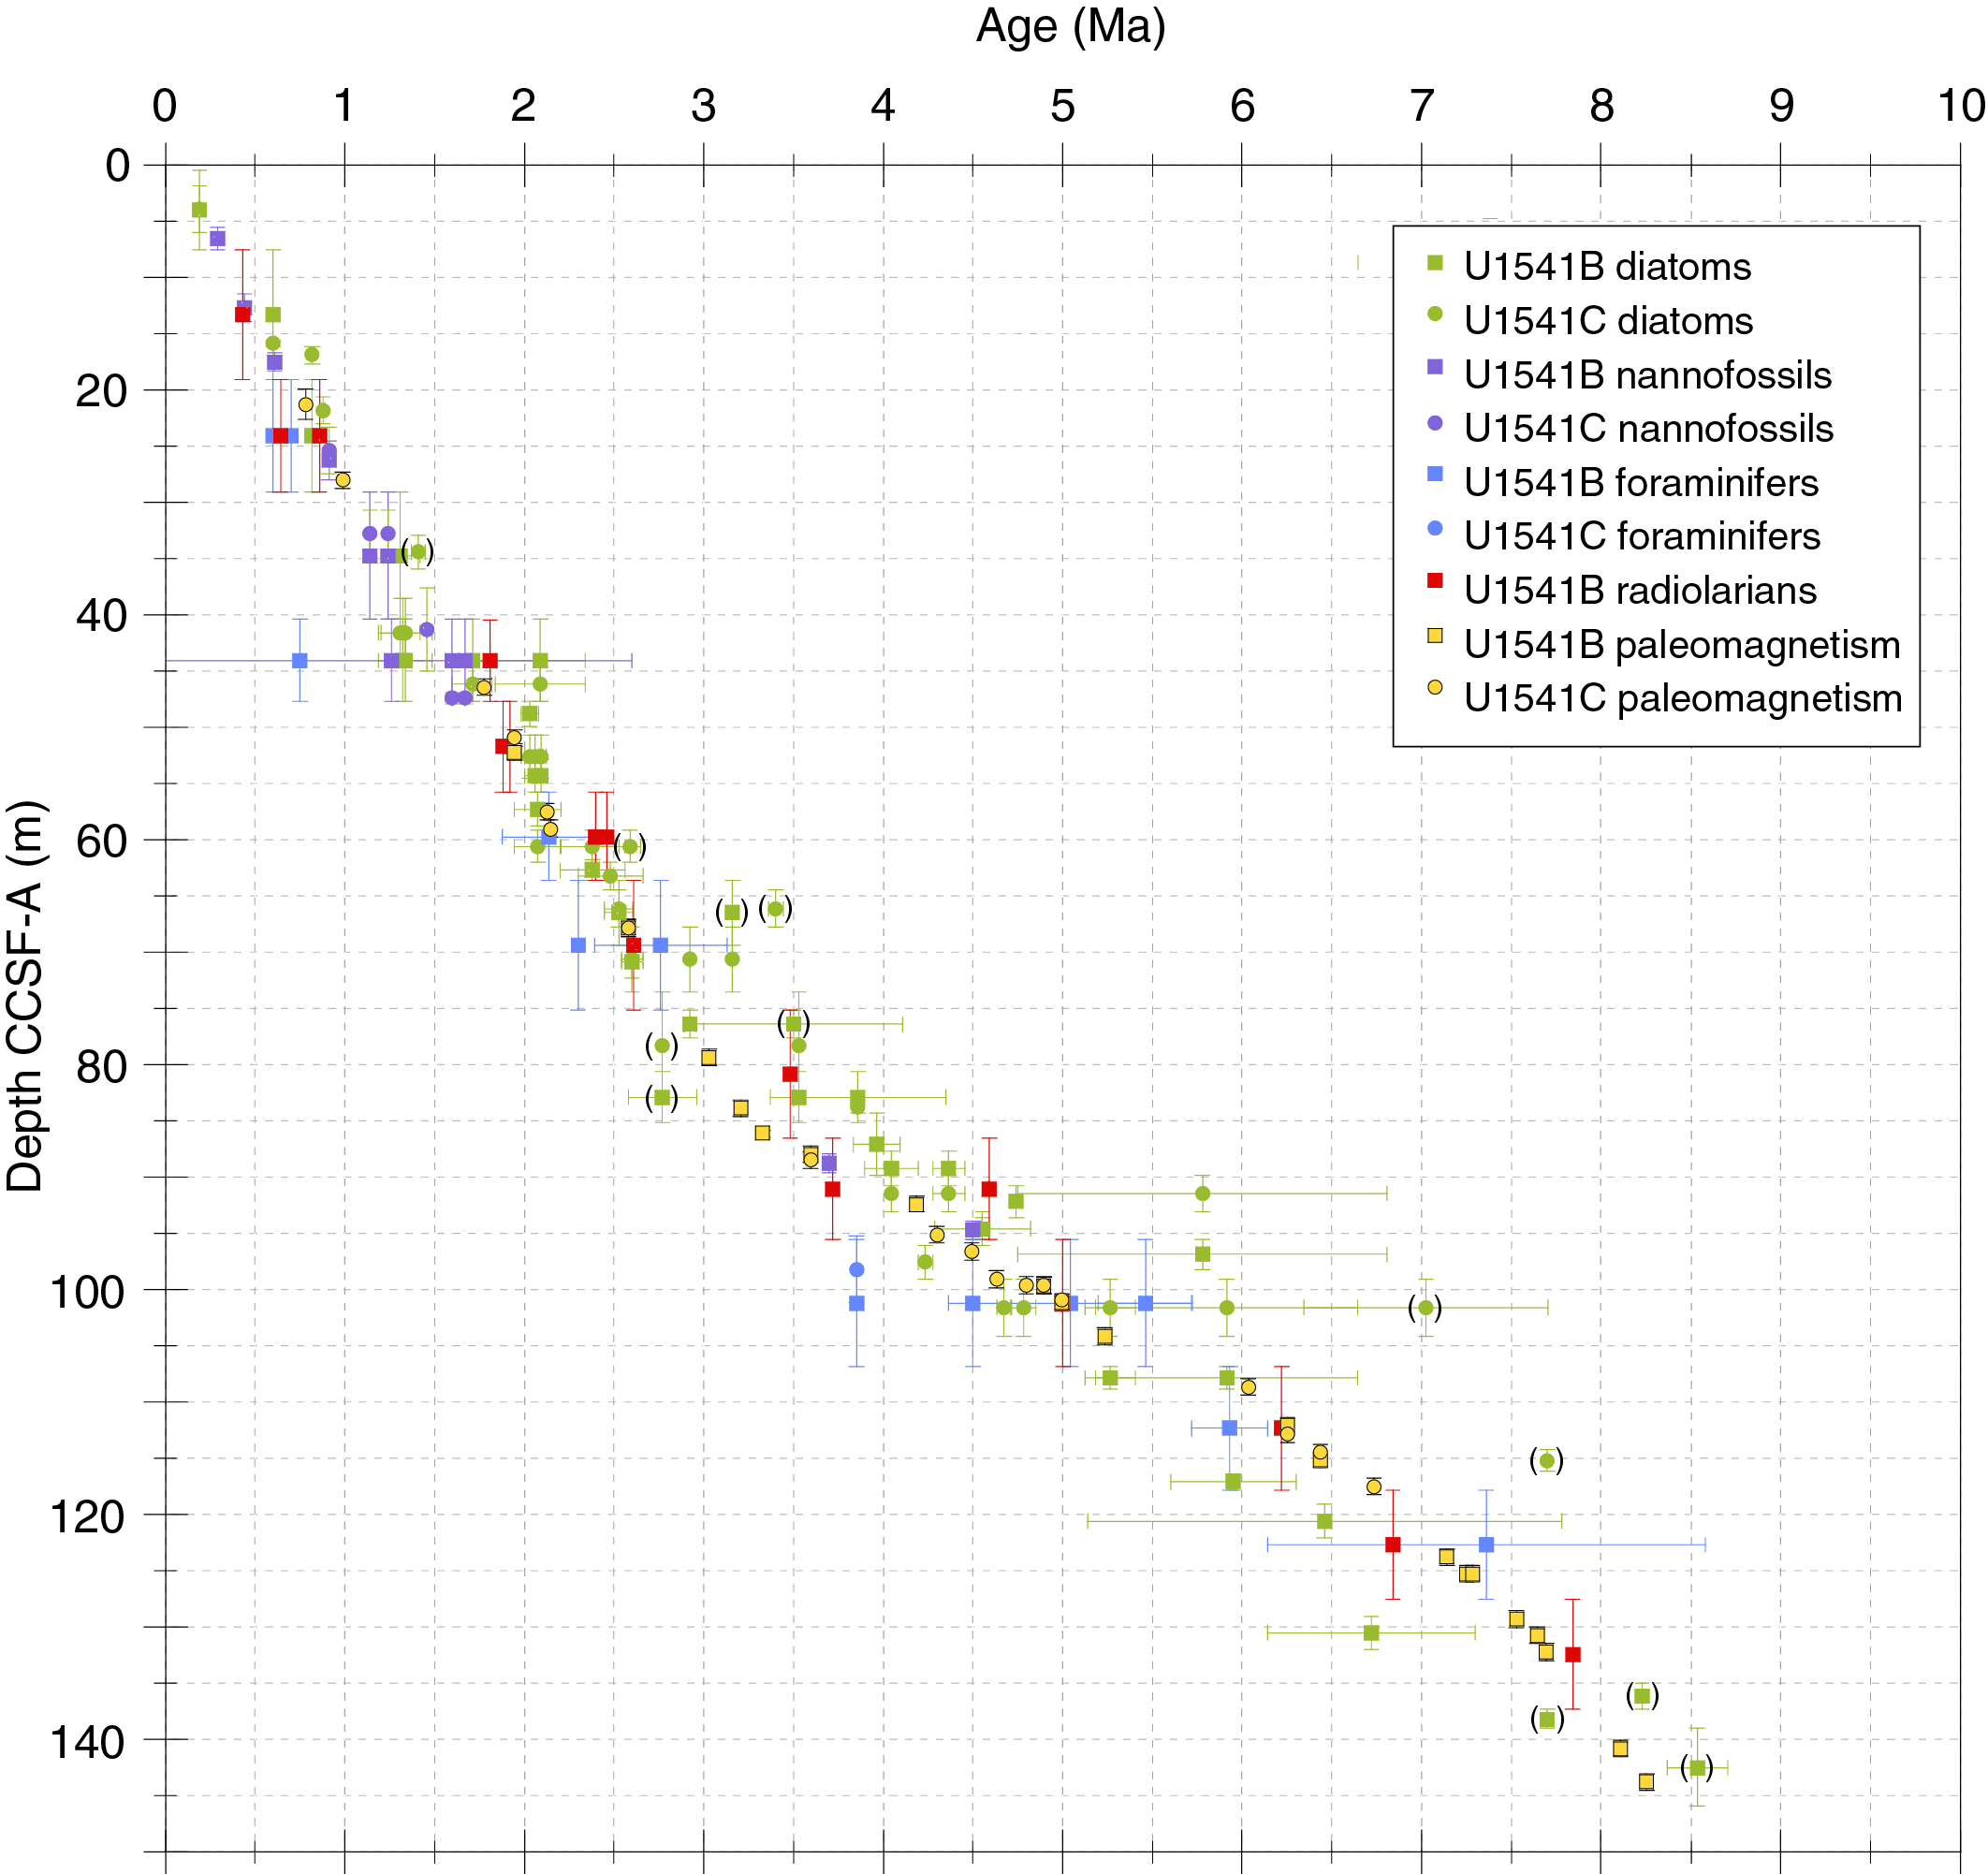
Figure F34. Preliminary age model, Site U1541.
The combination of nearly continuous recovery, medium-to-high sedimentation rates primarily driven by calcareous and diatom productivity during glacial periods, clear patterns in physical properties and sediment color, and a rich array of well-preserved calcareous microfossils combined with diatoms will provide unprecedented opportunities for improving our understanding of the dynamics of the ACC and its link to global carbon cycle changes at orbital timescales back into the late Miocene. Site U1541 will therefore provide a crucial Miocene-to-present perspective on the evolution of the ACC system, and its climate impact and will complement higher resolution paleoclimate reconstructions based on Sites U1539 and U1540, which cover the period from the Pliocene to present.
Site U1542
Background and objectives
Site U1542 (Proposed Site CHI-4B) is located at the Chile continental margin in the ESP at 52°42.2917′S, 75°35.76915′W, ~30 nmi west of the entrance of the Strait of Magellan at 1101 m water depth (Figure F35). North of ~53°S, subduction in the Chile Trench is more orthogonal and results in a steep slope incised by canyons that run perpendicular to the trench axis. Recent sediment cover is minor at the lower slope, but a relatively small-scale sediment depocenter (“sediment drift”) has been identified at the upper continental slope where Site U1542 is located.
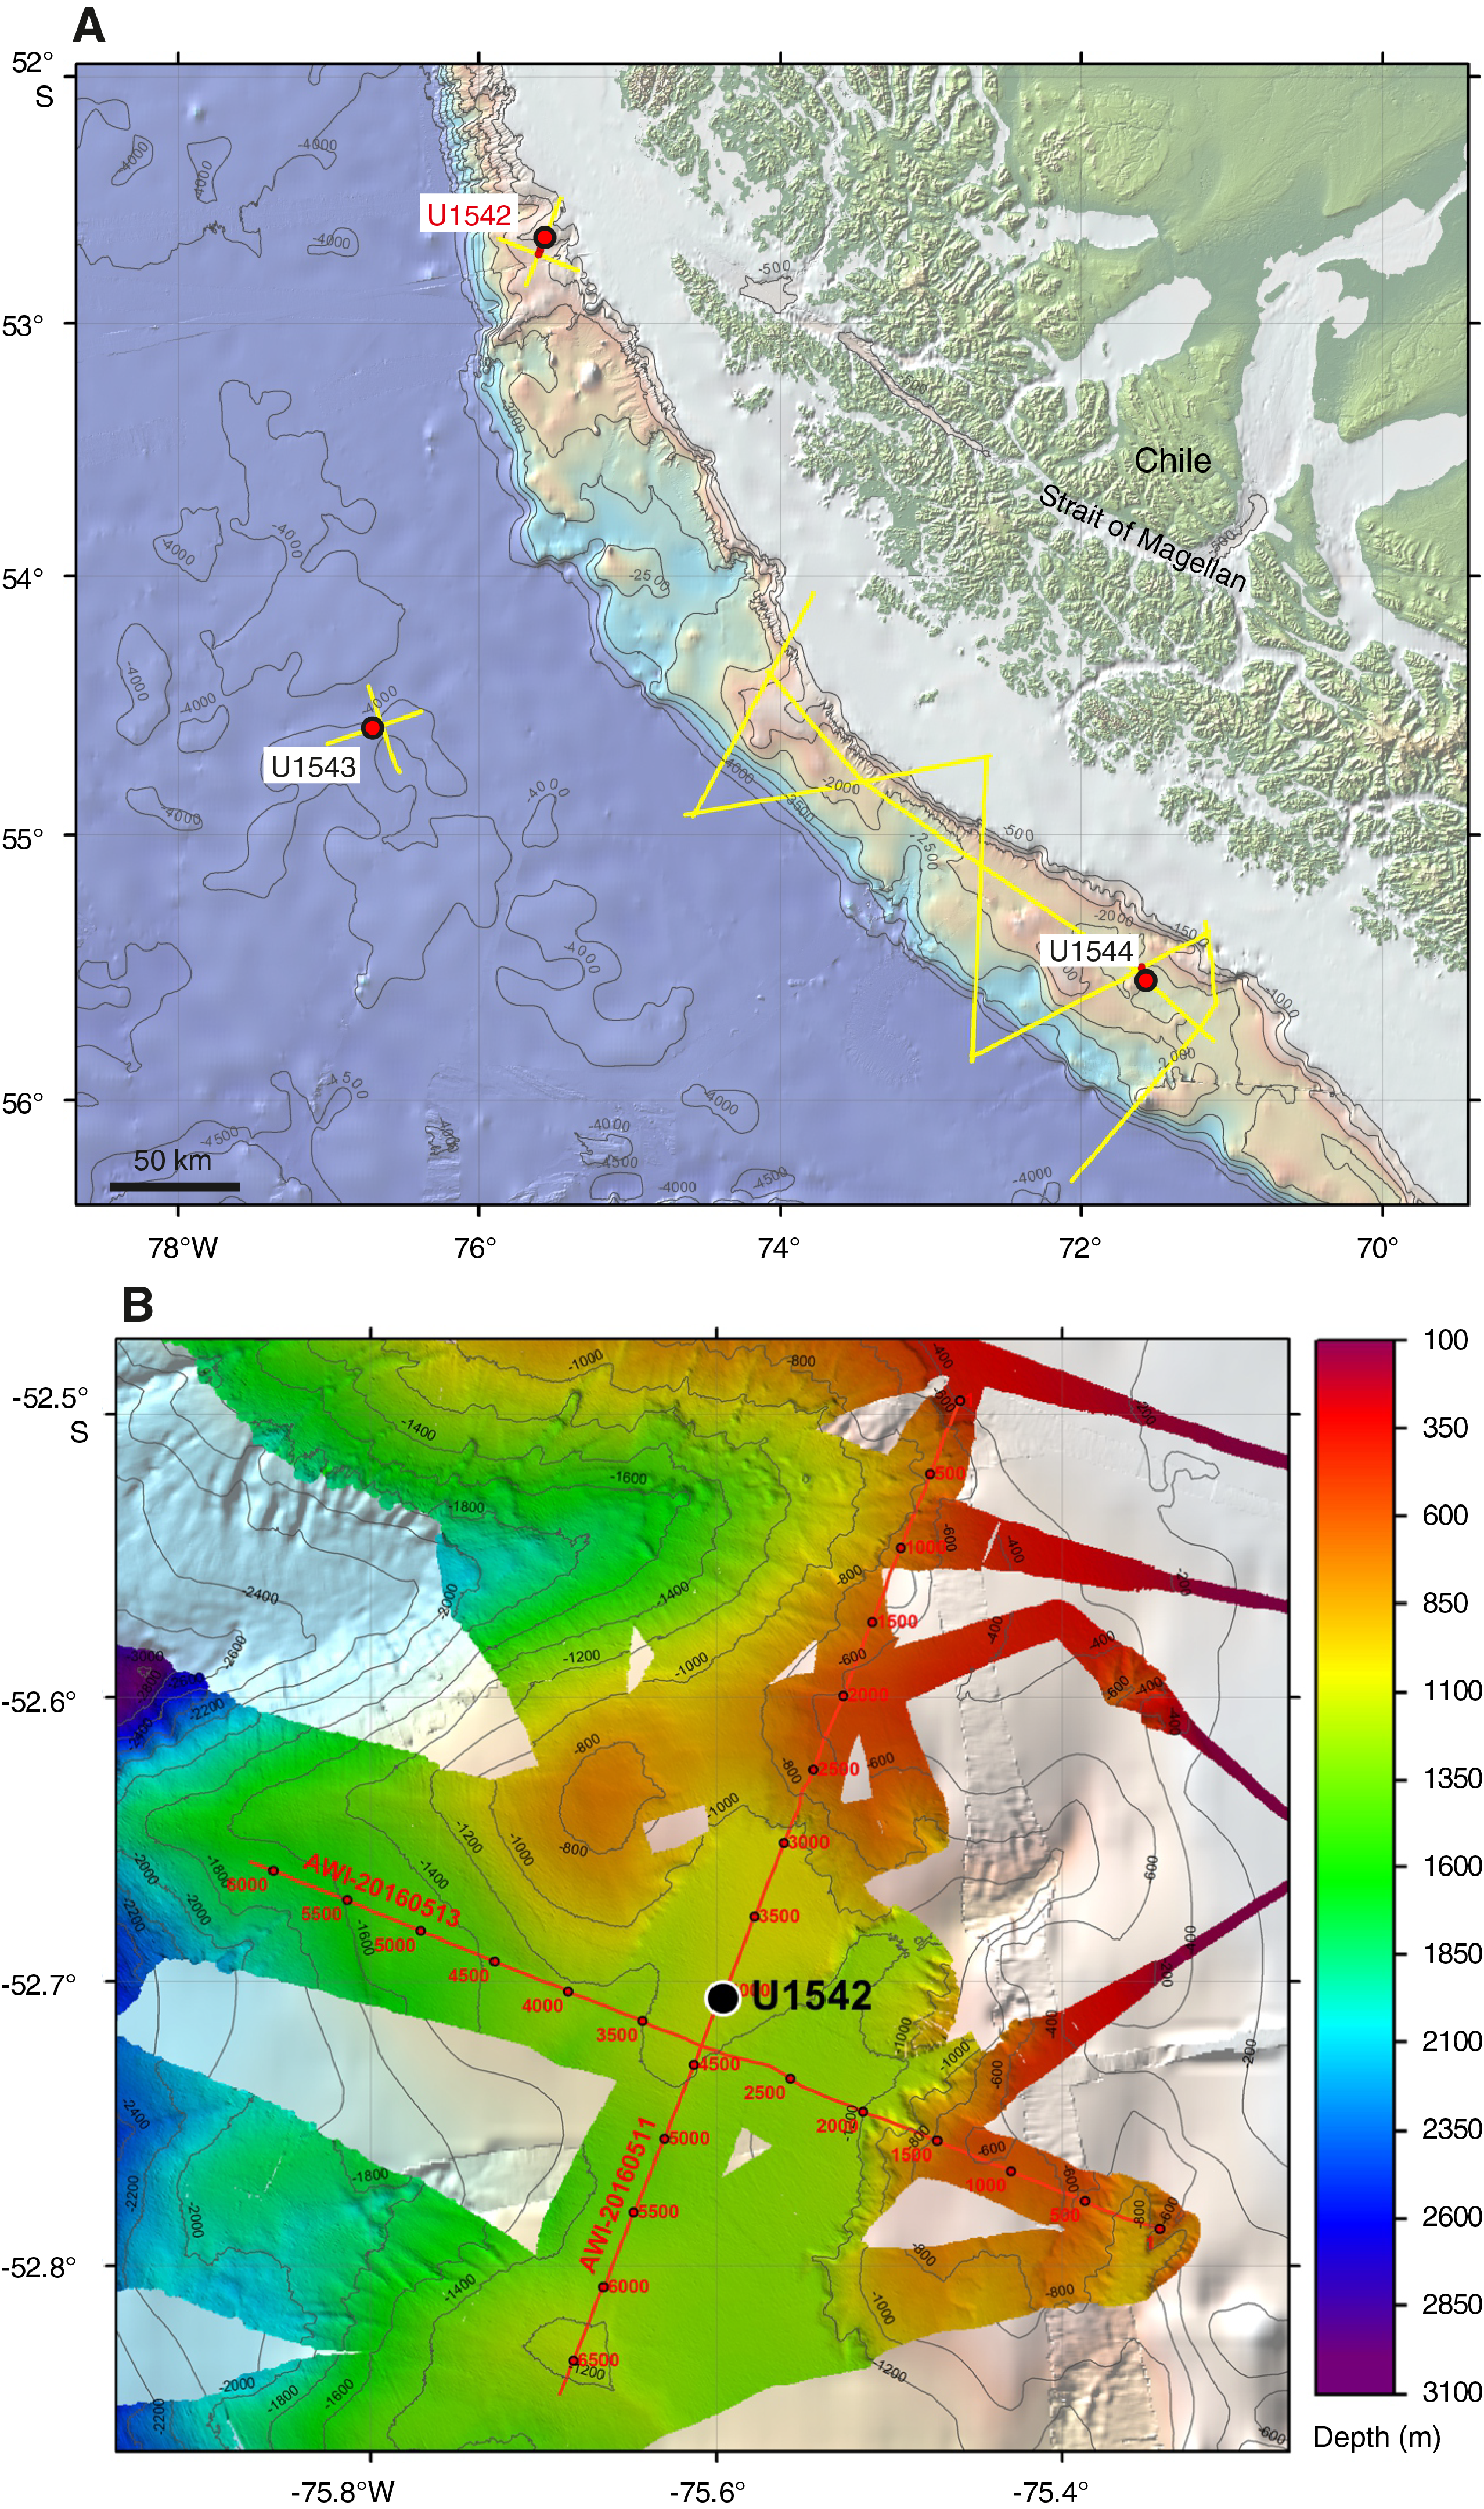
Figure F35. Oceanographic and bathymetric setting, Site U1542.
Site U1542 is located on MCS Line AWI-20160511 ~1 nmi north of the intersection with Line AWI-20160513 (Figure F36A) (Lamy, 2016). The seismic cross-lines indicate sediments as thick as ~700 m above continental basement. The basement age of the drift is unknown; a maximum age of ~10 Ma can be derived from the end of the tectonic erosion and start of subsidence at the continental margin (Polonia et al., 2007). Sediments are mostly well stratified with slightly irregular reflectors. Low to moderately reflecting layers become stronger below ~350 m sediment depth. Sediment echo sound (Parasound) profiles (Lamy, 2016) reveal moderate penetration (~50 m) with distinct layering (Figure F36B), suggesting a succession of fine- to medium-grained sediments with varying lithologic composition.
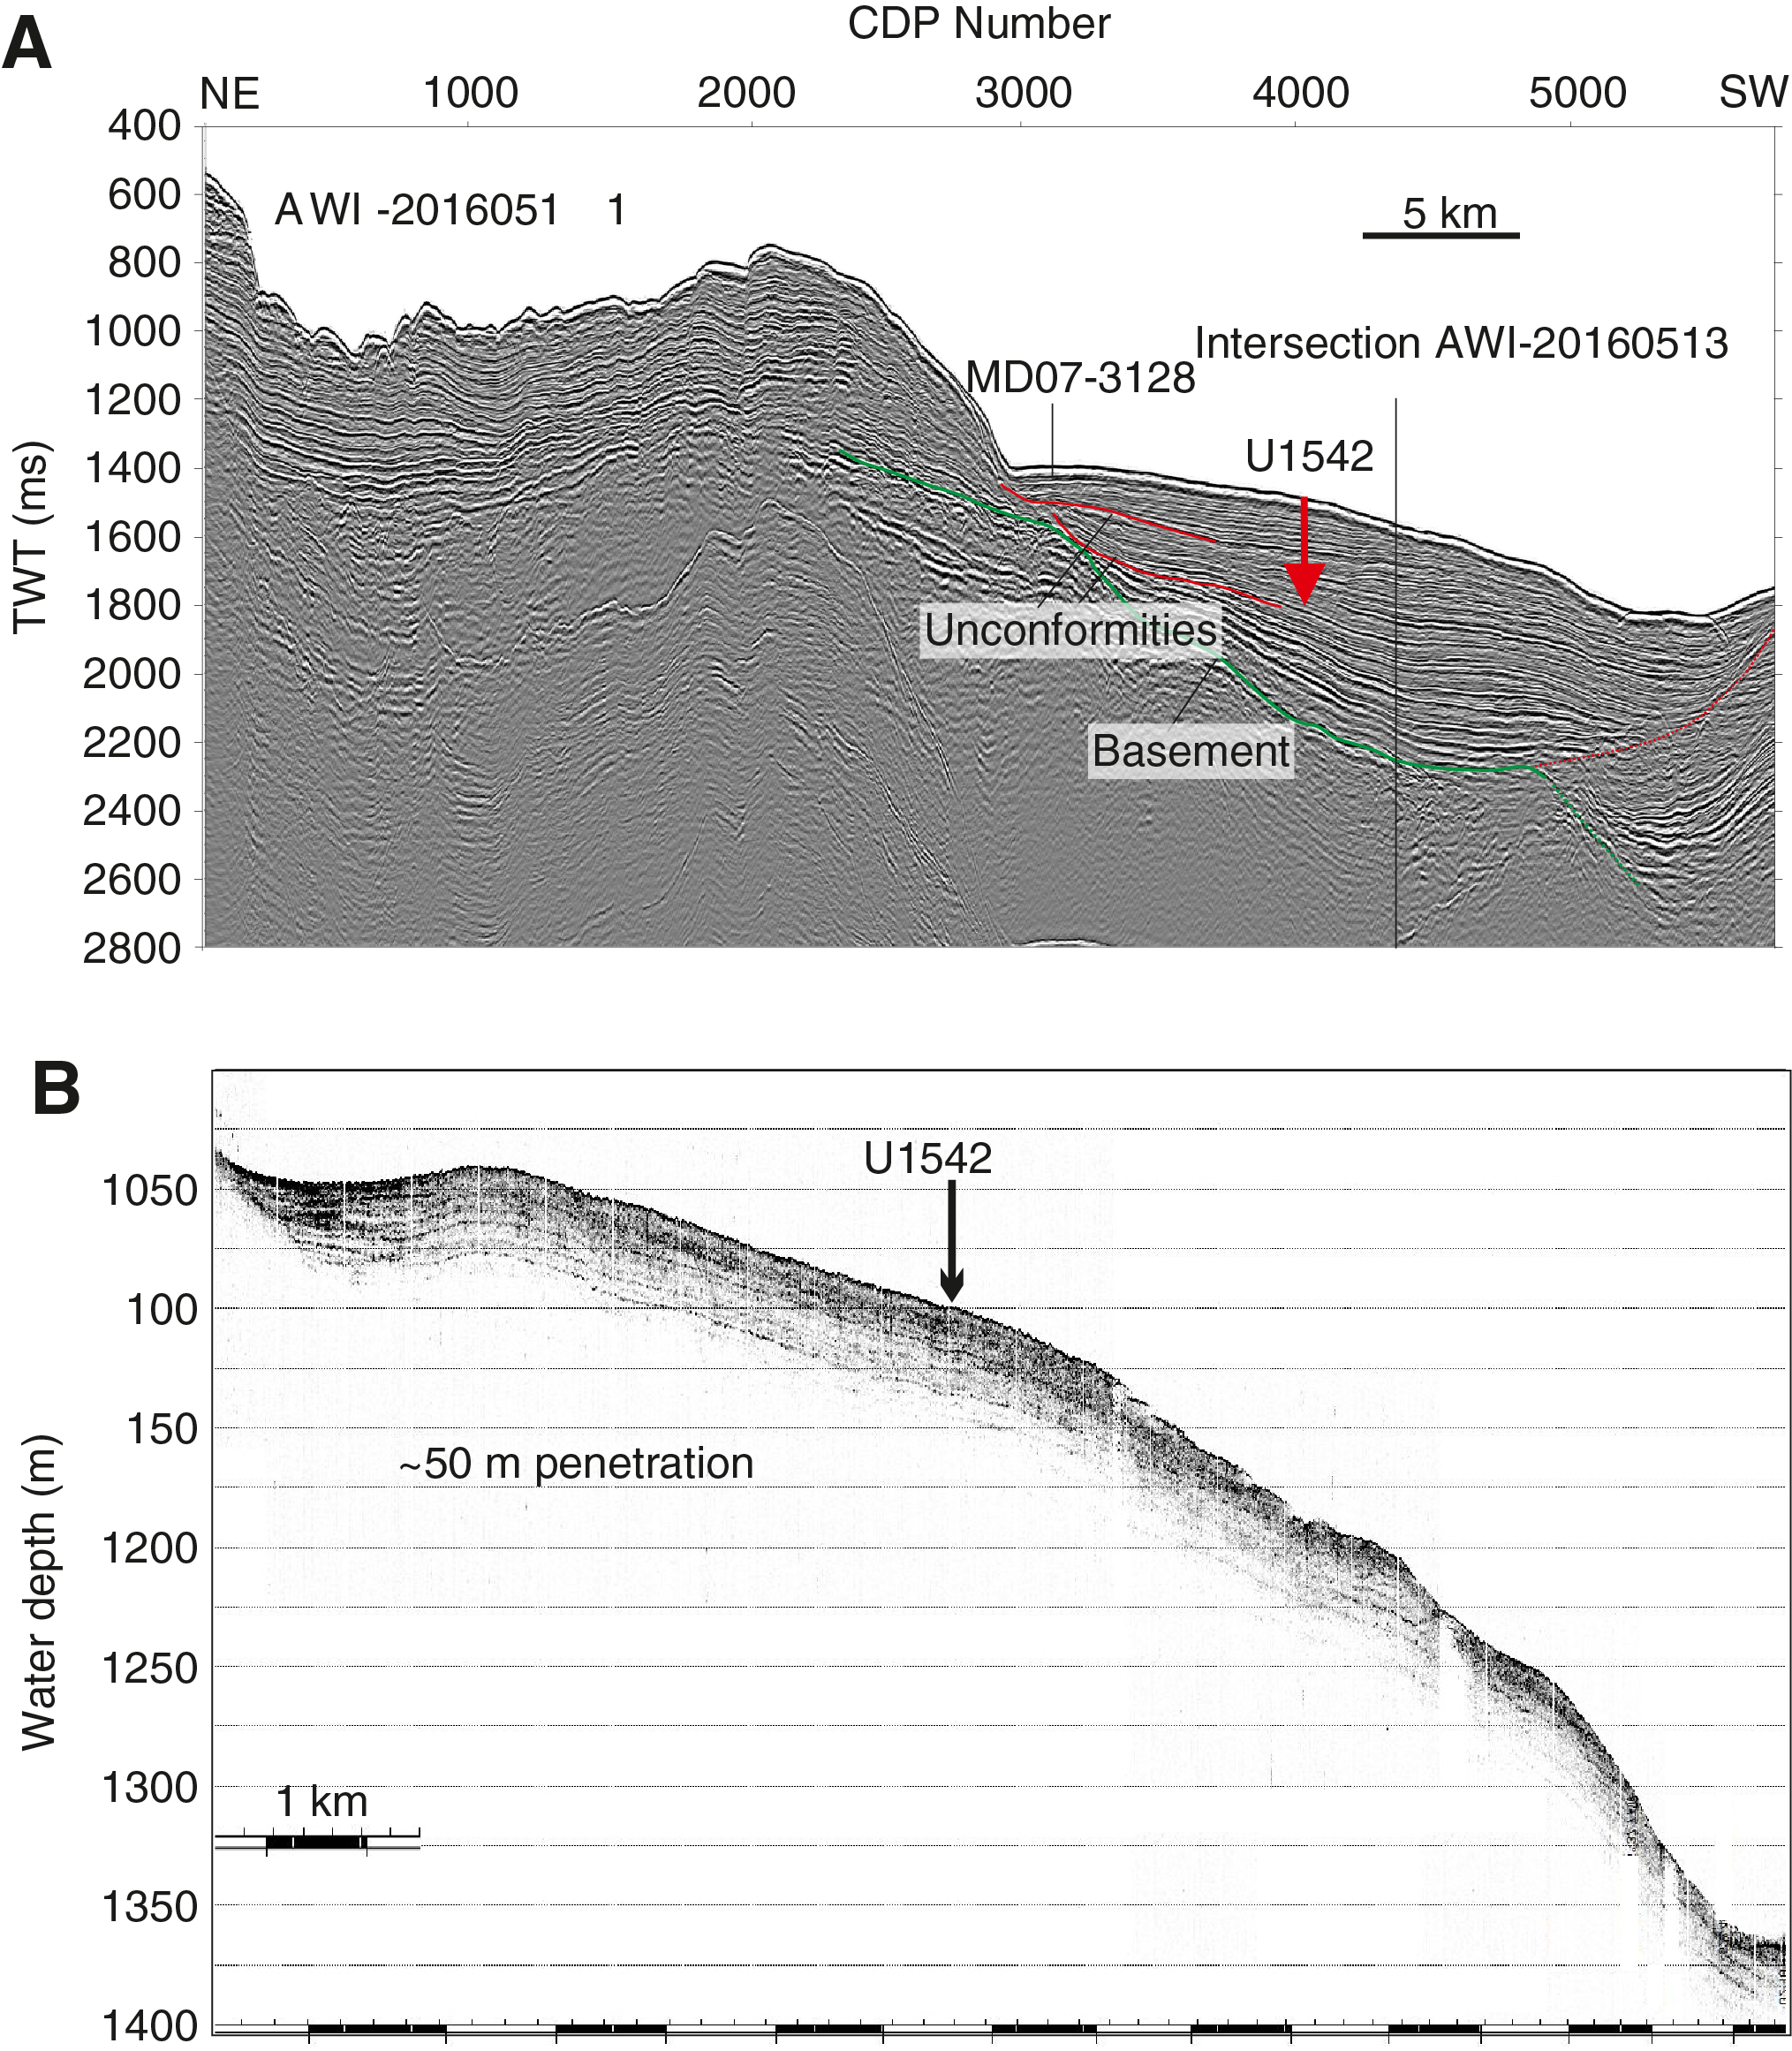
Figure F36. MCS and Parasound profiles, Site U1542.
Site U1542 is located underneath the southward-flowing CHC, a northern branch of the ACC that continues toward the Drake Passage and provides a major fraction of the present-day northern Drake Passage transport (Well and Roether, 2003). Satellite-tracked surface drifters reveal that after crossing the EPR, Subantarctic surface water of the ACC is transported northeastward across the ESP toward the Chile coast at ~45°S, 75°W (Figures F2, F37). Here, presently only a minor part of ACC water is deflected northward into the HCS, whereas the major fraction is deviated southward toward the Drake Passage. The CHC thus transports a significant amount of northern ACC water toward the Drake Passage in a narrow ~100–150 km wide belt along the coast (Chaigneau and Pizarro, 2005) (Figures F2, F37). Modern surface current velocities in the CHC reach >35 cm/s, and high flow speeds of ~20 cm/s extend to middepths (Boisvert, 1969; Chaigneau and Pizarro, 2005).
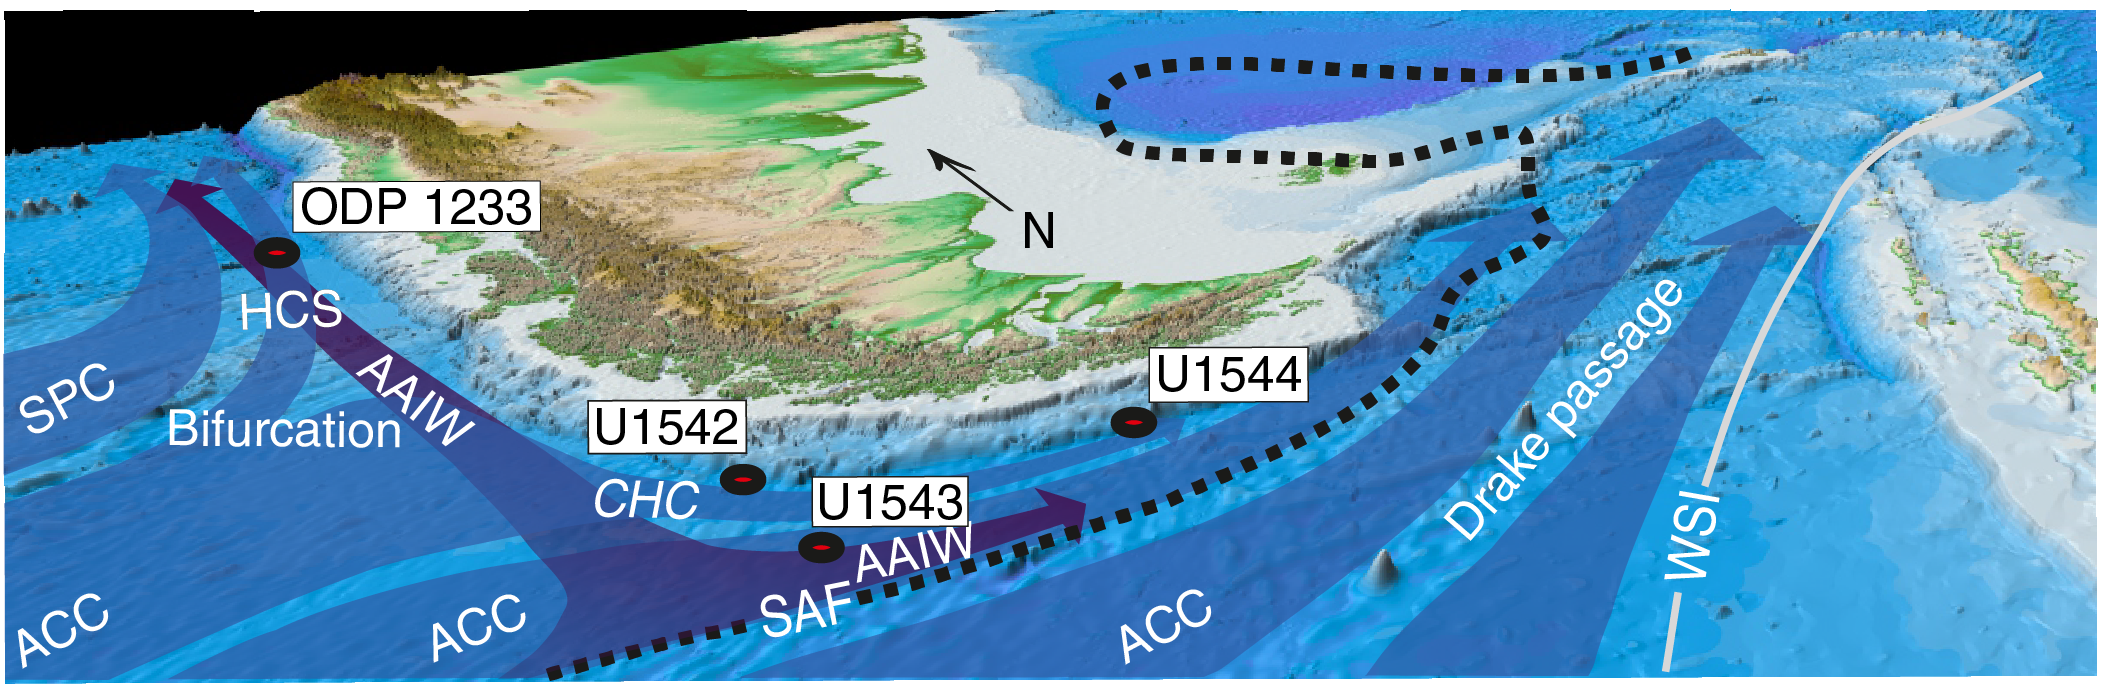
Figure F37. Major surface and intermediate water circulation.
Site U1542 is located at the lower limit of AAIW and lies close to or within the major modern AAIW formation area in the ESP (e.g., Bostock et al., 2013). CDW underlies AAIW in this region (Figure F38). The area off the Strait of Magellan is located ~5° latitude north of the present SAF. Modern mean annual SST in this area is ~8°C, and the seasonal range is ~3°C.

Figure F38. Modern oxygen distribution.
The main objectives at Site U1542 were to
- Recover Pleistocene paleoceanographic records over the past several glacial–interglacial cycles with suborbital-scale resolution,
- Reconstruct the strength of the CHC (Subantarctic ACC) before entering the Drake Passage,
- Investigate AAIW and CDW water mass properties,
- Investigate changes of continental paleoclimate, and
- Recover a potential near-field record of PIS variability.
Operations
Four holes were cored at Site U1542 using the full-length APC coring system: U1542A (0–169.5 m CSF-A; 181.74 m recovered; 107%), U1542B (0–1.4 m CSF-A; 1.46 m recovered; 104%), U1542C (0–213.7 m CSF-A; 225 m cored and 236.9 m recovered; 105%), and U1542D (0–234 m CSF-A; 202.7 m cored and 205.4 m recovered; 101%).
Transit to Site U1542
At 0236 h on 20 June 2019, the vessel got underway at full speed northeast of Site U1541 to avoid heavy weather headed toward the operational area. Taking advantage of the transit, we deployed the towed magnetometer. The vessel continued transiting on a northeasterly course for 1109 nmi over 4.7 days until 1845 h on 24 June when sea conditions allowed us to turn south towards our operational area at the southwest Chilean margin. During the northward transit on 21 June, we passed just 120 nmi east of Point Nemo, a remote ocean location that is the most distant from a coastline on our planet.
At 1845 h on 24 June, we set a southeast course toward Proposed Site CHI-1C, located at the southernmost Chilean margin close to the Pacific entrance of the Drake Passage. This provided the best ability to change course for Site U1542 or U1543 if the weather improved over those sites first. We continued on this course until 1230 h on 28 June, covering 873 nmi, when a strong system of high winds and seas was predicted to begin moving across the transit path and into the Chilean margin operational area, forcing us to stop at 48°44.0ʹS, 089°24.7ʹW. The thrusters were lowered to wait for the system to pass.
At 1300 h on 1 July, the weather system we were monitoring had moved past our projected course and subsided enough over the operational area in the Chilean margin resume transit for the remaining 575 nmi. The thrusters were raised, and we resumed navigation at 1330 h on a 122° southeast course to the southwest margin of Chile. At 1345 h on 2 July, we adjusted the heading to 109° southeast for Site U1542.
Hole U1542A
We arrived at Site U1542 at 1948 h on 3 July 2019. The thrusters were lowered, and the vessel switched into dynamic positioning mode by 2030 h. An APC/XCB BHA was made up and lowered to the seafloor. Based on a PDR reading of 1111.4 mbrf, an APC shooting depth of 1108.4 mbrf was chosen, and Hole U1542A was spudded at 0215 h on 4 July. Core 1H retrieved 7.1 m of sediment, determining the seafloor depth at 1110.8 mbrf (or 1099.8 mbsl).
APC coring continued until 165.6 m CSF-A (Cores 383-U1542A-1H through 19H), when the core barrel became detached from the sinker bars during retrieval. The core barrel fell ~50 m back to the landing seat. Three attempts were needed to finally retrieve the barrel. Once at the surface, we found that only 1.05 m of core was recovered, and we decided to switch to the HLAPC system to deepen the hole. The HLAPC system was used for one core, recording a partial stroke and recovering 3.91 m before the hole was abandoned because of high seas and winds. The bit was pulled to 1033 mbrf, clearing the seafloor at 2359 h on 4 July and ending Hole U1542A. A total of 20 APC and HLAPC cores were taken over a 169.5 m interval, recovering 181.74 m (107.2%).
Nonmagnetic core barrels and the core orientation tool were used on all cores. Formation temperature was measured on Cores 383-U1542A-4H, 7H, 10H, 13H, and 16H. Partial strokes were recorded on Cores 10H–13H and 16H–21F. The total time spent in Hole U1542A was 27.5 h (1.1 days).
Hole U1542B
The vessel waited on the seas and winds to calm from 0030 h to 1545 h on 5 July 2019 with the bit set at 1033 mbrf. The vessel was then offset 20 m east of Hole U1542A, the bit was lowered to 1104.0 mbrf, and Hole U1542B was spudded at 1745 h on 5 July. Core 1H recovered only 1.46 m of sediment, and because of the low recovery and quality of the core we decided to obtain a better mudline core, so Hole U1542B was abandoned.
Hole U1542C
The vessel stayed at the same coordinates, and the bit was lowered to 1105.0 mbrf. Hole U1542C was spudded at 1830 h on 5 July 2019. Based on the recovery from Core 1H (3.3 m), the seafloor was calculated at 1111.2 mbrf (1100.2 mbsl). APC coring continued to 169.3 m CSF-A with Core 20H. While running in with the core barrel for Core 21H, the Captain terminated operations because of high currents and winds. When the core barrel was retrieved, it was found that the pins had sheared and 3.57 m of core had been retrieved for an advance of 3.0 m.
At 0900 h on 6 July, the bit was pulled to 71.8 m CSF-A and the top drive was set back to wait on weather with the bit in the hole. The crew continued to wait on weather until the seas subsided at 1630 h. The top drive was picked up, the hole was washed to the bottom by 1815 h, and coring continued with Cores 383-U1542C-22H through 28H to 226.0 m CSF-A at midnight on 6 July.
A total of 26 cores were taken over a 217.0 m interval with two 4.5 m drilled intervals (9 m total drilled). A total of 228.91 m was recovered (106% recovery). Nonmagnetic core barrels were used with all cores, and the core orientation tool was removed after Core 383-U1542C-20H. A misfire was recorded on Core 8H, and partial strokes were recorded on Cores 10H, 12H, 13H, 16H, 17H, and 20H–28H.
Hole U1542D
The vessel was offset 20 m south of Hole U1542C, and the bit was spaced out to 1107 mbrf. Hole U1542D was spudded at 0600 h on 7 July 2019. Based on recovery from Core 1H, seafloor was calculated at 1111.7 m CSF-A (1100.7 mbrf). The hole then was cored to a total depth of 213.7 m CSF-A using the full-length APC system, and three intervals were drilled without recovery over a total of 11.0 m to help eliminate gaps in core coverage between holes. After reaching total depth, the bit was recovered to the surface, clearing the seafloor at 0245 h and the rotary table at 0545 h on 8 July. The BHA was racked back in the derrick, and the rig floor was secured for transit at 0555 h. The vessel was switched from dynamic positioning to cruise mode at 0558 h, ending Hole U1542D and Site U1542.
Nonmagnetic core barrels were used on all cores, but no orientation or temperature measurements were taken. Partial strokes were recorded on Cores 383-U1542D-10H and 12H–27H. A total of 24 cores were taken over a 202.7 m interval with 205.4 m of recovery (101.2%). Three drilled intervals were used following Core 12H, 22H, and 24H. The hole was advanced by recovery on all partial strokes.
Principal results
A ~249 m spliced sedimentary sequence of Holocene–middle Pleistocene age was recovered at Site U1542 from Holes U1542A–U1542D (Figure F39). It comprises five lithofacies, one of which was identified at previous Expedition 383 sites in the central South Pacific (nannofossil ooze; Lithofacies 4). New lithofacies include clayey silt to silty clay (Lithofacies 8), carbonate- and/or sand-bearing clayey to sandy silt (Lithofacies 9), foraminifers and sand- and/or clay-bearing silty nannofossil ooze (Lithofacies 10), and sand (Lithofacies 11). Site U1542 is characterized by exceptionally high sedimentation rates that exceed 30 cm/ky. The entire recovered sedimentary sequence (~249 m) can be described as one lithostratigraphic unit (Unit I) that covers the middle Pleistocene to Holocene interval. Sediments at Site U1542 are of siliciclastic nature. The sedimentary sequence at this site is dominated by dark gray to dark greenish gray clayey silts or silty clays, whereas thin beds of light greenish gray to light gray nannofossil ooze occur infrequently (Figure F40). Below 50 m CSF-A, intervals as thick as 3 m of interbedded clayey silt and sand appear recurrently. In addition, thin, light gray, foraminifer-bearing calcareous ooze, clay-bearing silty nannofossil ooze, and foraminifer-rich nannofossil ooze were observed below 95 m CSF-A.
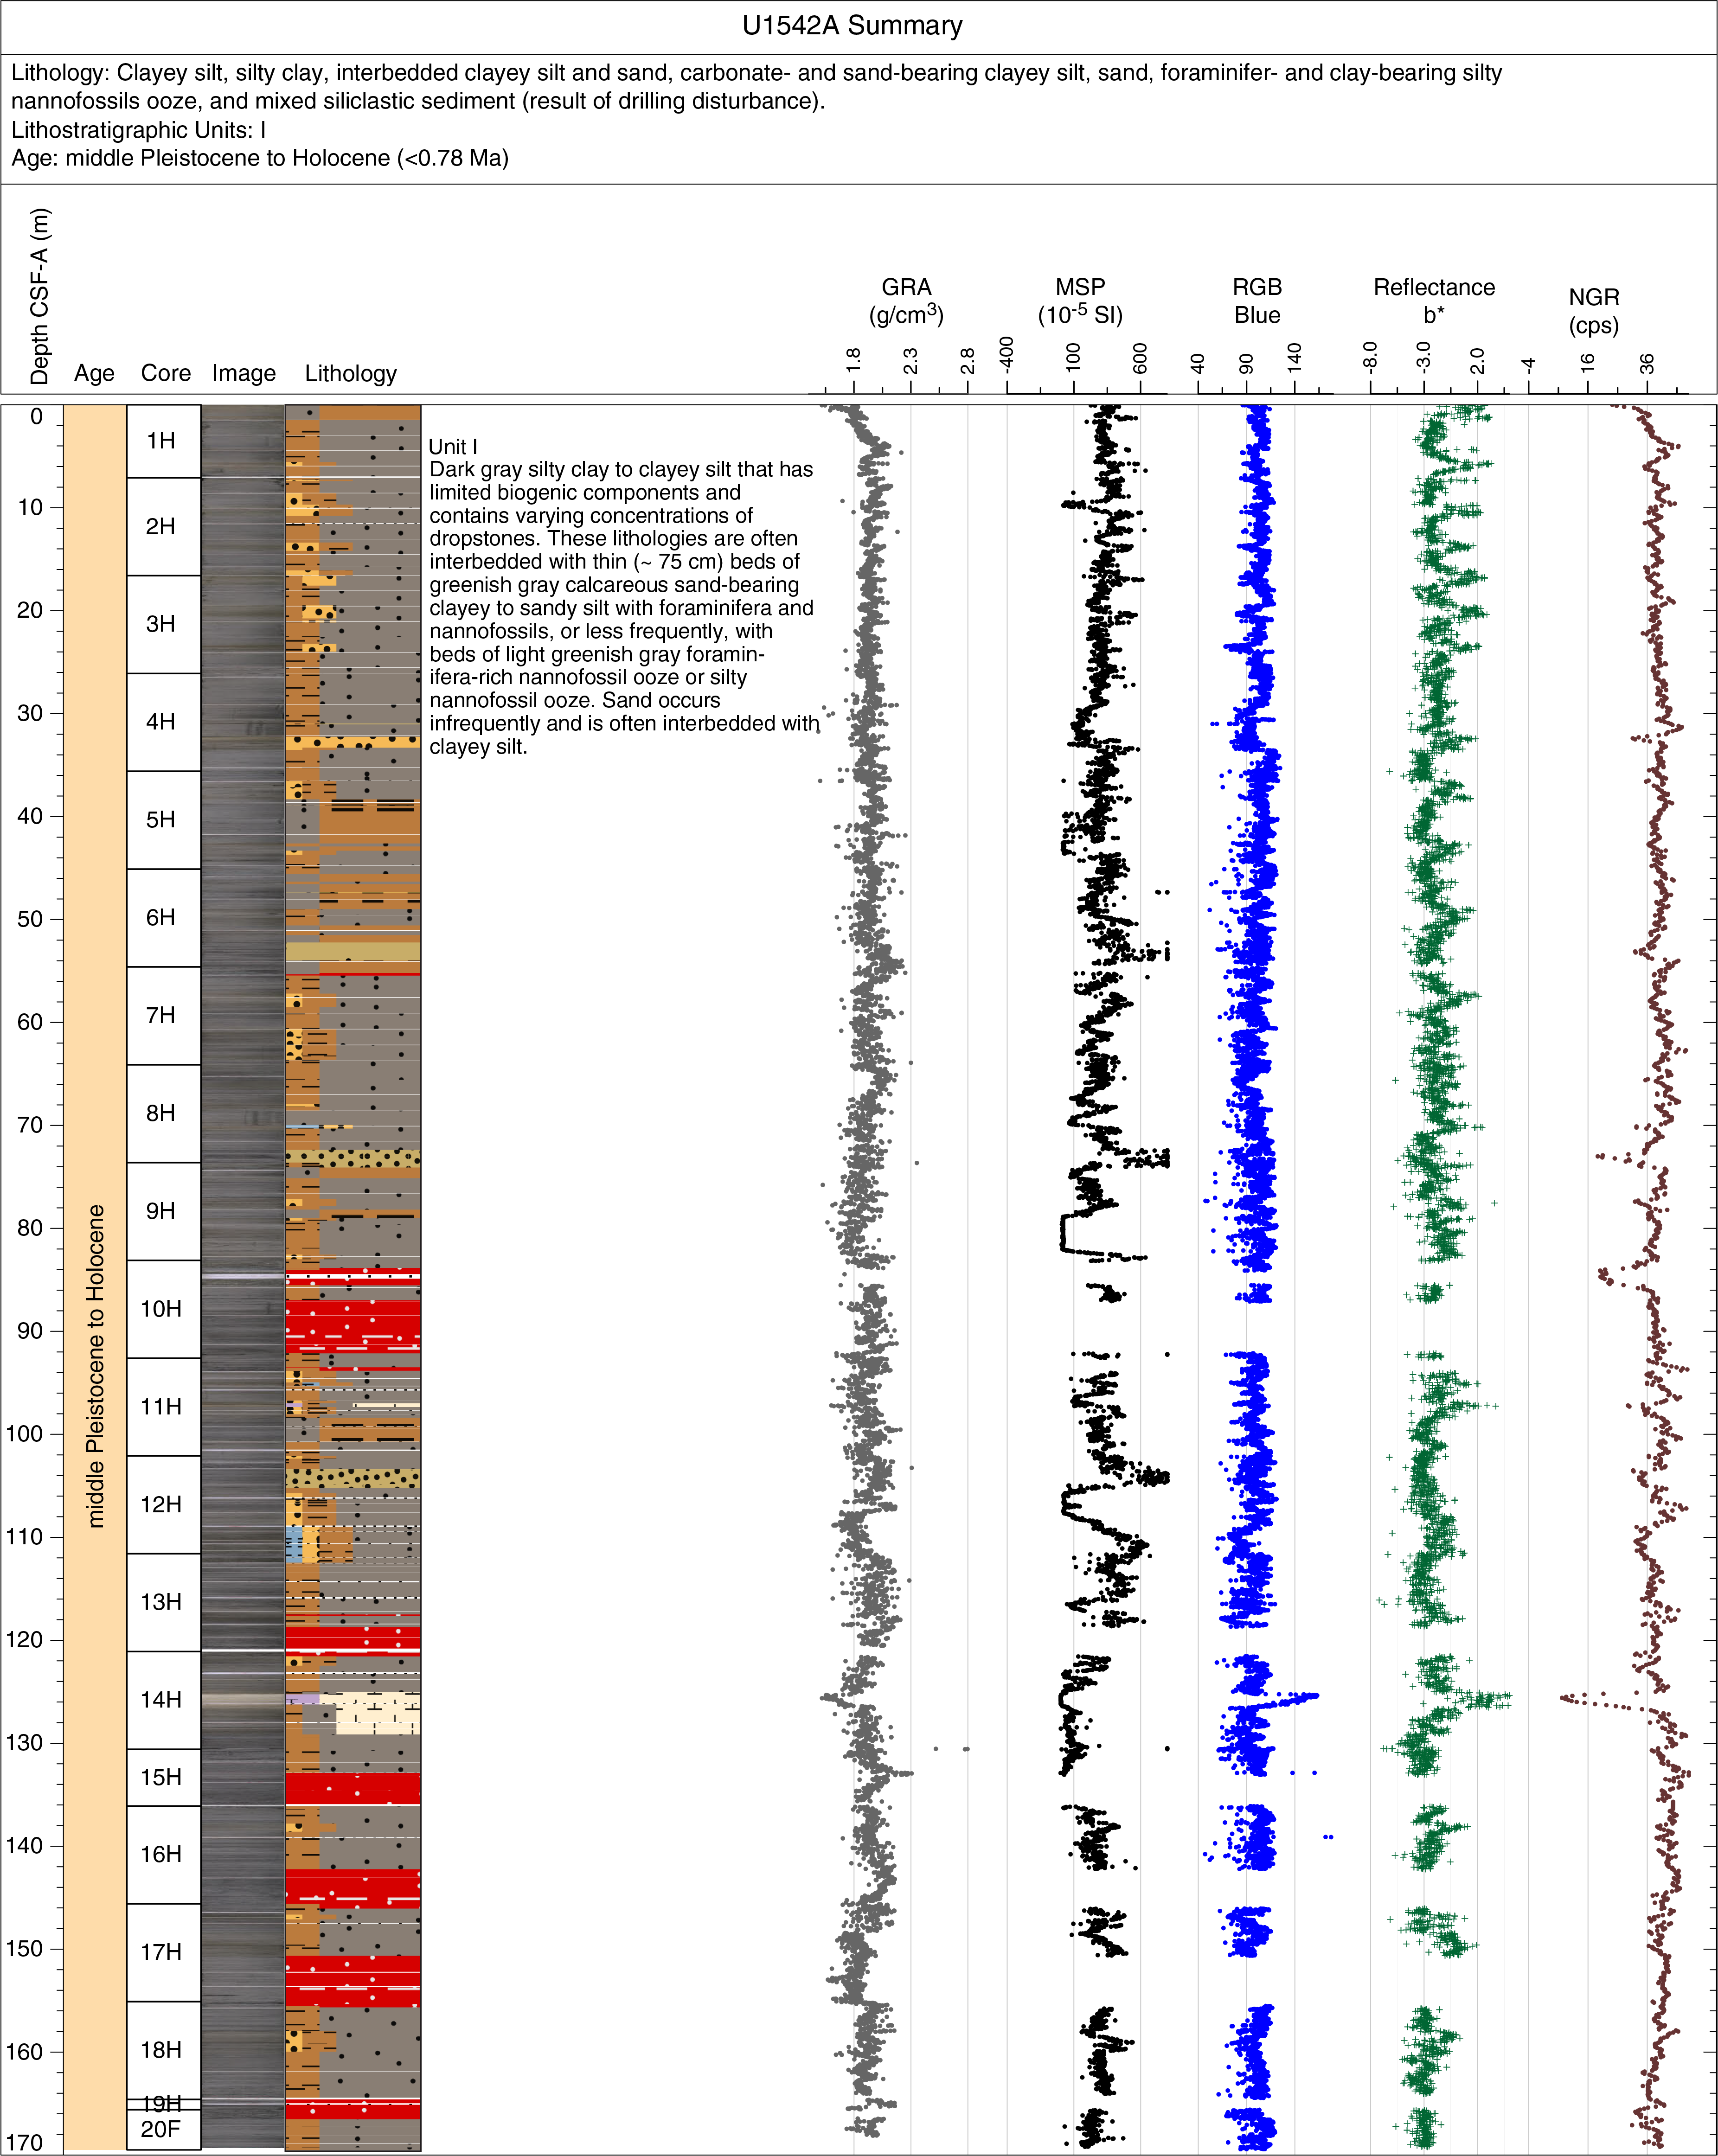
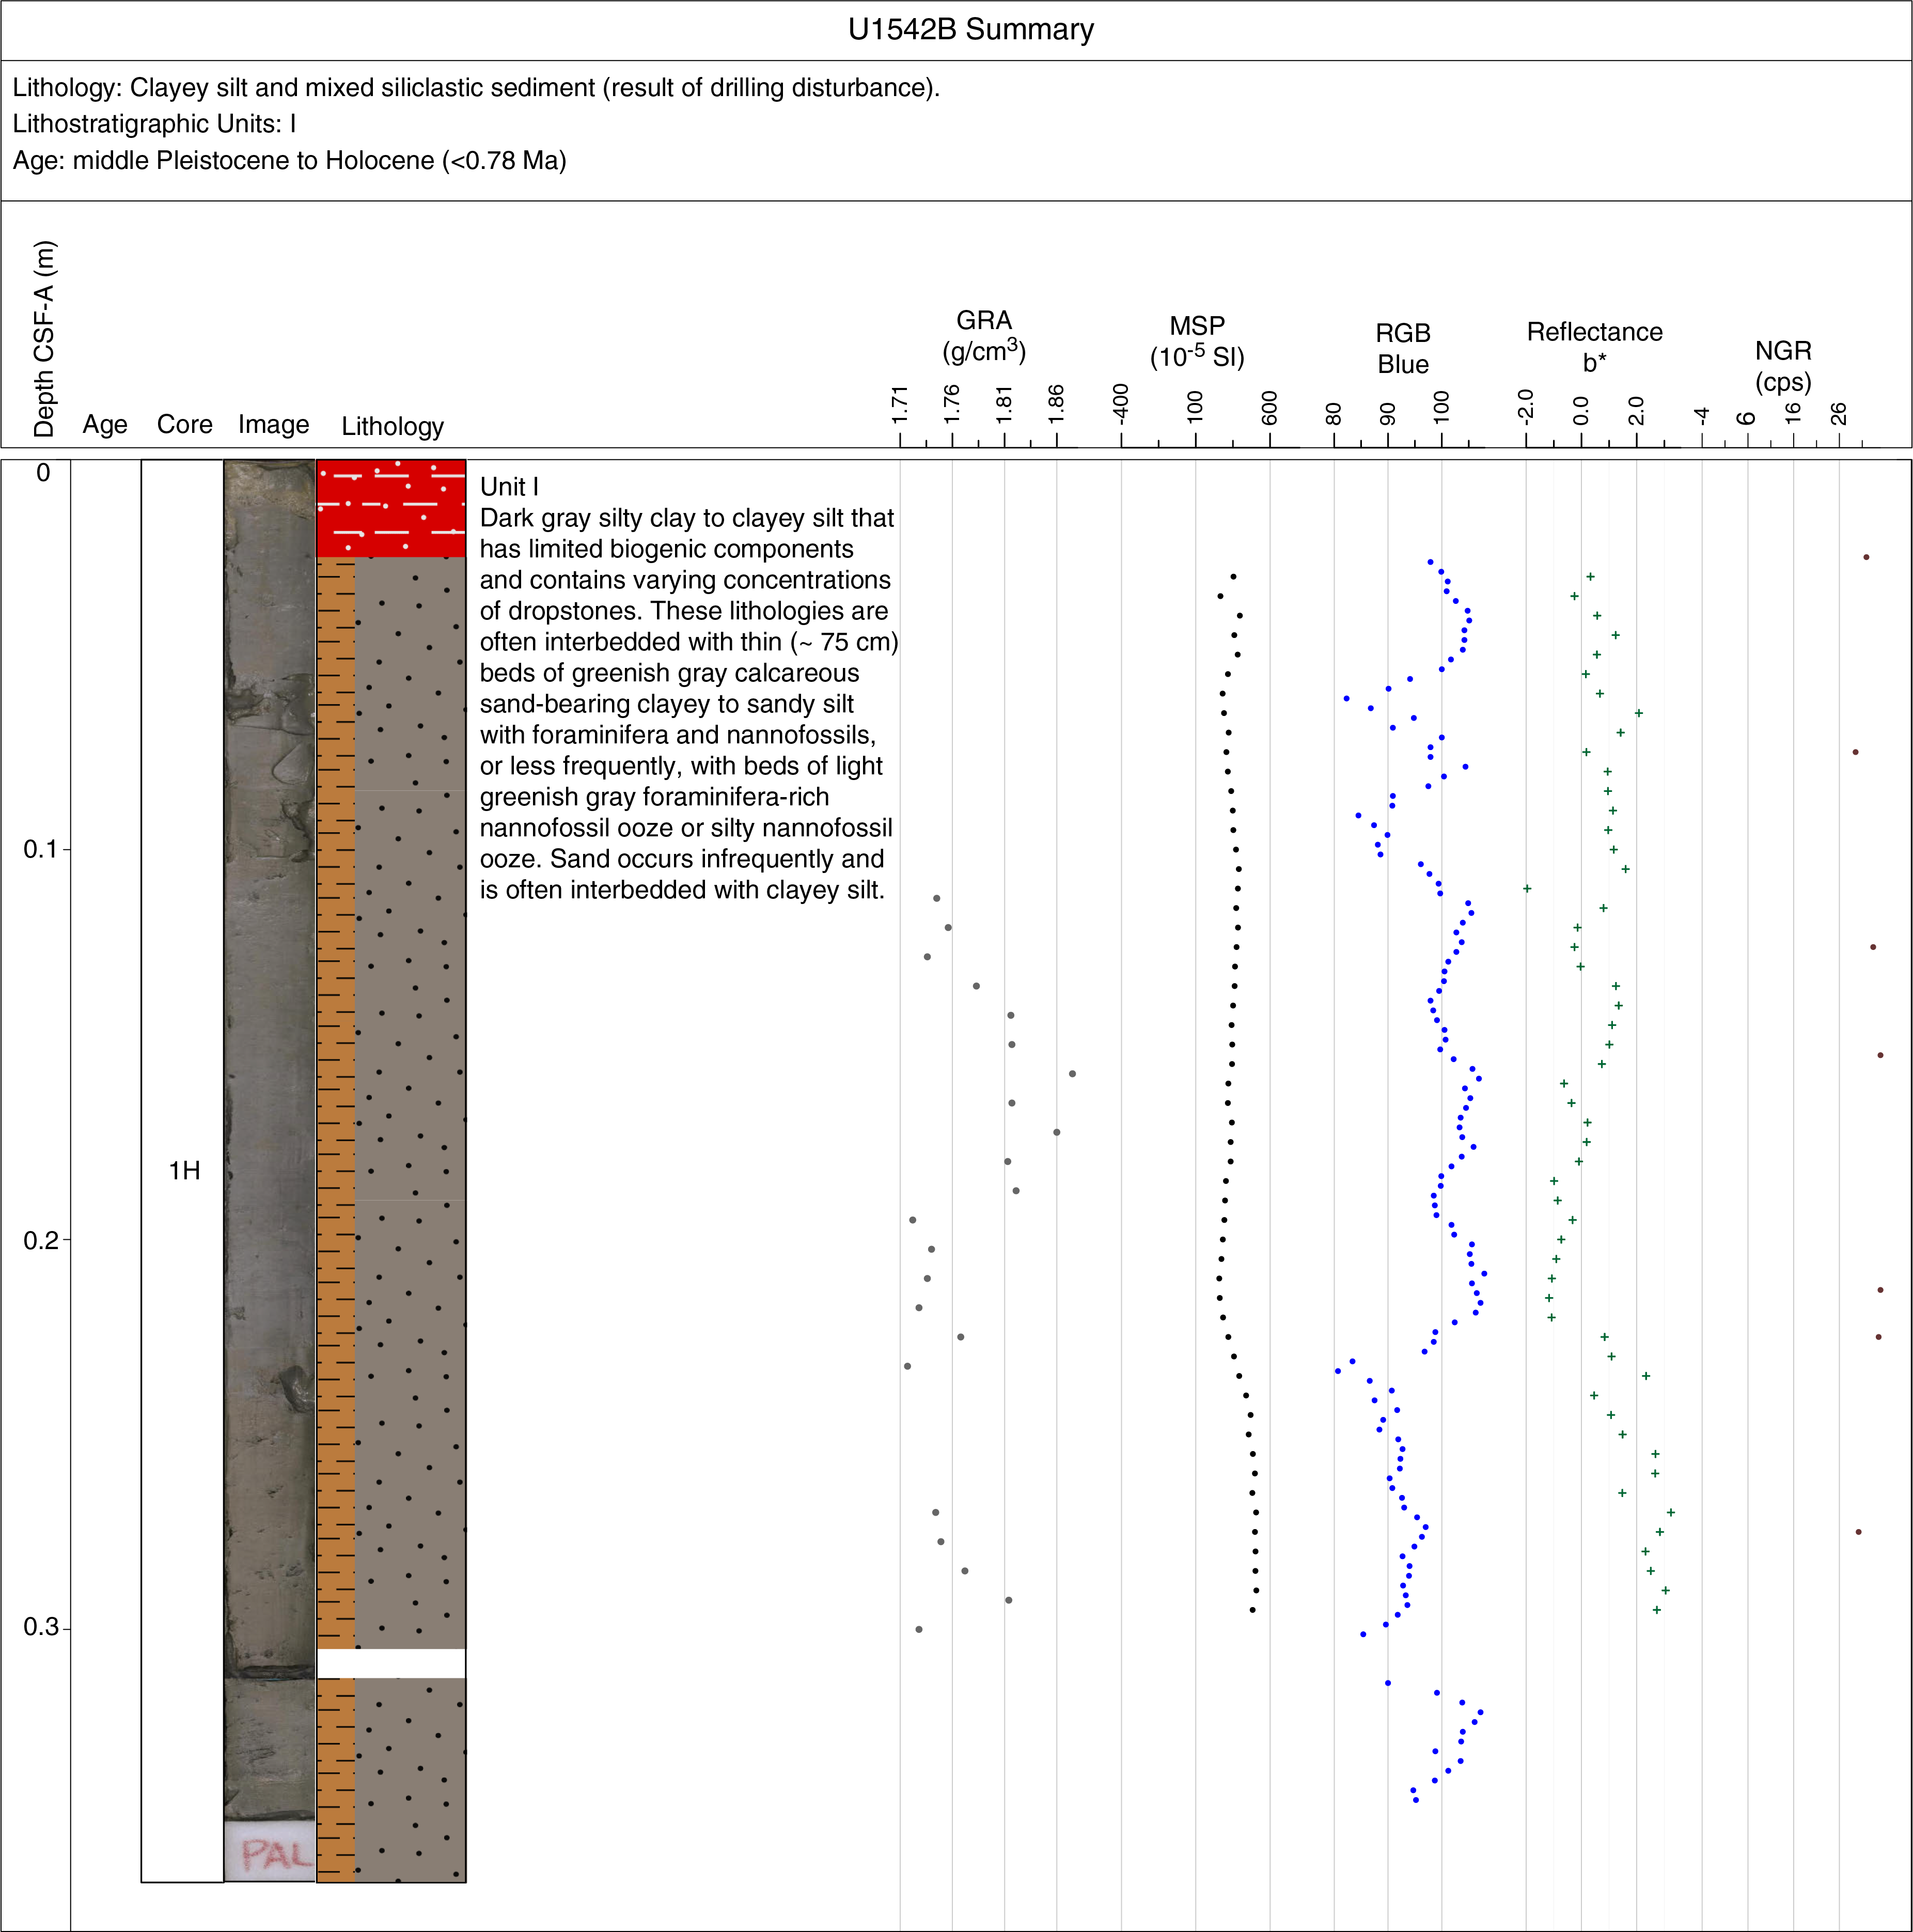
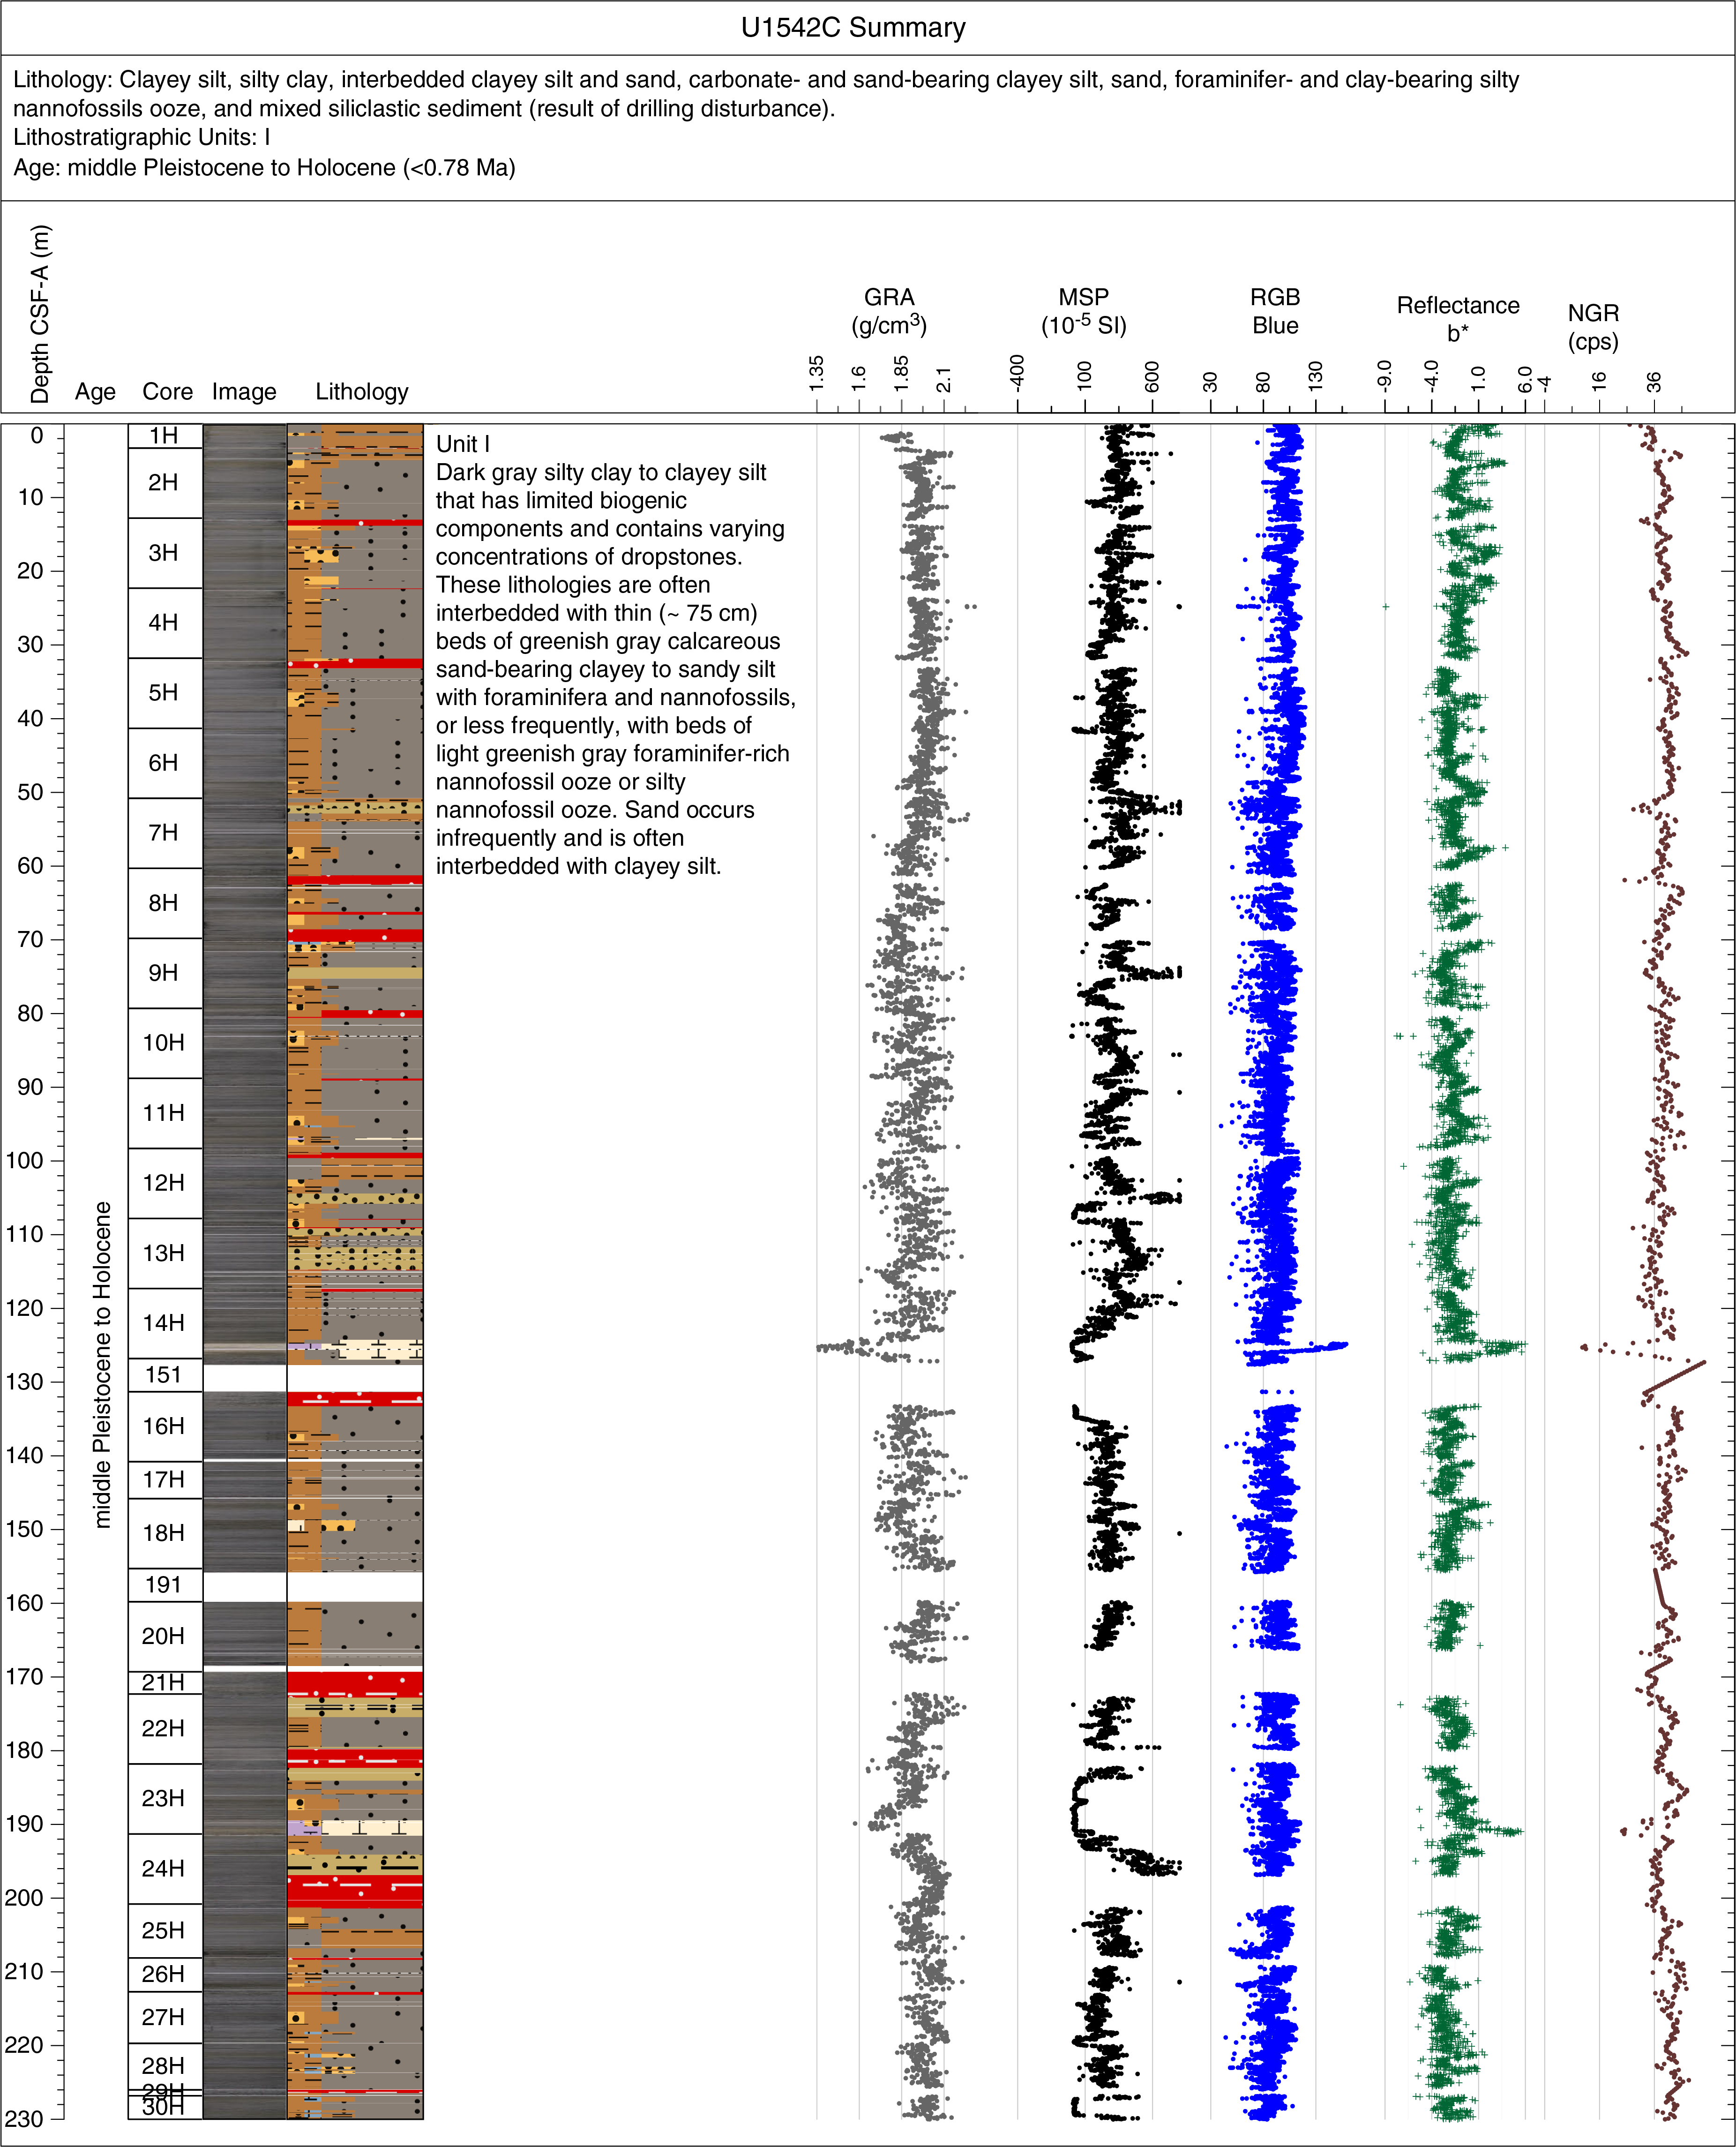
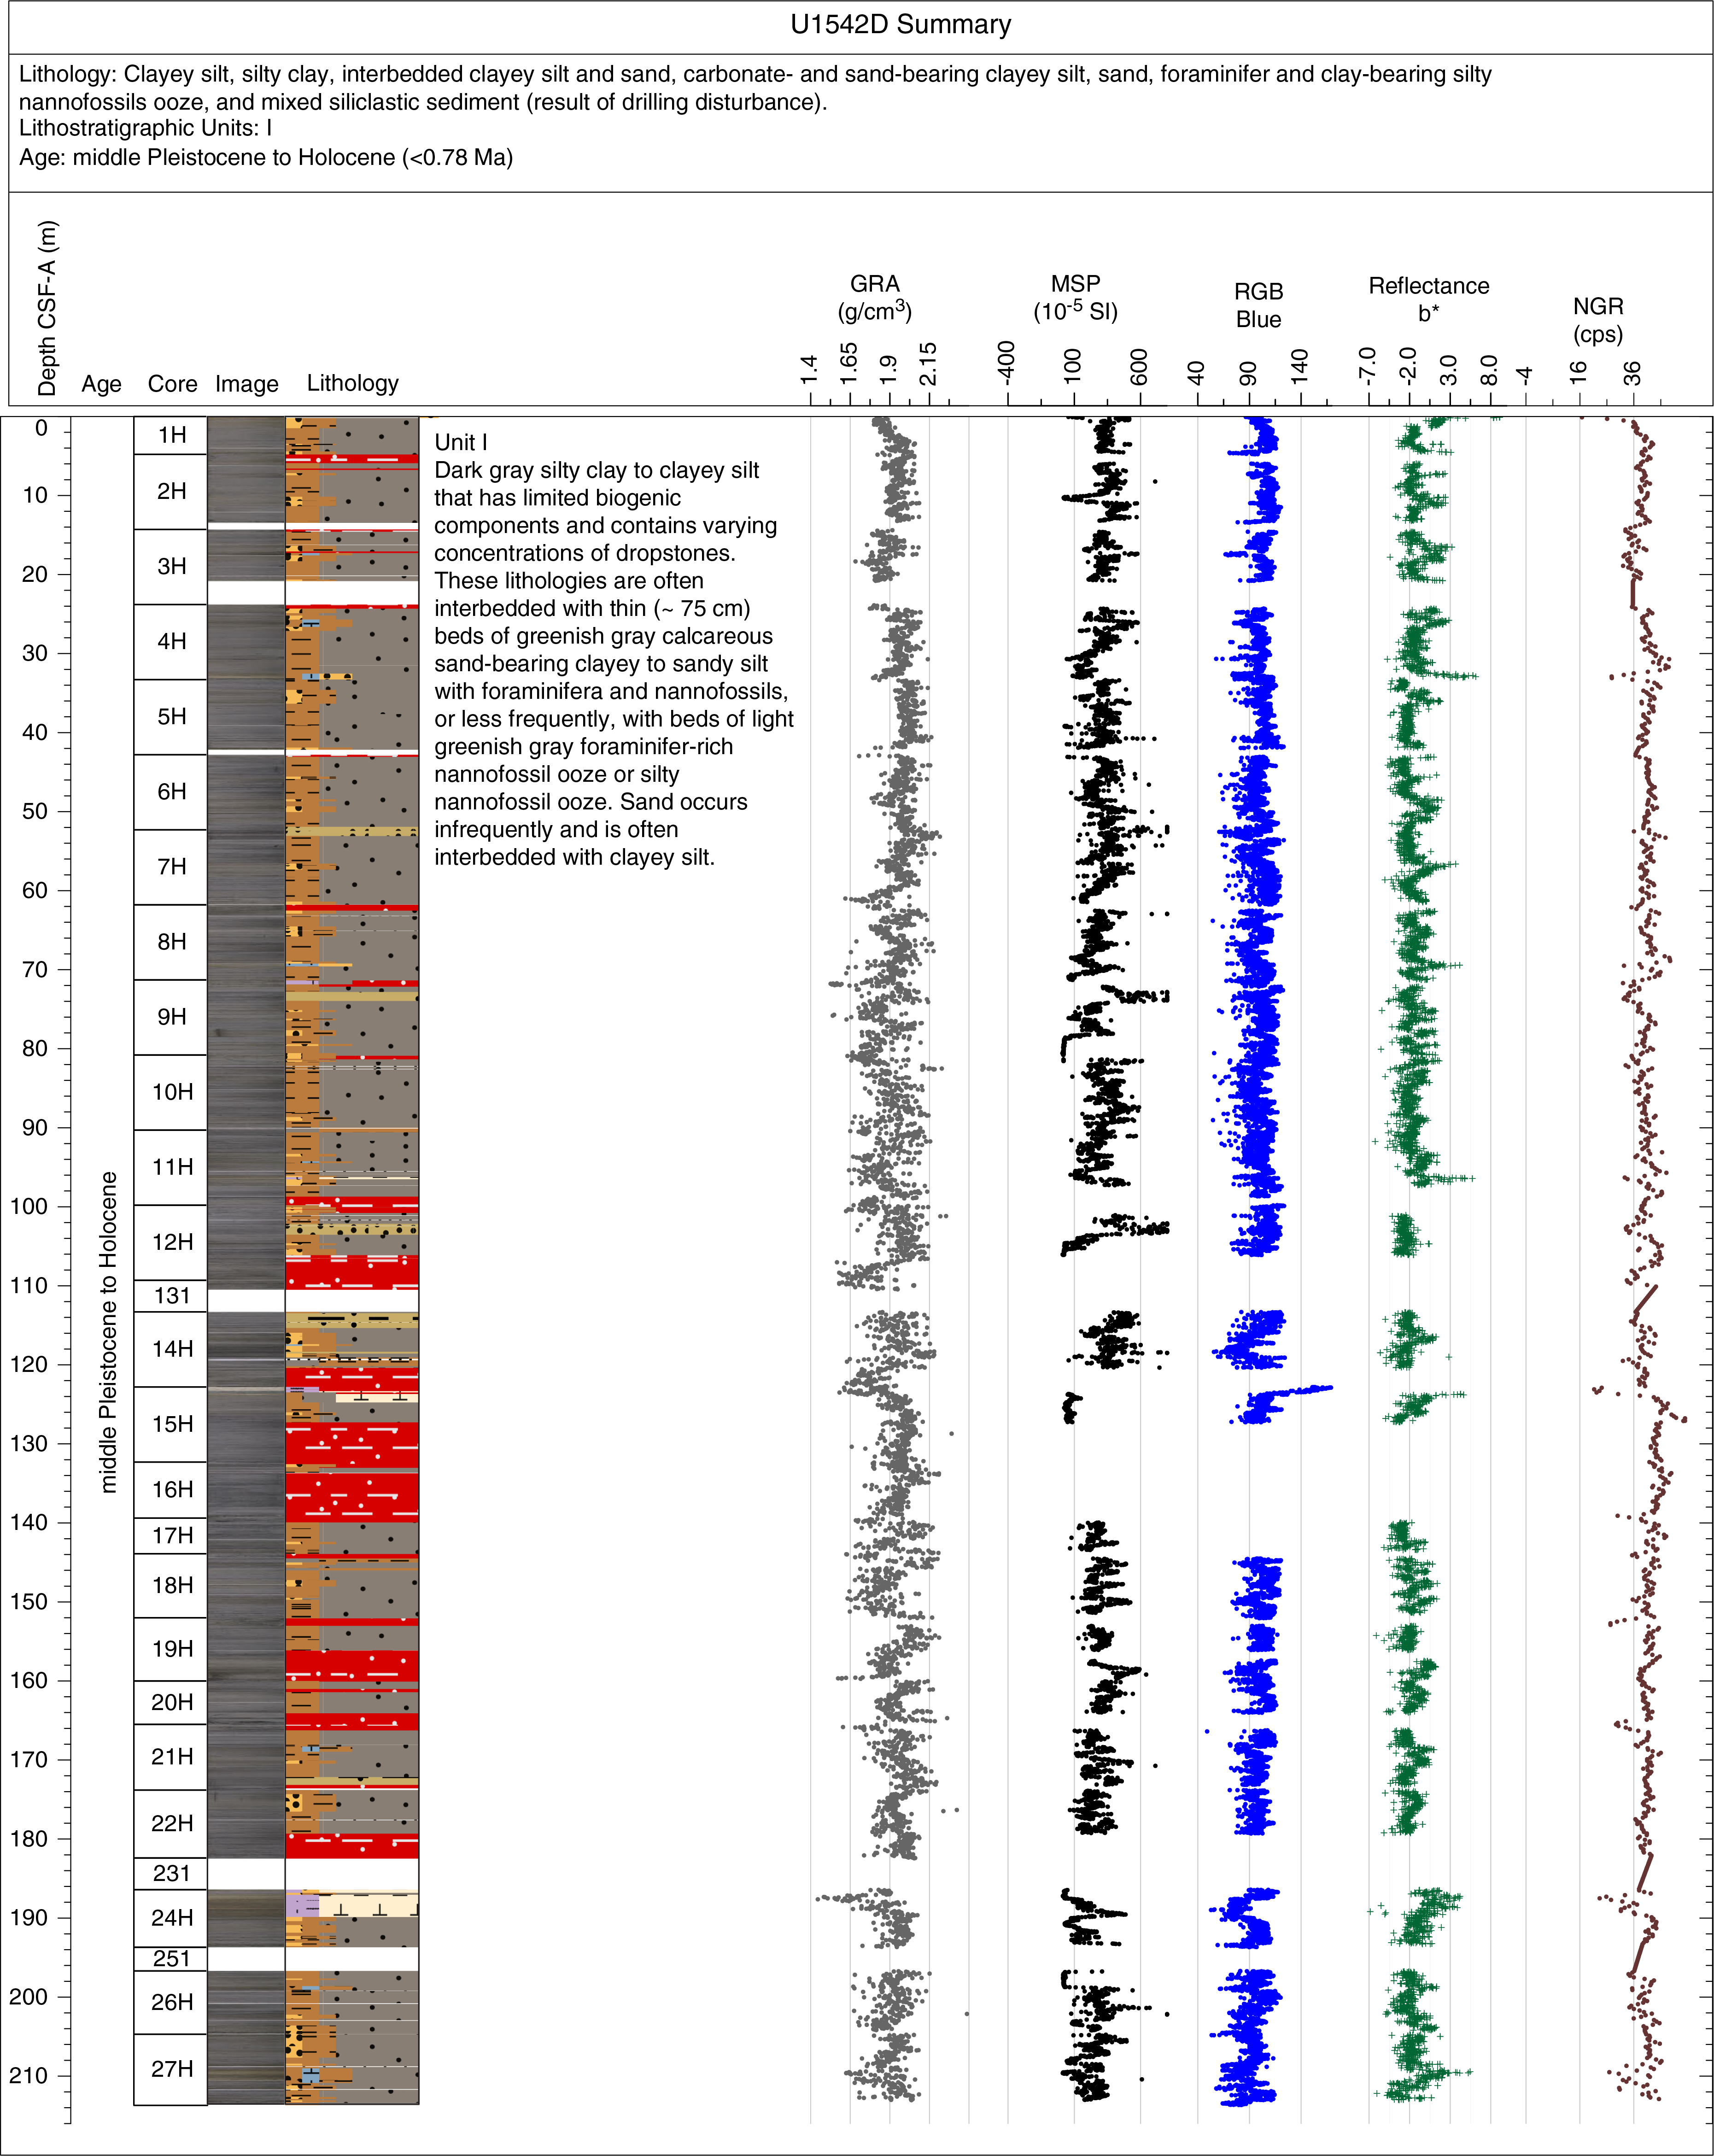
Figure F39. Hole summaries, Site U1542.
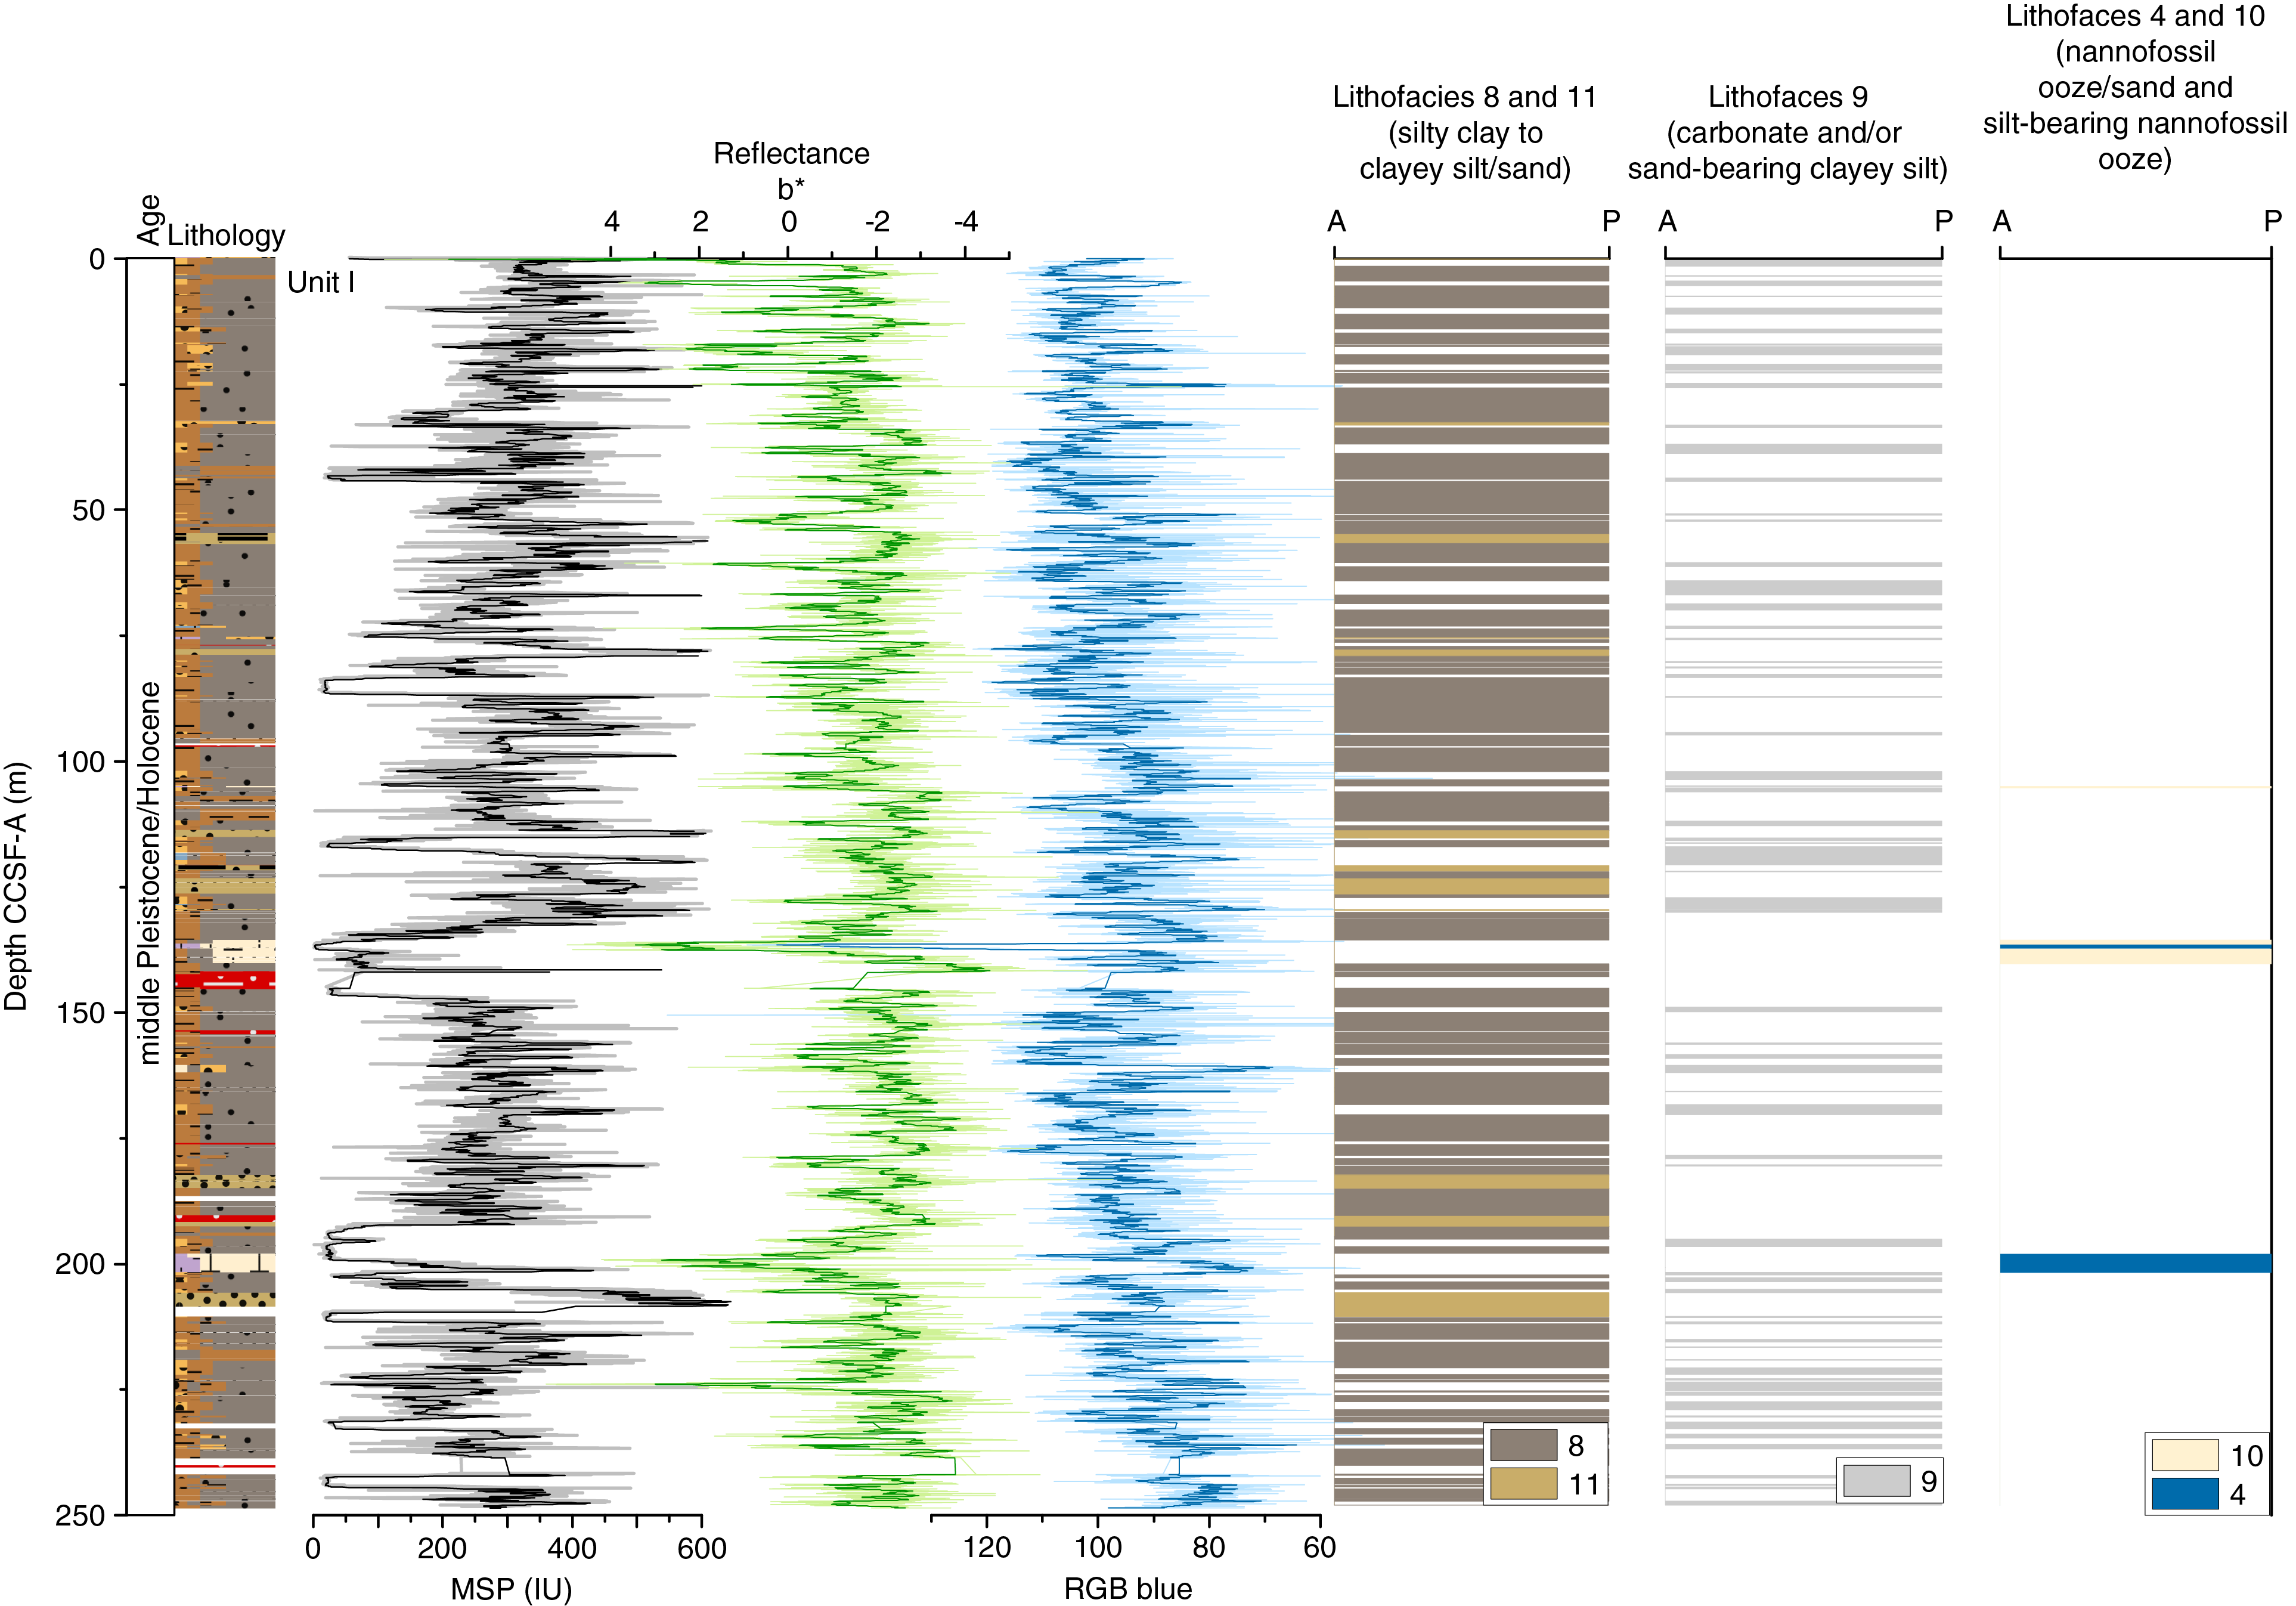
Figure F40. Primary lithostratigraphic variations, Site U1542.
Diatoms and radiolarians are rare throughout the sediment succession, silicoflagellates are absent, nannofossils are few to barren, benthic and planktonic foraminifers are abundant, and ostracods are sparsely present in some intervals at the site. The biostratigraphic age model for Site U1542 was mainly based on biostratigraphic analyses of core catcher and split-core samples from Hole U1542A (0–169 m CSF-A) and the bottom of Hole U1542C (172.3–234.0 m CSF-A). In total, eight biostratigraphic events were recognized that indicate an estimated age of ~0.7 Ma at the bottom of Hole U1542C.
The NRM of the archive-half sections of Site U1542 was measured and remeasured after alternating field (AF) demagnetization at 2 cm increments. In general, the number of demagnetization steps reflect
- The desire for more steps to study the magnetization(s),
- The severity of the drill string and natural overprints that hopefully can be removed to recover the natural remanence,
- The desire to use low peak fields to preserve the magnetization for future shore-based studies, and
- The need to maintain core flow through the laboratory.
After demagnetization, the intensity correlates with neither MS nor intensity prior to demagnetization, suggesting that the large drill string overprint was successfully removed and a geomagnetic signal was recovered. Inclinations are steep and positive prior to demagnetization and steep and negative after, suggesting, as with the intensity data, that a vertical (+z) drill string magnetic overprint was removed, giving way to a primary remanence that varies around expected directions (−69°) for the site latitude during normal polarity. The NRM after 15 mT shows no evidence for reversed polarity, suggesting that Site U1542 sediments are younger than 0.781 Ma (Hilgen et al., 2012). Shore-based studies will verify these interpretations and further develop these sediments as geomagnetic recorders, providing information on field intensity and directional variability while facilitating the next iteration in magnetic stratigraphy.
Routine safety hydrocarbon measurements were collected at Site U1542 in headspace gastight vials at a resolution of approximately one 5 cm3 sample per core for Holes U1542A and U1542C (5.98–230.99 m CSF-A). Methane concentrations increase rapidly from 4.39 ppmv at 5.98 m CSF-A to 60,786 ppmv at 60.66 m CSF-A and decrease gradually to 5,667 ppmv at 230.99 m CSF-A. Ethane occurs from 60.66 to 100.77 m CSF-A and from 128.04 m CSF-A to the bottom of Hole U1542C. The strong degassing of sediments after coring produced many cracks and affected the core quality at Site 1542.
The interstitial water chemistry at this site is influenced by anaerobic organic matter remineralization. As oxygen is depleted with depth by respiration, nitrate, manganese, and iron serve as terminal electron acceptors in organic matter remineralization. Sulfate reduction occurs when other electron acceptors become consumed/unavailable, and once sulfate is completely consumed, methanogenesis becomes the primary remineralization pathway. At this site, sulfate reduction predominates in the shallow sediment and the sulfate–methane transition zone likely occurs at ~9 m CSF-A. This is not unusual for continental margin sediments and is probably due to the fact that Site U1542 lies in a high productivity zone supported by abundant supply of nutrients from continental runoff.
Calcium carbonate content is very low at this site with the exception of two peaks of 39.2 and 80.0 wt% at 97.22 and 125.57 m CSF-A, respectively. The carbonate record shows no correlation with reflectance L* and RGB blue data. Organic carbon contributes a maximum of 0.67 wt% to the total carbon pool throughout this site. TN is very low, never exceeding 0.05 wt%, and low concentrations yield poor reproducibility of samples because of the detection limit of the instrument.
Physical property data acquired from whole-round measurements for Site U1542 are generally in good agreement with those from split-core measurements; however, at this site considerable offsets in many individual section depths exist through all holes due to ongoing expansion of sediment between whole-round logging and splitting the cores. Onshore measures such as high-resolution X-ray fluorescence scanning and manual inspection of MS will clarify this further. The applied manual processing to all Site U1542 holes based on the whole-round WRMSL/Special Task Multisensor Logger (STMSL) log sheets provided sufficiently “clean” data for GRA bulk density, MS, and NGR but yielded data loss of about 8%–15% depending on the hole and data category. P-wave velocity measurements largely failed for Site U1542 because of core expansion and related cracking of the sediment.
At this site, the downhole changes in the physical property data weakly correspond with the defined lithofacies (Figure F41) based on sediment characteristics. Higher MS and GRA bulk density values correspond to the hemipelagic composition and higher lithogenic input to the sedimentary matrix at Site U1542, but these parameters exhibit different relationships with one in intervals of low diatom content another compared to previous Sites U1539 and U1540.
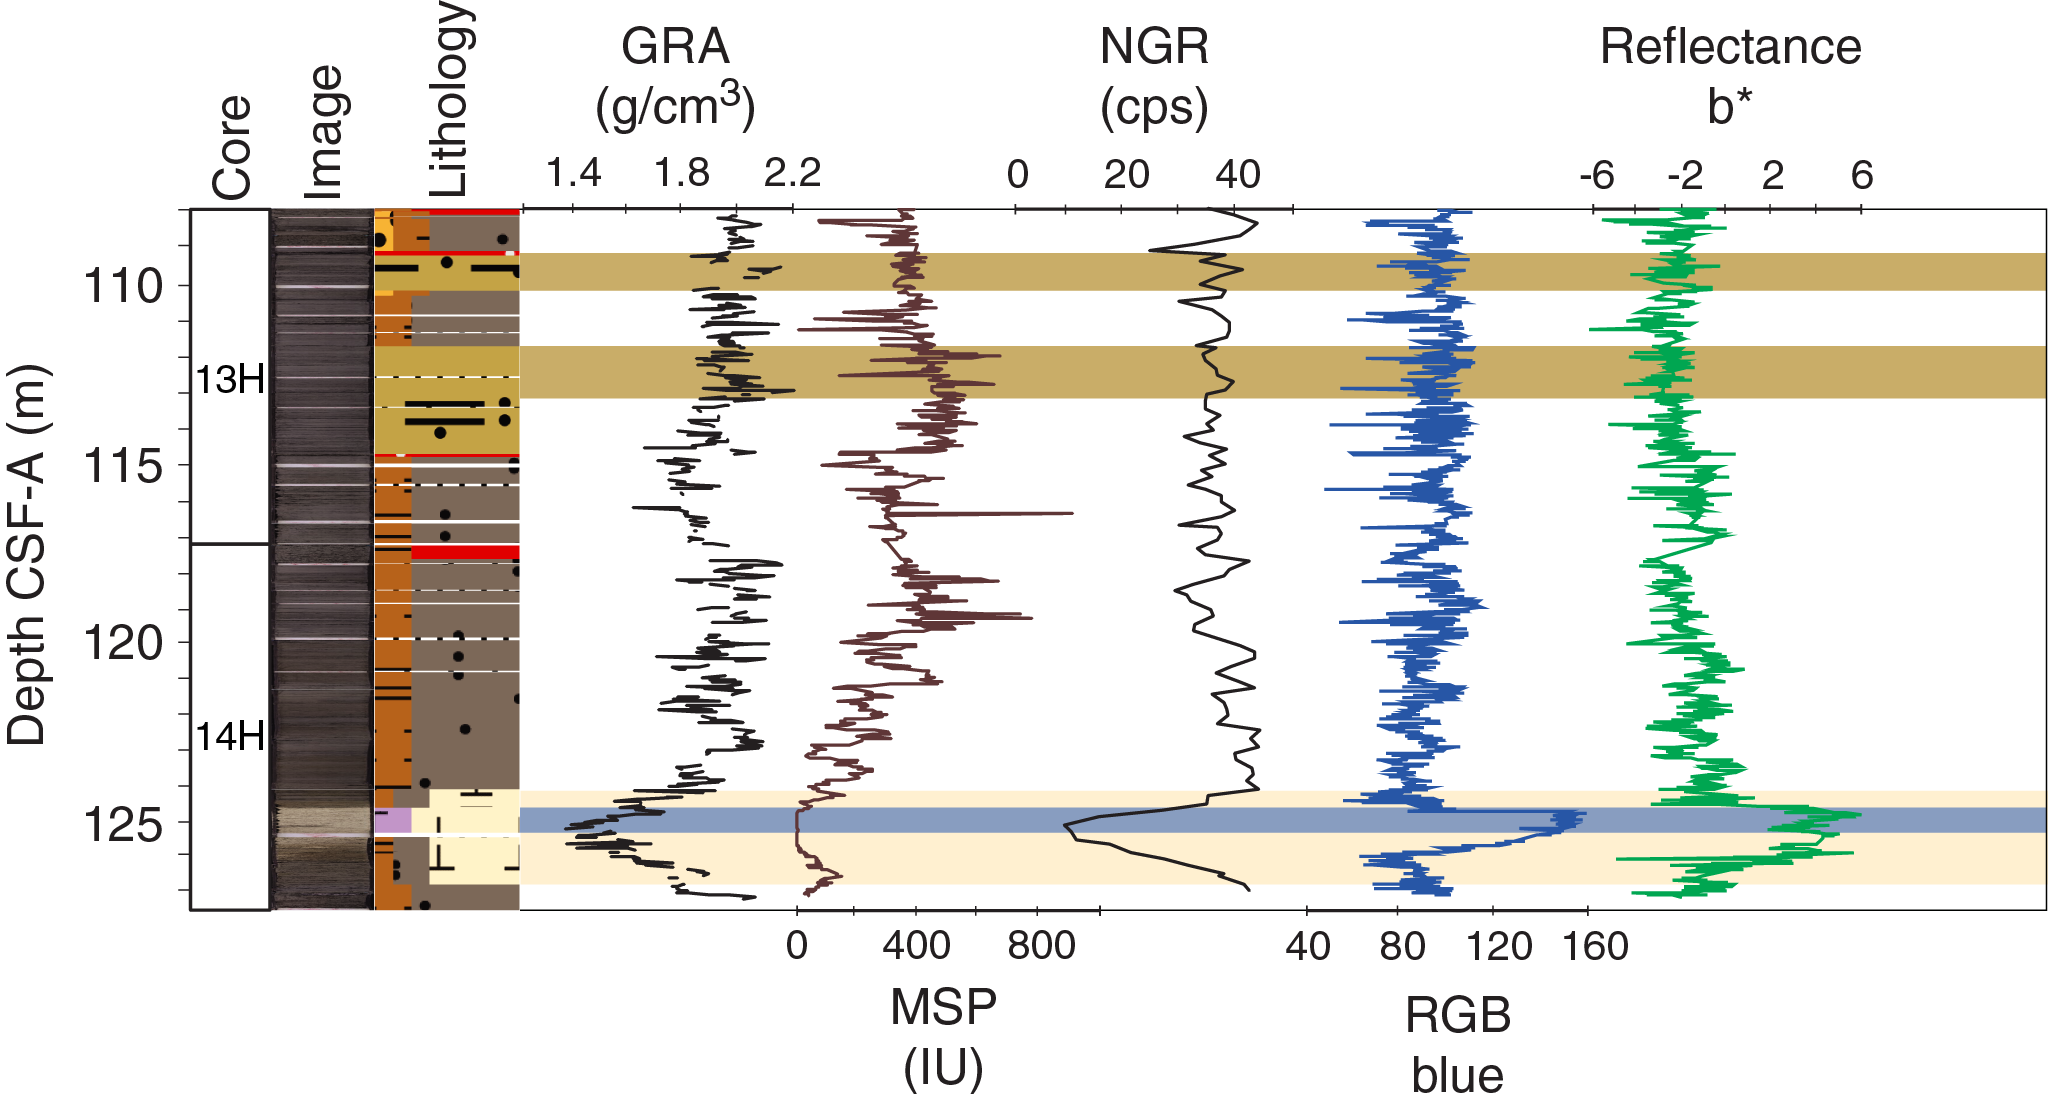
Figure F41. Physical properties, Hole U1542C.
The higher complexity of this hemipelagic site in terms of sediment delivery mechanisms is reflected in the acquired physical properties of Site U1542. The predominantly terrigenous sediment supply likely is composed of multiple processes such as ice and glacial meltwater transport as well as dust and current-induced lateral material transport and sorting after deposition, all influenced by various forcing such as climate and glacier mass balance changes, associated sea level changes, and dynamic changes in middepth ocean circulation that affects the transport direction and strength on both orbital and short (sub)millennial timescales.
We constructed a preliminary age model based on biostratigraphic age markers. These data suggest that the sedimentary sequence recovered at Site U1542 covers the past ~0.7 My (Figure F42) with sedimentation rates averaging 37 cm/ky.

Figure F42. Preliminary age model, Site U1542.
The combination of nearly continuous recovery, very high sedimentation rates in a sediment drift primarily driven by siliciclastic sediment input during glacials, and, though diluted, a rich array of calcareous microfossils combined with diatoms will provide unprecedented opportunities for improving our understanding of the dynamics of the northern ACC before entering the Drake Passage, variations of the CHC, intermediate water mass circulation, and PIS variability.
Site U1543
Background and objectives
Site U1543 (Proposed Site ESP-1B) is located in the ESP at 54°35.06′S, 76°40.59′W, ~110 nmi west of the Chile coast and ~120 nmi south-southwest of Site U1542 at ~3860 m water depth (Figure F43). The site is situated west of the Chile Trench on a topographically elevated ridge ~300 m above the trench axis (~4200 m water depth) (Figure F44A). The basement at this location is oceanic crust older than ~20 Ma (Eagles, 2006).
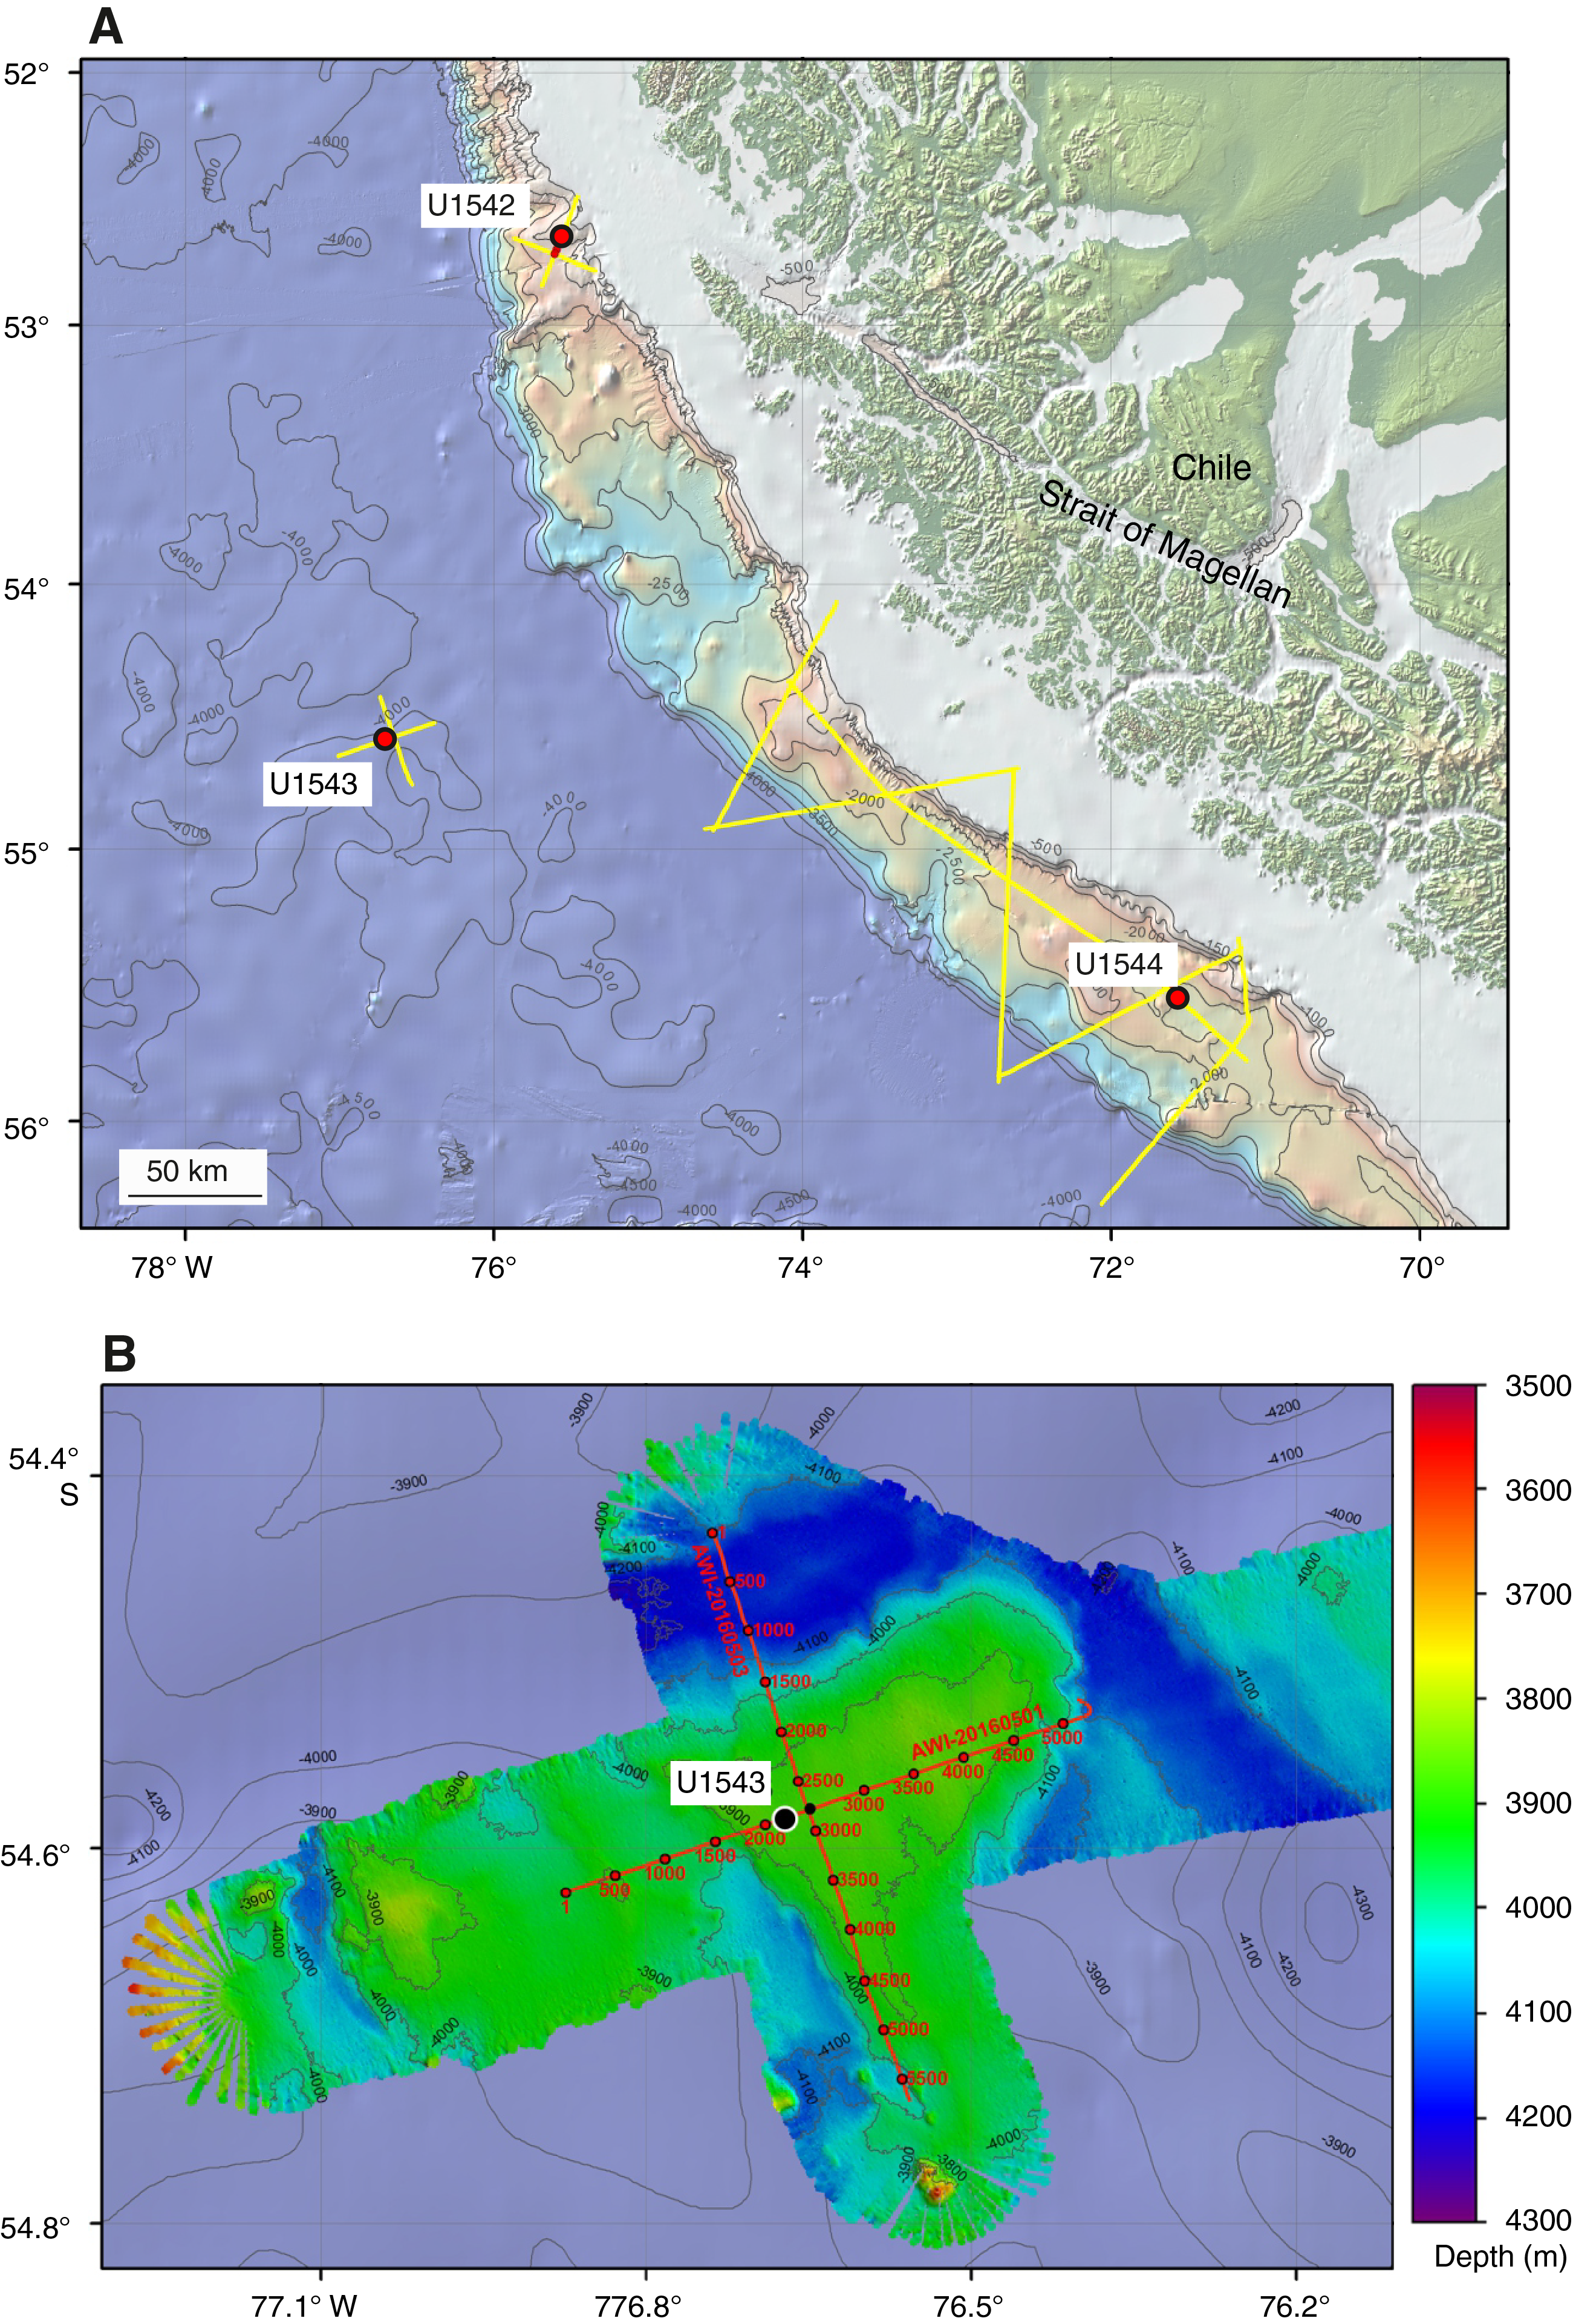
Figure F43. Oceanographic and bathymetric setting, Site U1543.
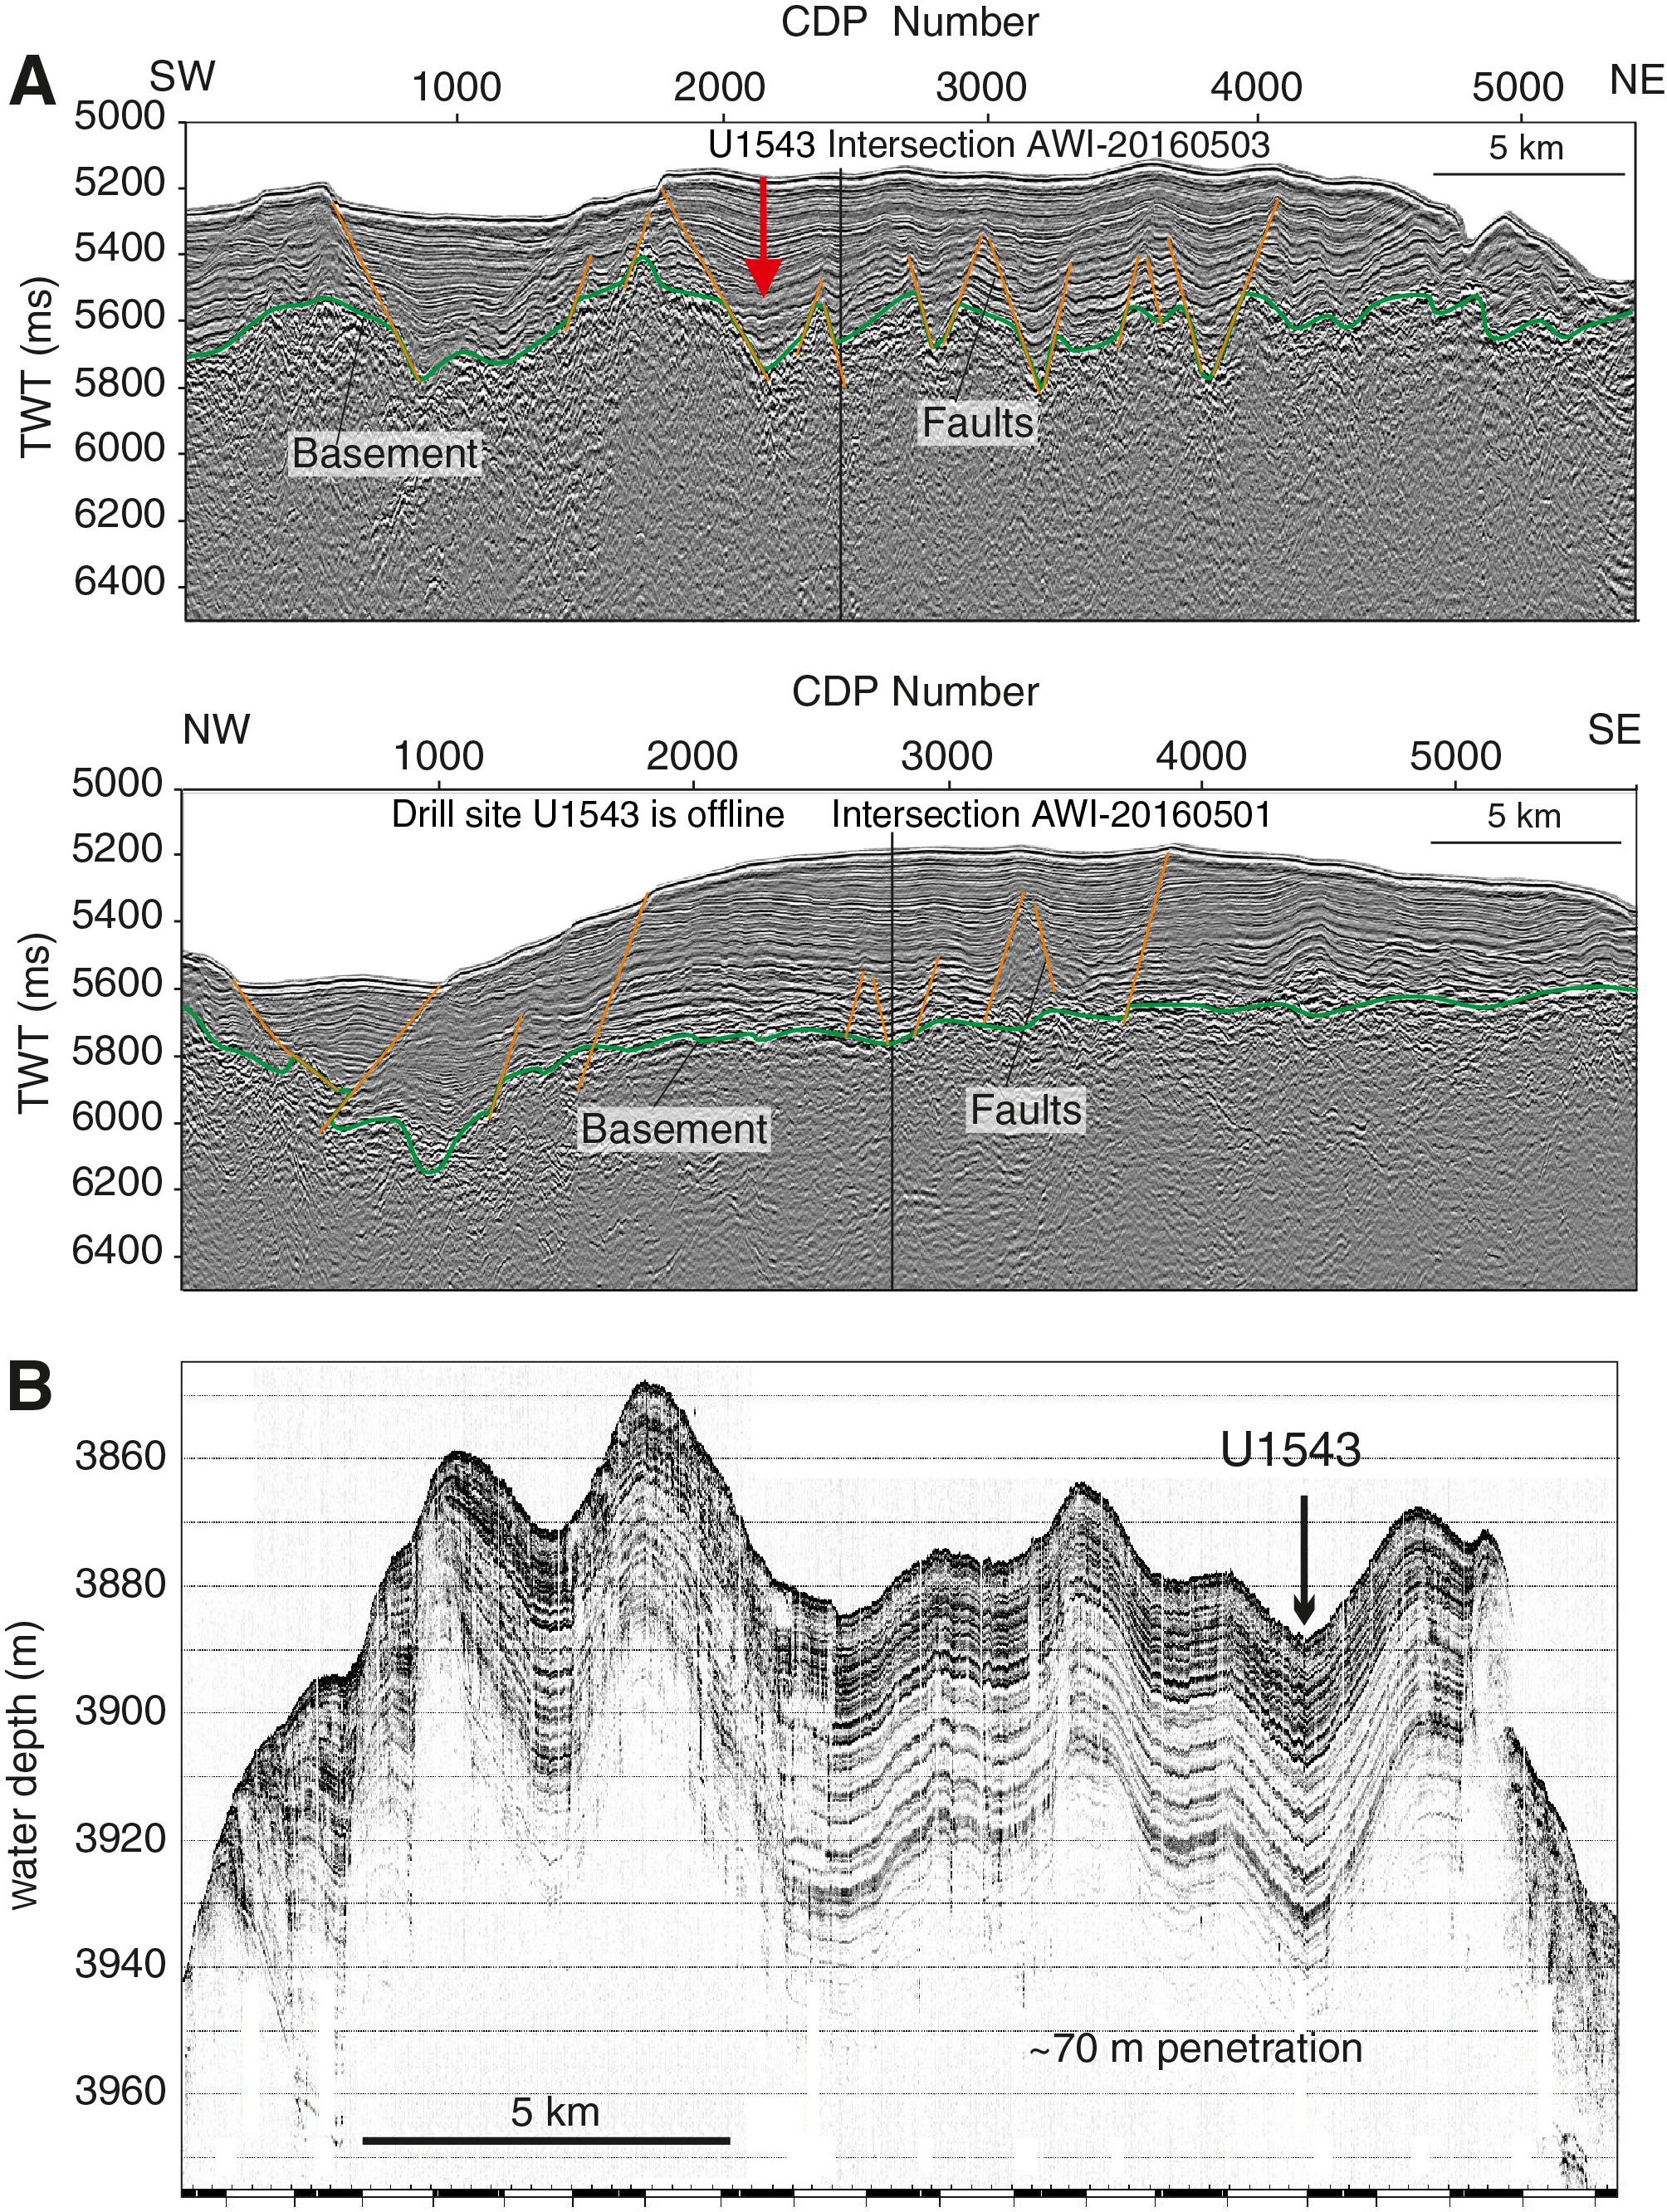
Figure F44. MCS and Parasound profiles, Site U1543.
Site U1543 lies at the intersection of two seismic lines with a sediment thickness of 600–700 m. MCS Line AWI-20160501 lies ~1 nmi southwest of the intersection with Line AWI-20160503 (Figure F44A) (Lamy, 2016). Sediments are mostly well stratified with only slightly irregular reflectors. Sediment cover is drape-type and entirely covers the underlying basement morphology (Figure F44A). Sediment echo sound (Parasound) profiles (Lamy, 2016) reveal moderate penetration (~70 m) with distinct layering (Figure F44B), suggesting a succession of fine-grained sediments with varying lithologic composition.
Site U1543 is located at the offshore reach of the southward-flowing CHC, a northern branch of the ACC that continues toward the Drake Passage and provides a major fraction of the present-day northern Drake Passage transport (Well and Roether, 2003). Satellite-tracked surface drifters reveal that after crossing the EPR, Subantarctic surface water of the ACC is transported northeastward across the ESP toward the Chile coast at ~45°S, 75°W (Figures F2, F37). Here, presently only a minor part of ACC water is deflected northward into the HCS, and the major fraction is deviated southward toward the Drake Passage. The CHC thus transports a significant amount of northern ACC water toward the Drake Passage in a narrow ~100–150 km wide belt along the coast (Chaigneau and Pizarro, 2005) (Figures F2, F37). Modern surface current velocities in the CHC reach >35 cm/s at the continental margin (Site U1542) but decrease offshore toward Site U1543 (Boisvert, 1969; Chaigneau and Pizarro, 2005).
Site U1543 is presently located at the lower limit of LCDW and might have been affected by AABW in the past (Figure F38). The site is located ~4° latitude north of the present SAF. Modern mean annual SST in this area is ~8.5°C, and the seasonal range is ~3°C.
The main objectives at Site U1543 were to
- Recover a Pliocene–Pleistocene undisturbed, continuous sediment record with medium high sedimentation rates;
- Reconstruct the strength of the CHC (Subantarctic ACC) before entering the Drake Passage;
- Investigate AABW, CDW, and Pacific Deep Water (PDW) water mass properties;
- Investigate changes of continental paleoclimate; and
- Recover a potential far-field record of PIS variability over the past several million years.
Operations
The R/V JOIDES Resolution completed the 119 nmi transit from Site U1542 to Site U1543 at 1717 h on 8 July 2019 after traveling 10.5 h and averaging 11.3 knots. A water depth reading using the PDR set the preliminary seafloor depth at 3877.4 mbrf for Hole U1543A. The operations plan for Site U1543 initially included three holes to 400 m CSF-A. This plan was modified because of time lost to weather during the expedition, shallowing the penetration depth to 250 m CSF-A for each hole. While coring Hole U1543A, it was decided to continue deepening the hole until APC refusal and to only core two holes to APC refusal at this site.
Hole U1543A
Hole U1543A was spudded at 0325 h on 9 July 2019, and Core 1H recovered 7.1 m. Core recovery determined a seafloor depth of 3863.4 mbsl. Soon after, at 0415 h, coring operations were suspended when one of the ship’s main propulsion shafts was shut down because of mechanical problems. The engineers found a faulty shaft brake unit. The brake was taken out of service, and the shaft was repaired and brought back online by 0900 h. At that point, coring resumed and continued without interruption through 11 July in good weather and sea conditions. Coring was terminated after 90,000 lb of overpull were needed to retrieve Core 36H from 339.6 m CSF-A. The drill string was pulled out of the hole, clearing the seafloor at 1830 h on 11 July. Overall, 36 cores were taken with 103% recovery.
Nonmagnetic core barrels were used on all cores. The core orientation tool was used in most cores except for 383-U1543A-8H, 14H, 16H, 17H, 24H–29H, and 32H–36H. Formation temperature measurements were taken with the APCT-3 tool on Cores 4H, 7H, 10H, 13H, 16H, and 19H. Partial strokes were recorded on Cores 32H–36H. The total time spent in Hole U1543A was 73.2 h (3.05 days).
Hole U1543B
The vessel was offset 20 m east of Hole U1543A, and Hole U1543B was spudded at 2010 h on 11 July 2019. The seafloor depth was calculated at 2876.4 mbrf (3865.3 mbsl) based on the recovery from Core 1H. Hole U1543B was cored entirely with the APC system, and two drilled intervals were used to cover coring gaps between Holes U1543A and U1543B. The first drilled interval (1.9 m) followed Core 1H, and the second drilled interval (1.5 m) followed Core 23H. Core 33H reached a total depth of 286.5 m CSF-A. Overall, 31 cores were taken over a 283.1 m interval with 104% recovery.
The bit was retrieved to the surface, clearing the seafloor at 1800 h on 13 July and the rotary table at 0045 h on 14 July. The rig floor was secured for transit at 0110 h, and JOIDES Resolution began transiting to Site U1544.
A total of 31 cores were taken over a 283.1 m interval. A total of 294.97 m was recovered (104.2% recovery). Two intervals were drilled without recovery for a total of 3.4 m. Nonmagnetic core barrels were used with all cores, and the core orientation tool was not used. Partial strokes were recorded on Cores 383-U1543B-31H through 33H. The liners of Cores 3H, 14H, 20H, 21H, 25H, and 31H–33H shattered on the catwalk after holes were drilled to release formation gas.
Principal results
Site U1543 consists of a 376.3 m spliced sedimentary sequence (Figure F45, F46). The sedimentary record comprises five lithofacies (Figure F46) identified at previous Expedition 383 sites. These include major biogenic lithologies (nannofossil ooze [Lithofacies 4]; clay-bearing to clayey diatom ooze [Lithofacies 6]); and diatom-, clay-, and/or silt-bearing to rich nannofossil or calcareous ooze [Lithofacies 10]) and mainly siliciclastic sediments (diatom-bearing to rich clay [Lithofacies 7] and silt-bearing clay to clay-bearing silt [Lithofacies 8]). The biogenic lithofacies were first characterized in the central South Pacific, whereas the pure siliciclastic sedimentary lithofacies were observed at northern Chilean margin Site U1542. Their definition is expanded according to the varieties of lithofacies observed at this site. The sedimentary sequence at Site U1543 is characterized by moderate average sedimentation rates of ~5 cm/ky. Site U1543 comprises two lithostratigraphic units, Unit I (0–115.5 m CCSF-A) and Unit II (115.5–376.5 m CCSF-A), that cover the early Pleistocene to Holocene and late Miocene to early Pleistocene intervals, respectively. Unit I largely consists of greenish gray to dark greenish gray silt-bearing clay (Lithofacies 8) that contains prominent 10–30 cm thick beds of light gray to light greenish gray carbonate-, clay-, and/or diatom-rich nannofossil ooze. Below 115 m CCSF-A, the abundance of diatomaceous sediments increases, mostly in the form of diatom-bearing silty clay (Lithofacies 7) and carbonate and silt-bearing diatom ooze (Lithofacies 6). The latter often occurs in association with decimeter-scale beds of nannofossil ooze. Diatom mats and dropstones are rare, and burrows and mottling due to diagenetic overprints are frequent. Lithification, secondary carbonate precipitation, and microfracturing increasingly occur below 275 m CCSF-A.
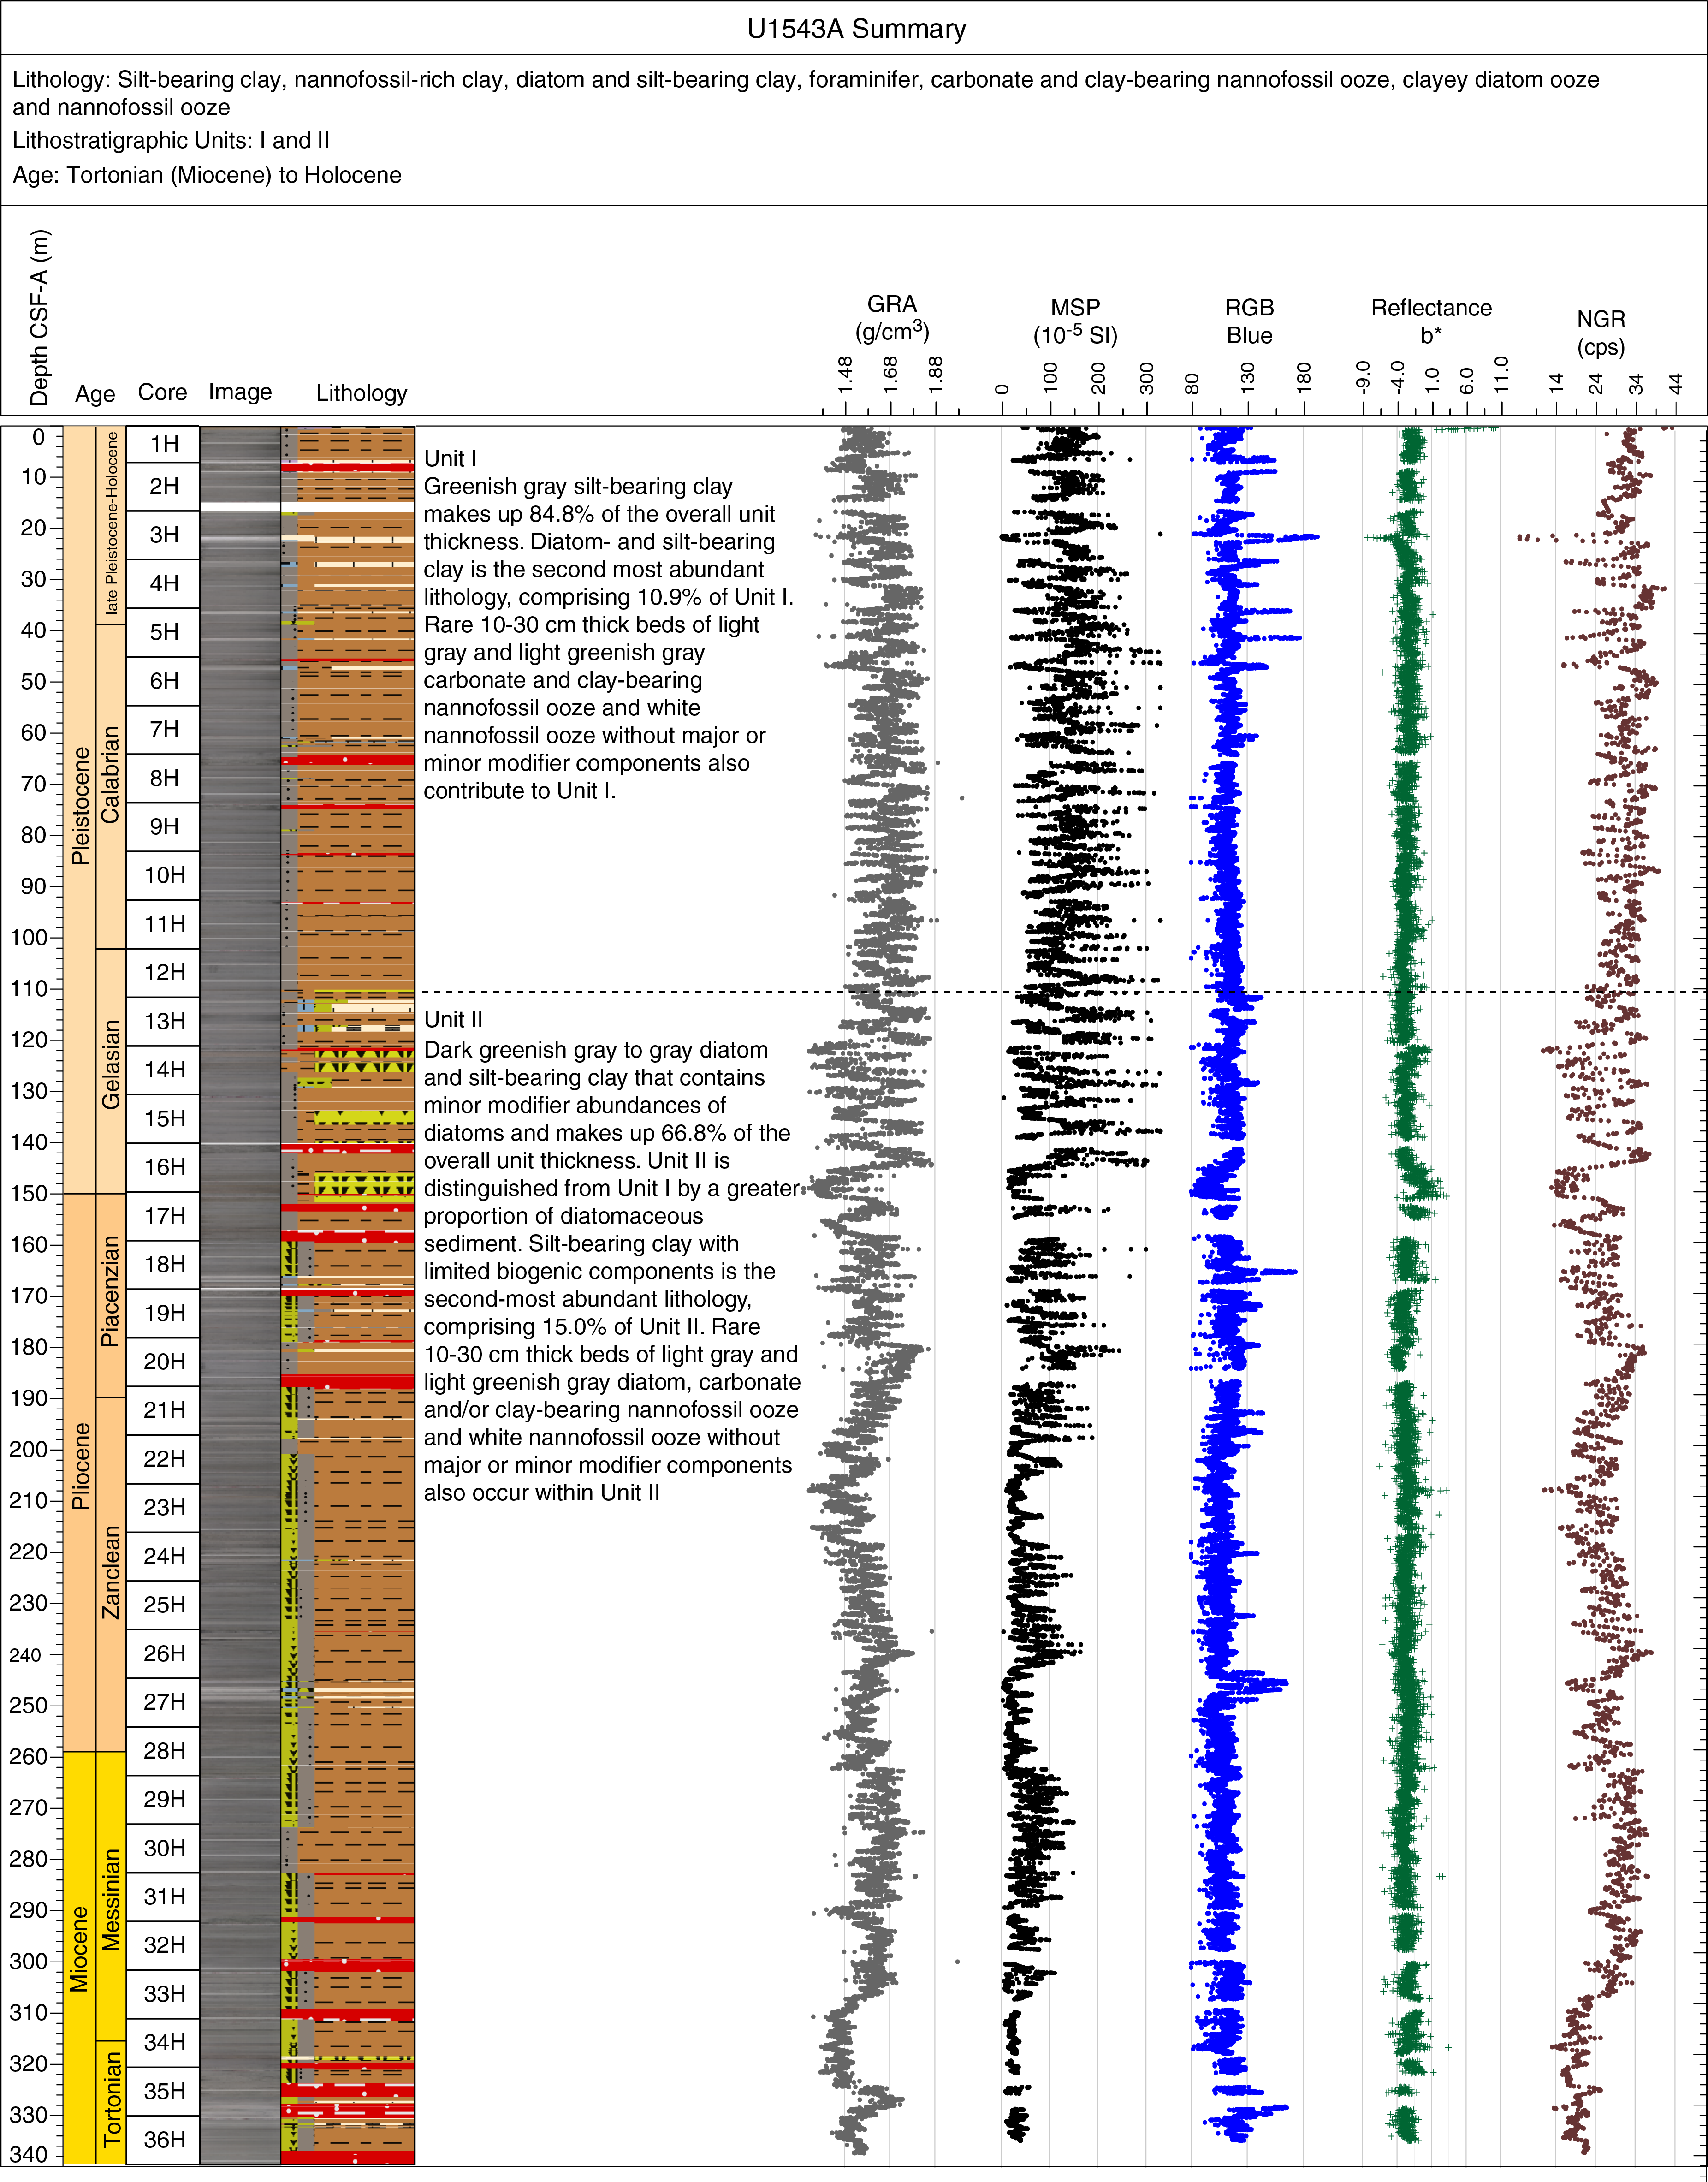

Figure F45. Hole summaries, Site U1543.

Figure F46. Primary lithostratigraphic variations, Site U1543.
A sediment succession of Holocene to Late Miocene age was recovered at Site U1543. Diatoms and radiolarians are abundant throughout the sediment succession, silicoflagellates are absent to few but locally abundant, nannofossil abundance varies strongly with good preservation, benthic and planktonic foraminifers are absent in glacials and moderately preserved when present, and ostracods are rarely present at the site and restricted to Miocene samples. Biostratigraphic analyses of Hole U1543A core catcher and split-core samples allowed the recognition of 56 biostratigraphic events that indicate an estimated age of 7.3–8.5 Ma at the bottom of the hole.
The NRM of the archive-half sections of Site U1543 was measured and remeasured after AF demagnetization at 2 cm increments. In general, the number of demagnetization steps reflects
- The desire for more steps to study the magnetization(s),
- The severity of the drill string and natural overprints that hopefully can be removed to recover the natural remanence,
- The desire to use low peak fields to preserve the magnetization for future shore-based studies, and
- The need to maintain core flow through the laboratory.
The intensities before and after demagnetization for the upper 140 m of cores recovered from Hole U1543A are generally quite strong, varying around the 10−1 to 10−2 A/m range. A few discrete intervals have values as low as 10−4 A/m and are generally associated with MS lows. Below 140 m CSF-A, intensities are slightly lower on average, falling to ≤10−2 A/m. Below 240 m CSF-A, intensities are more variable and values in the 10−3 to 10−4 A/m range are much more common. Compared with previous sites, there is little difference in intensity before and after demagnetization at a peak AF of 15 mT, suggesting a finer magnetic mineralogy with a higher coercivity that is less susceptible to the drill string overprint.
The inclination for Holes U1543A and U1543B before and after AF demagnetization at 15 mT captures a series of apparent polarity reversals, either directly observed or inferred from polarity changes between cores, and when observed within a section the reversals are generally well defined and many times reproduced. Their positions in Hole U1543A are illustrated in Figure F47. All polarity boundaries from the Matuyama/Brunhes at 0.781 Ma through Chron C3Br.2r at 7.285 Ma, 31 polarity reversals in total, are either directly observed or closely constrained and correlated to the GPTS (Cande and Kent, 1995; Hilgen et al., 2012). Reversed and normal polarity associated with the base of Chron C3B and the upper part of Chron C4 (older than 7.432 Ma) were observed, but the boundaries are not constrained in the deepest cores in Hole U1543A. Shore-based studies will refine correlations to the GPTS and facilitate development of relative paleointensity as the next steps in magnetic stratigraphy at Site U1543.

Figure F47. Corrected inclination, Hole U1543A.
Routine safety hydrocarbon measurements were collected at Site U1543 in headspace gastight vials at a resolution of approximately one 5 cm3 sample per core from 5.99 to 337.63 m CSF-A. Methane concentrations remain very low at this site, ranging from 4 to 17 ppmv. Propene occurs at a low concentration of 0.5 ppm at 280.67 m CSF-A, and concentrations of ethene, ethane, and propane remain below detection limit.
Biologically mediated anaerobic oxidation of organic matter is evidenced in the interstitial water by the presence of reduced iron and manganese, high alkalinity and pH, and high ammonium concentrations. Farther downcore, interstitial water chemistry may be additionally impacted by oxidative processes either deep in the core or below the cored depth with upward diffusion. This is demonstrated by decreases in ammonium and increases in sulfate with depth. The deeper parts of the core show evidence of opal and carbonate dissolution and reprecipitation as well as the interplay of dissolution and precipitation of iron- and manganese-bearing minerals.
Calcium carbonate content at this site is low but highly variable, and several peaks fluctuate between 0.1 and 86.8 wt%. A linear correlation between calcium carbonate contents and RGB blue and reflectance L* data was observed at this site for samples above 1 wt% (Figure F48). Organic carbon concentrations are below 0.43 wt%, whereas TN concentrations are below 0.048 wt%.
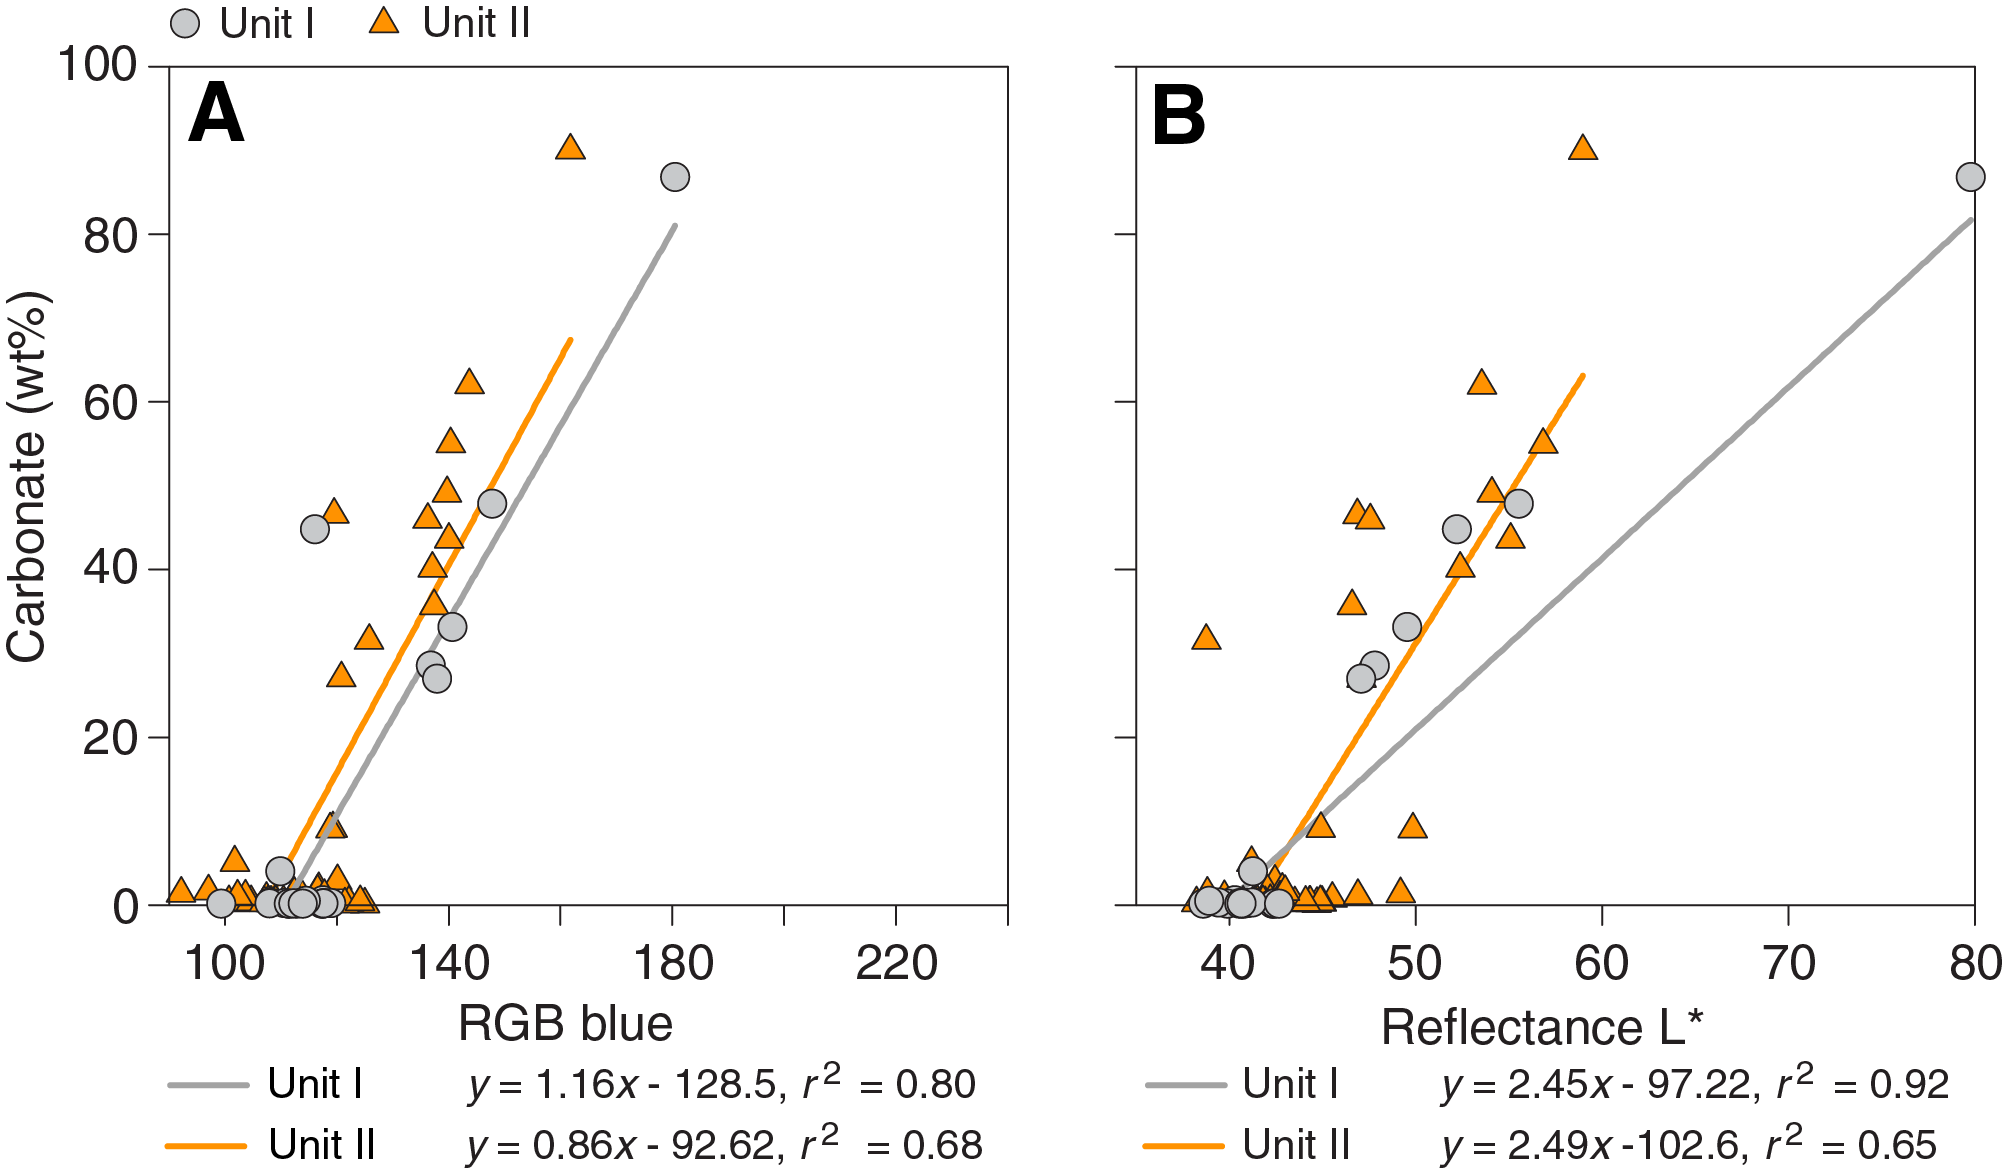
Figure F48. Bulk sedimentary carbonate content, RGB blue, and L*, Hole U1543A.
Physical property data acquired from whole-round measurements for Site U1543 are generally in good agreement with those from split-core measurements. In Unit I, higher MS, bulk density, and NGR values are positively correlated with sedimentary lithofacies that have a higher proportion of siliciclastic material (Lithofacies 7 and 8), whereas lower values are associated with sedimentary lithofacies with increased biogenic components (Lithofacies 4, 6, and 10). Although some minima in those physical properties corresponds to changing lithofacies, the physical properties also record subtle changes between siliciclastic and biogenic components at high temporal frequency and for long term, likely allowing a precise correlation with isotopic stratigraphy. Furthermore, GRA bulk density and P-wave velocity show different behaviors for increased nannofossil and diatom presence in Lithofacies 8. Both values decrease for increasing nannofossil content, and GRA bulk density decreases. P-wave velocities, however, increase with increasing diatom content. It is thus possible, by combining the different high-resolution physical property records, GRA bulk density, MS loop, and PWL, to interpret the large to smaller variations of the records as variations of either diatom or nannofossil content in siliciclastic Lithofacies 8 (Figure F49).
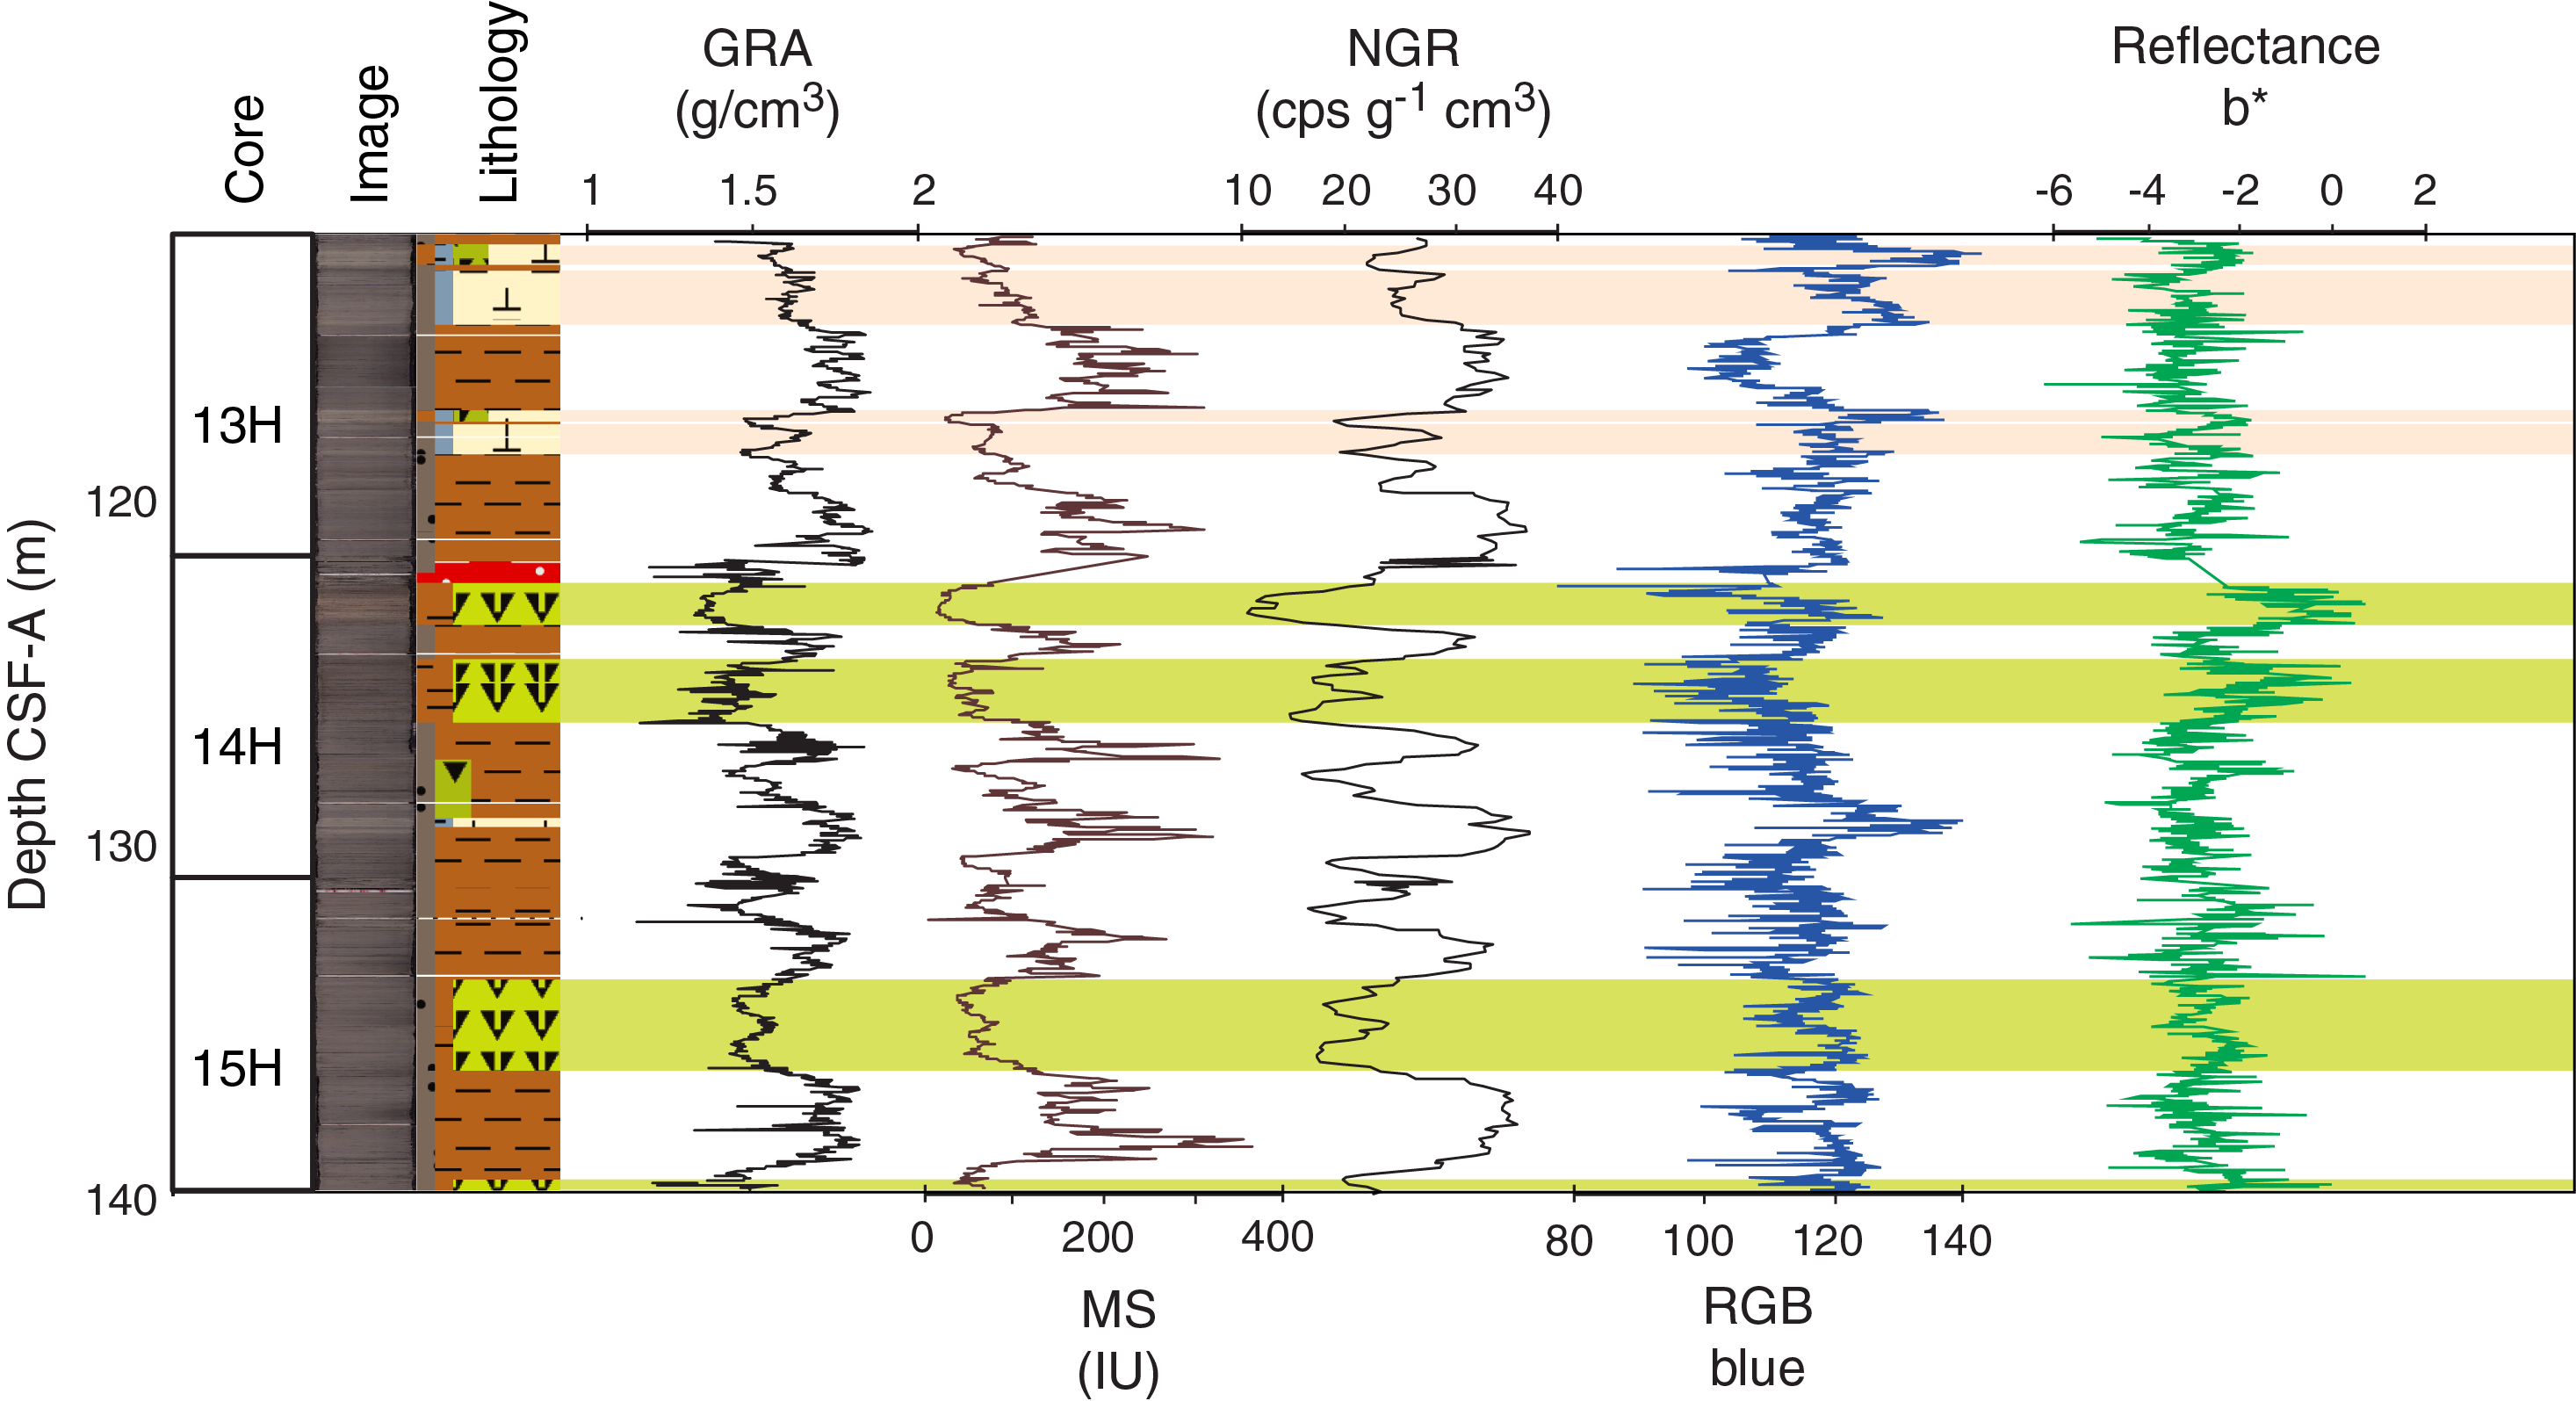
Figure F49. Physical properties, Hole U1543A.
We constructed a preliminary age model based on biostratigraphic and paleomagnetic age markers. These data suggest that the sedimentary sequence recovered at Site U1543 covers the past ~8.4 My (Figure F50). Sedimentation rates are overall relatively constant and average ~4.5 cm/ky. This age model is generally consistent with preliminary stratigraphic tuning performed on board based on physical property data such as color measurements (RGB blue) and GRA bulk density.
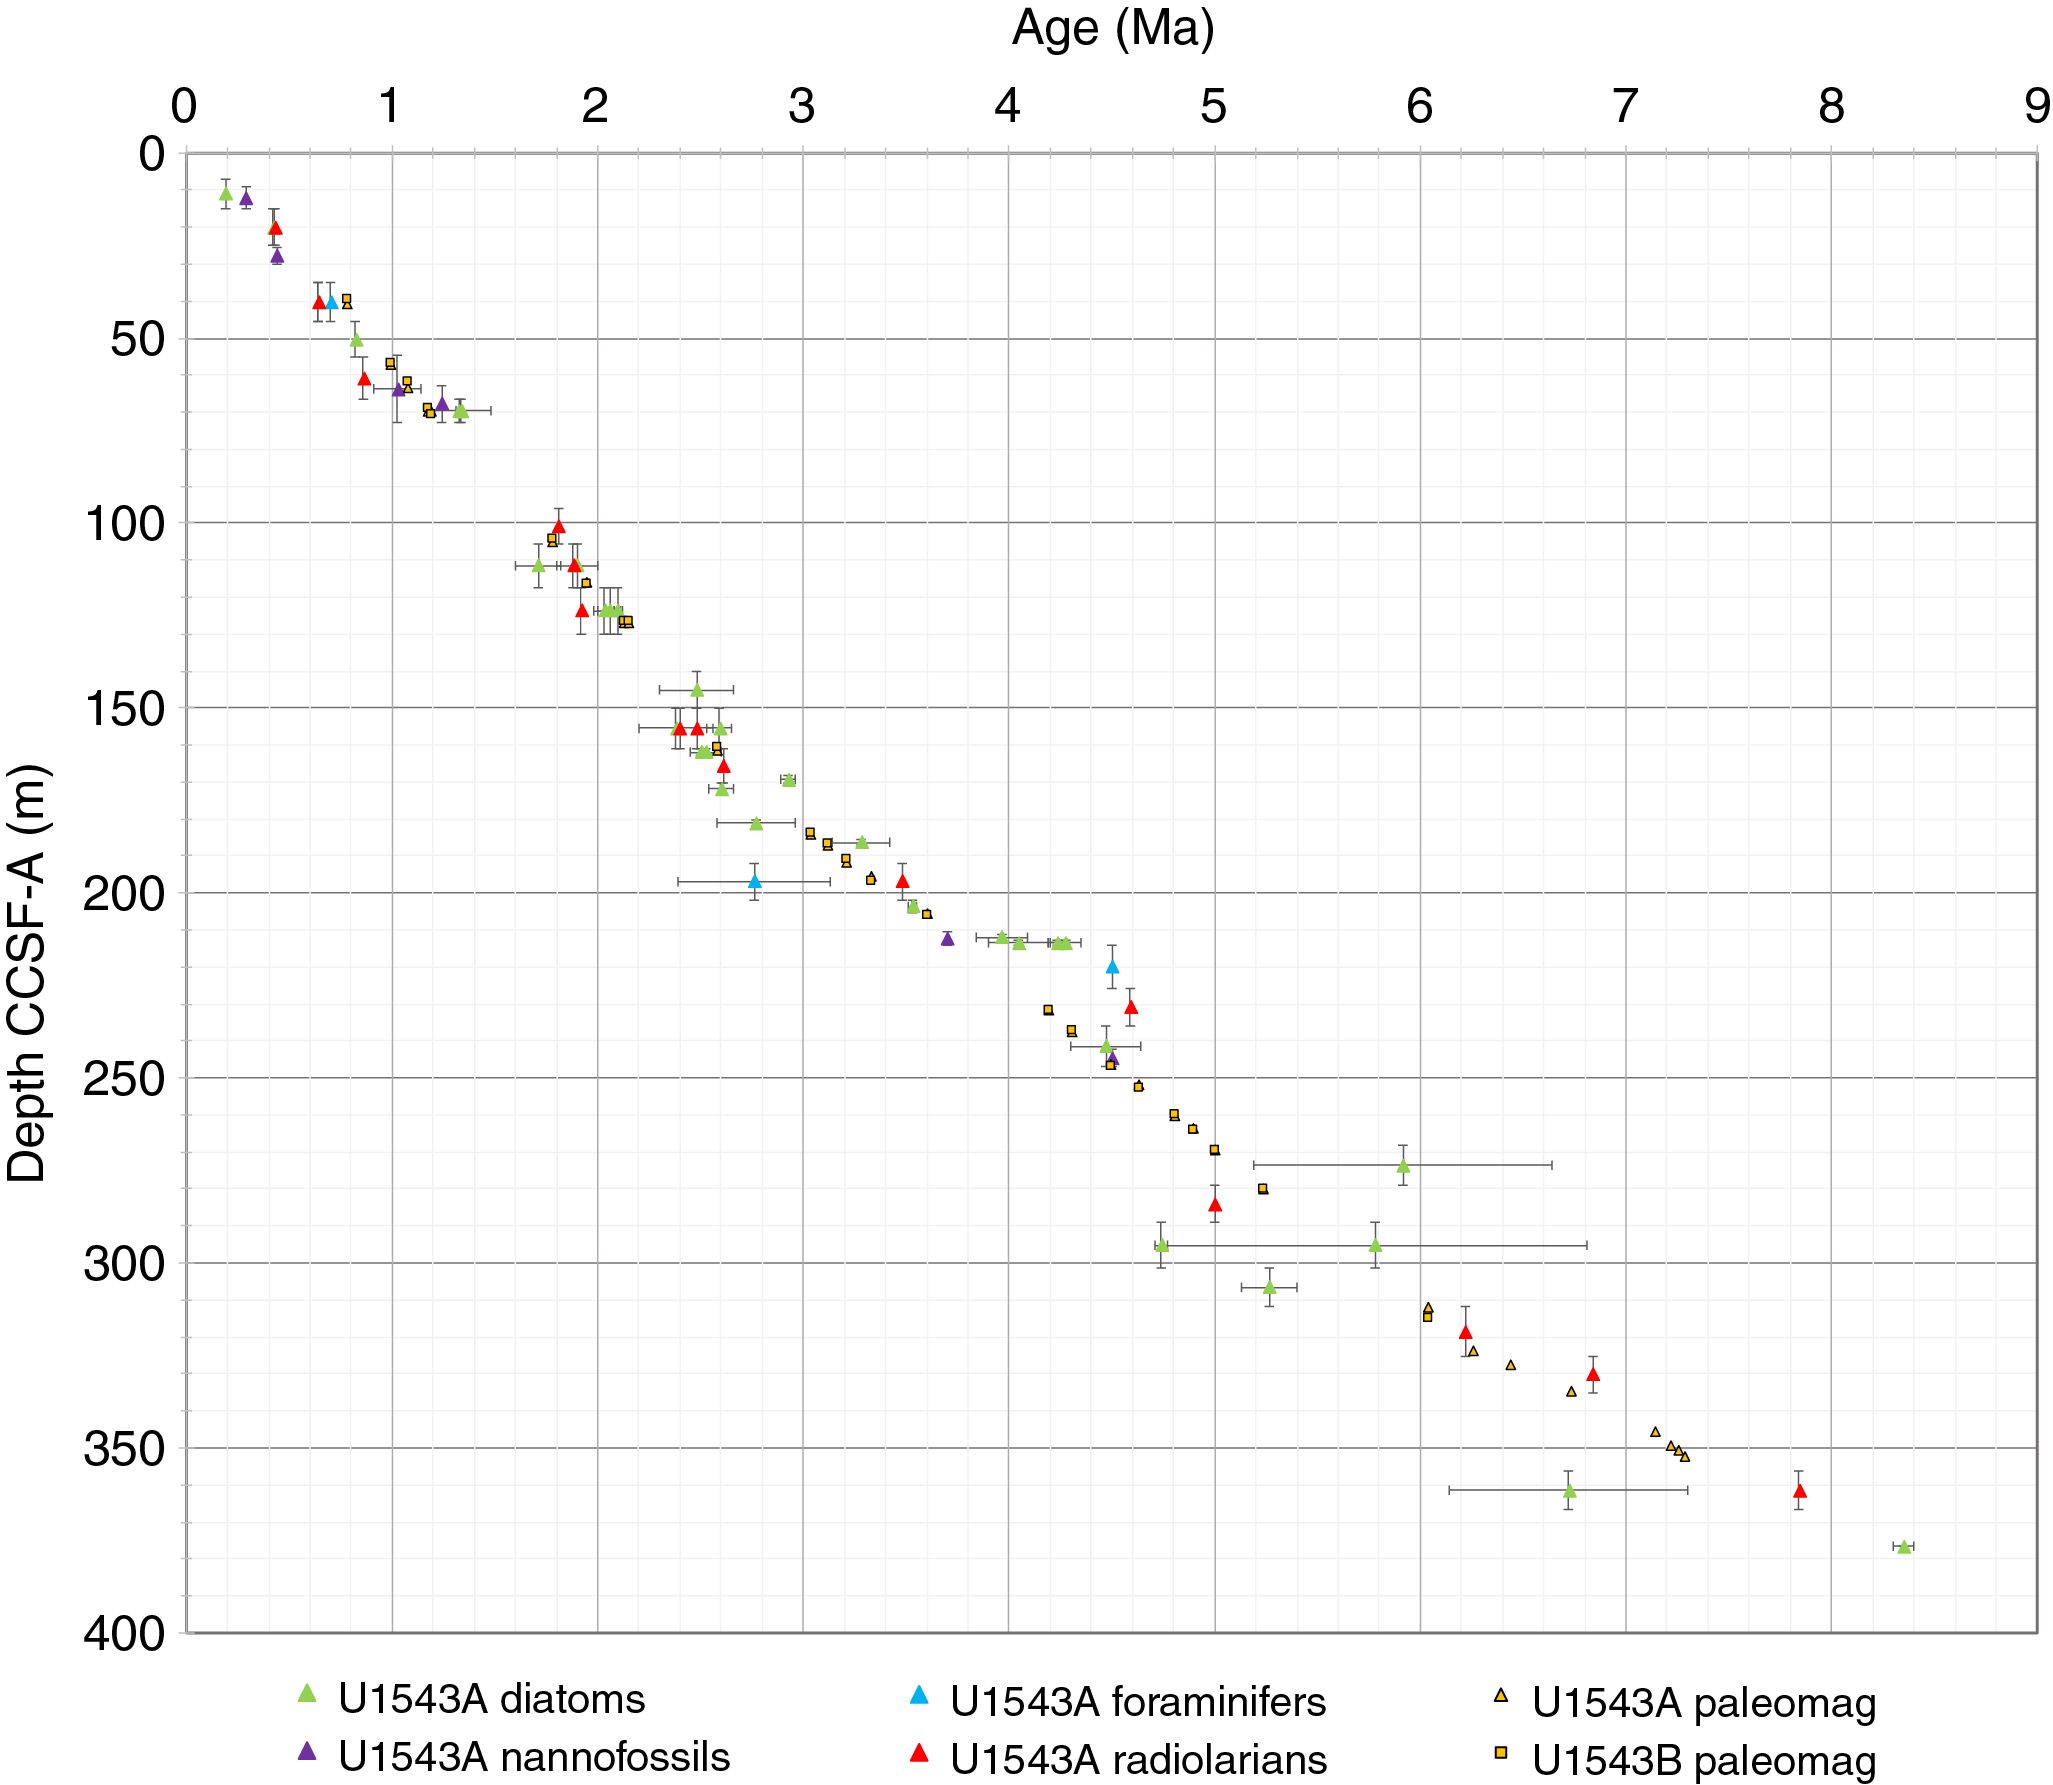
Figure F50. Preliminary age model, Site U1543.
Overall, the undisturbed continuous sediment record with medium to high sedimentation rates extending into the Miocene recovered at Site U1543 is exceptional. The record is an important eastern end-member locality to the CSP sites recovered during Expedition 383 that can be used to evaluate past oceanographic and climate changes from the late Miocene to the present. The observed variations in lithology and physical properties are at least in part driven by glacial–interglacial climate change that consistently impacts the delivery and nature of sediment deposited at Site U1543. The longer term evolution of these depositional processes recorded at Site U1543 will illuminate the multimillion-year history of PIS growth and retreat, ACC transport, and the underlying climatic conditions in which these processes evolved.
Site U1544
Background and objectives
Site U1544 (Proposed Site CHI-1C) is located at the Chile continental margin in the ESP at 55°32.2192′S, 71°35.6194′W, ~30 nmi southwest off the Chile coast and at ~2090 m water depth (Figure F51).
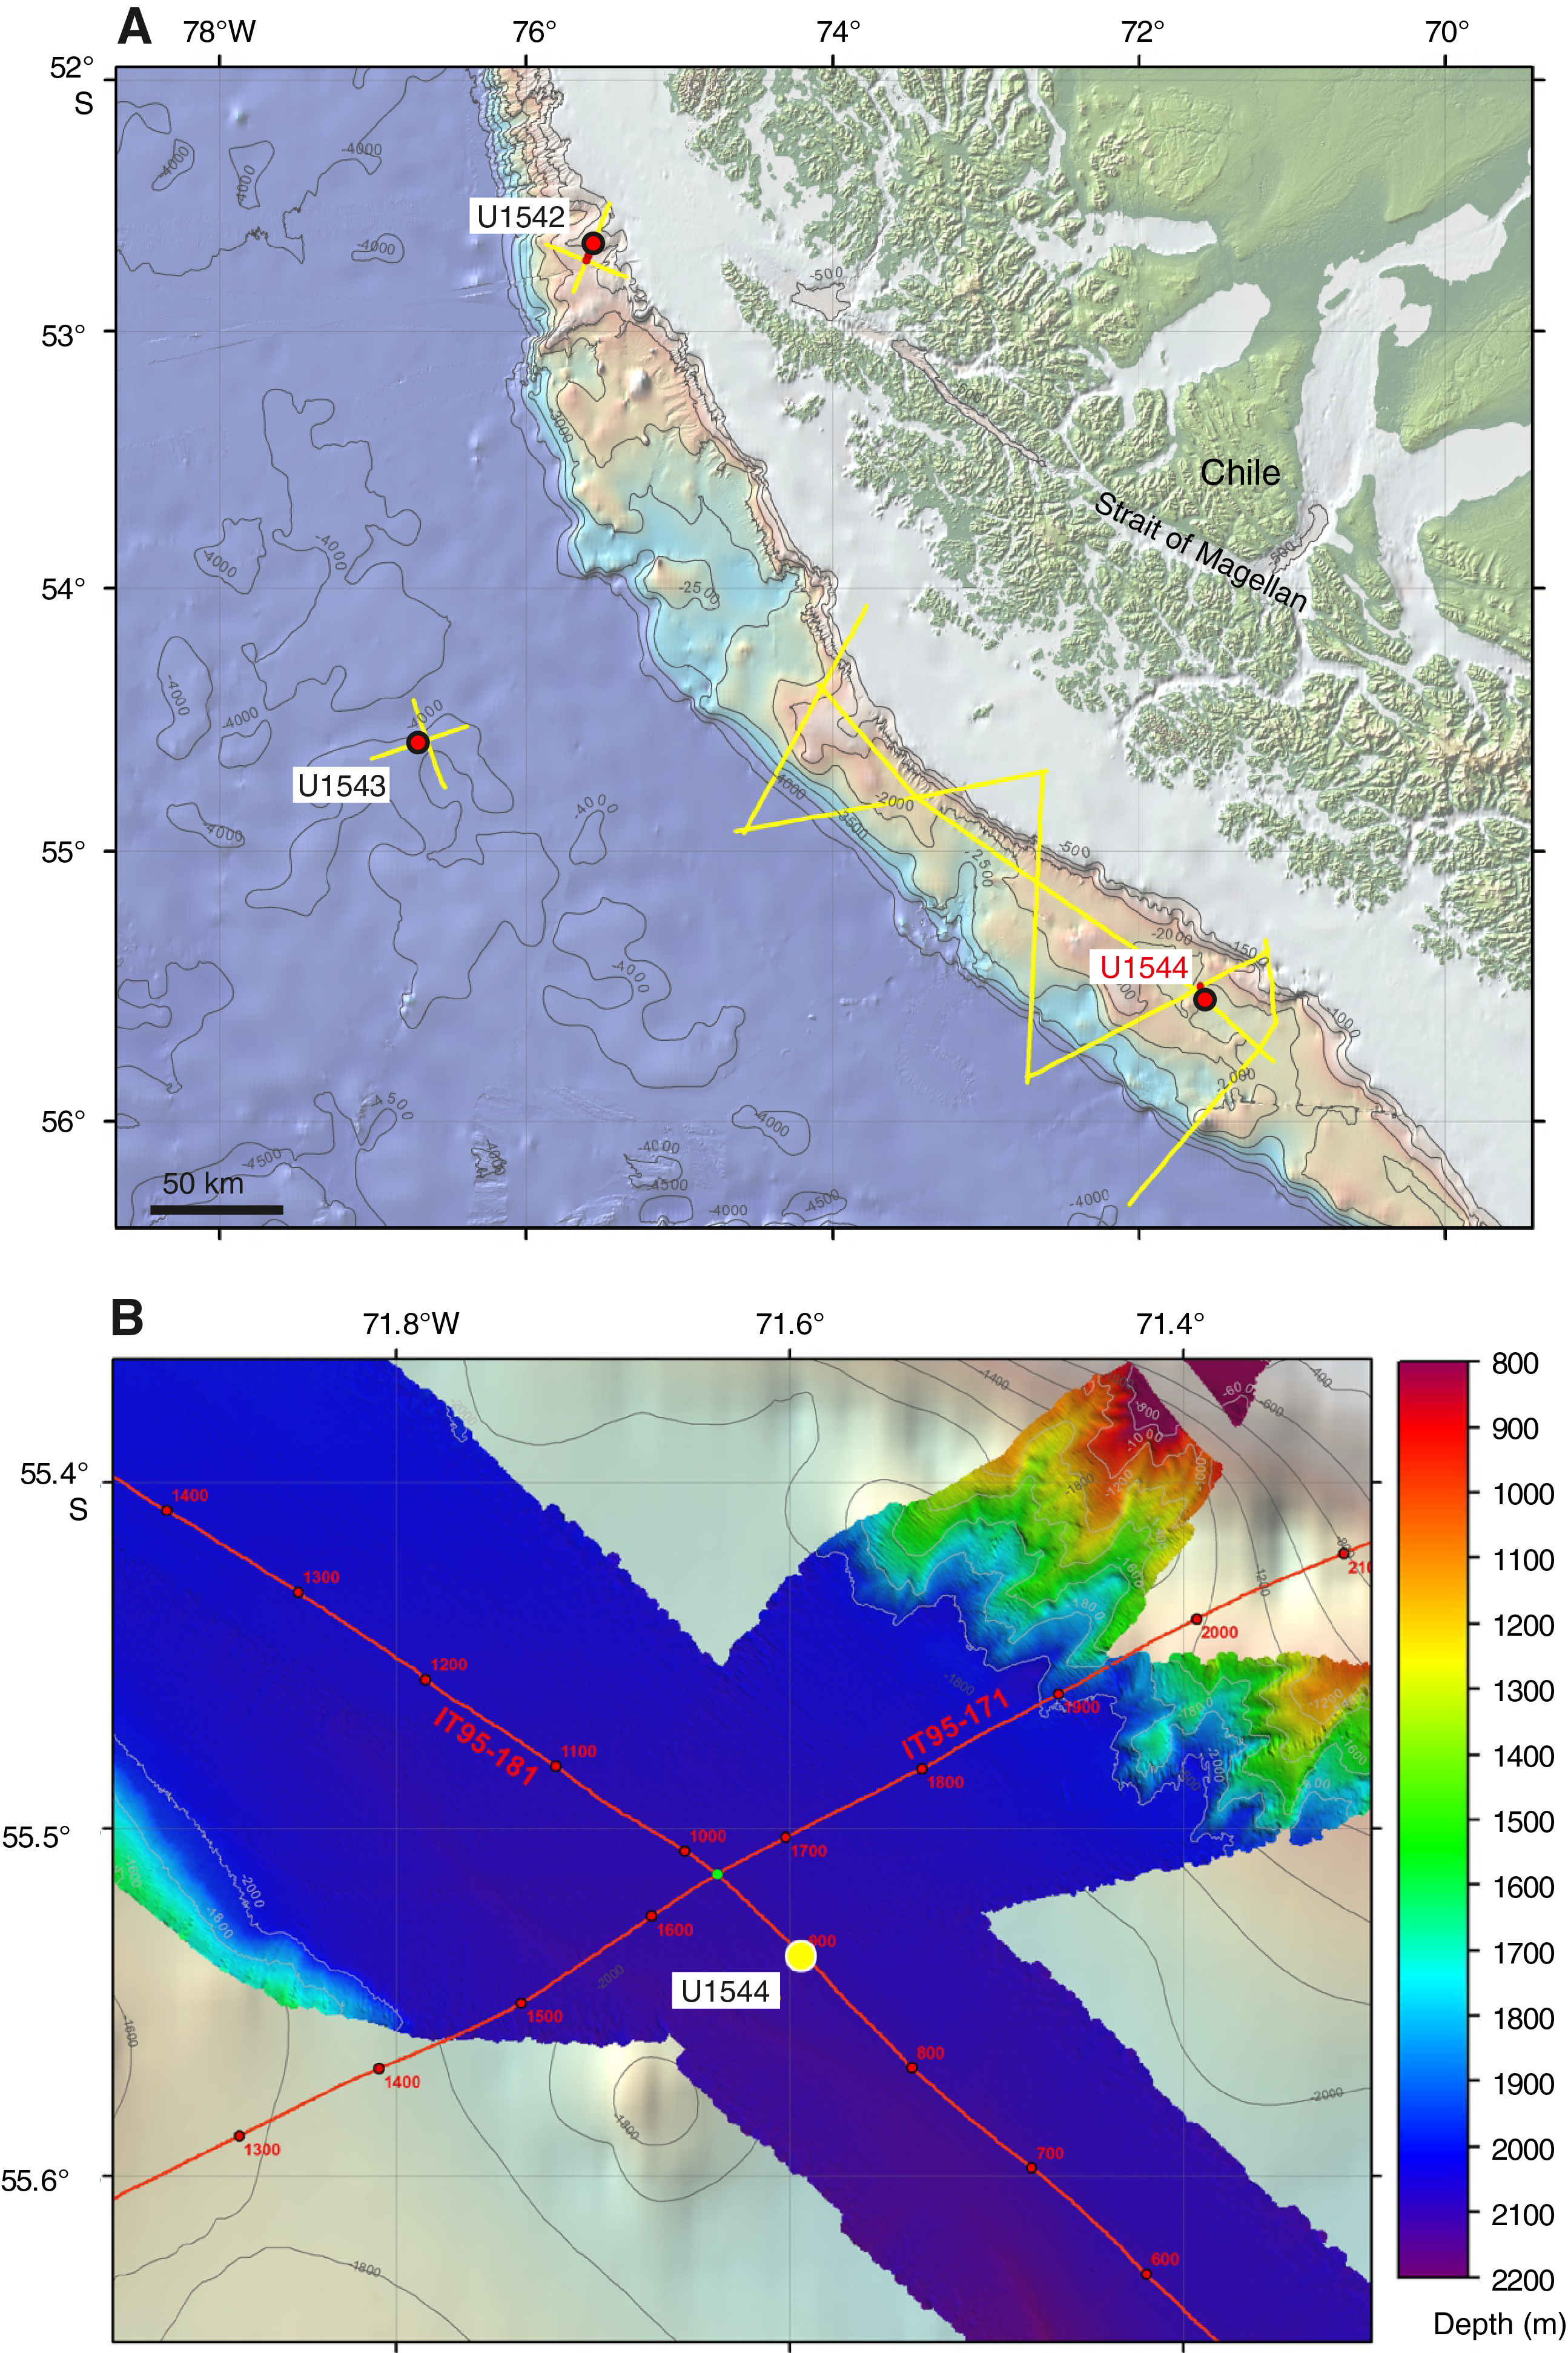
Figure F51. Oceanographic and bathymetric setting, Site U1544.
Tectonically, the southern Chilean margin is characterized by a complex geodynamic setting with oblique convergence between plates, transcurrent motion, and tectonic rotation on land (Polonia et al., 2007). The geodynamic setting of the southernmost Chilean margin is driven by relative movements between three main plates: Antarctica, Scotia, and South America. This complex setting results in strong segmentation of the southern Chilean margin, which is clearly visible in bathymetric data and MCS data (Polonia et al., 2007) (Figure F4). There are two major fore-arc basins at ~53°–54.5°S and 55°–56.5°S that are characterized by a thick sediment infill of as much as ~3 km. Site U1544 is situated close to the axis of the southern fore-arc basin on the continental crust of the Scotia plate. This southern basin most likely formed after the ridge consumption (10–14 Ma). When accretion resumed, it contributed to an outer high that provided the barrier for the accumulation of continent-derived sediments. The upper unit in the southern basement, relevant for drilling, shows onlap terminations on both basin flanks.
Site U1544 lies on MCS Line IT95-181 ~3 nmi southeast of the intersection with Profile IT95-171 (Figure F52) (Lamy, 2016). Sediments are mostly well stratified, and sediment cover at the site exceeds 2.5 km. Sediment echo sound (Parasound) profiles (Lamy, 2016) reveal poor to moderate penetration (~30 m) with distinct layering and an irregular surface, suggesting a succession of fine- to medium-grained sediments with occasional coarser grained composition.
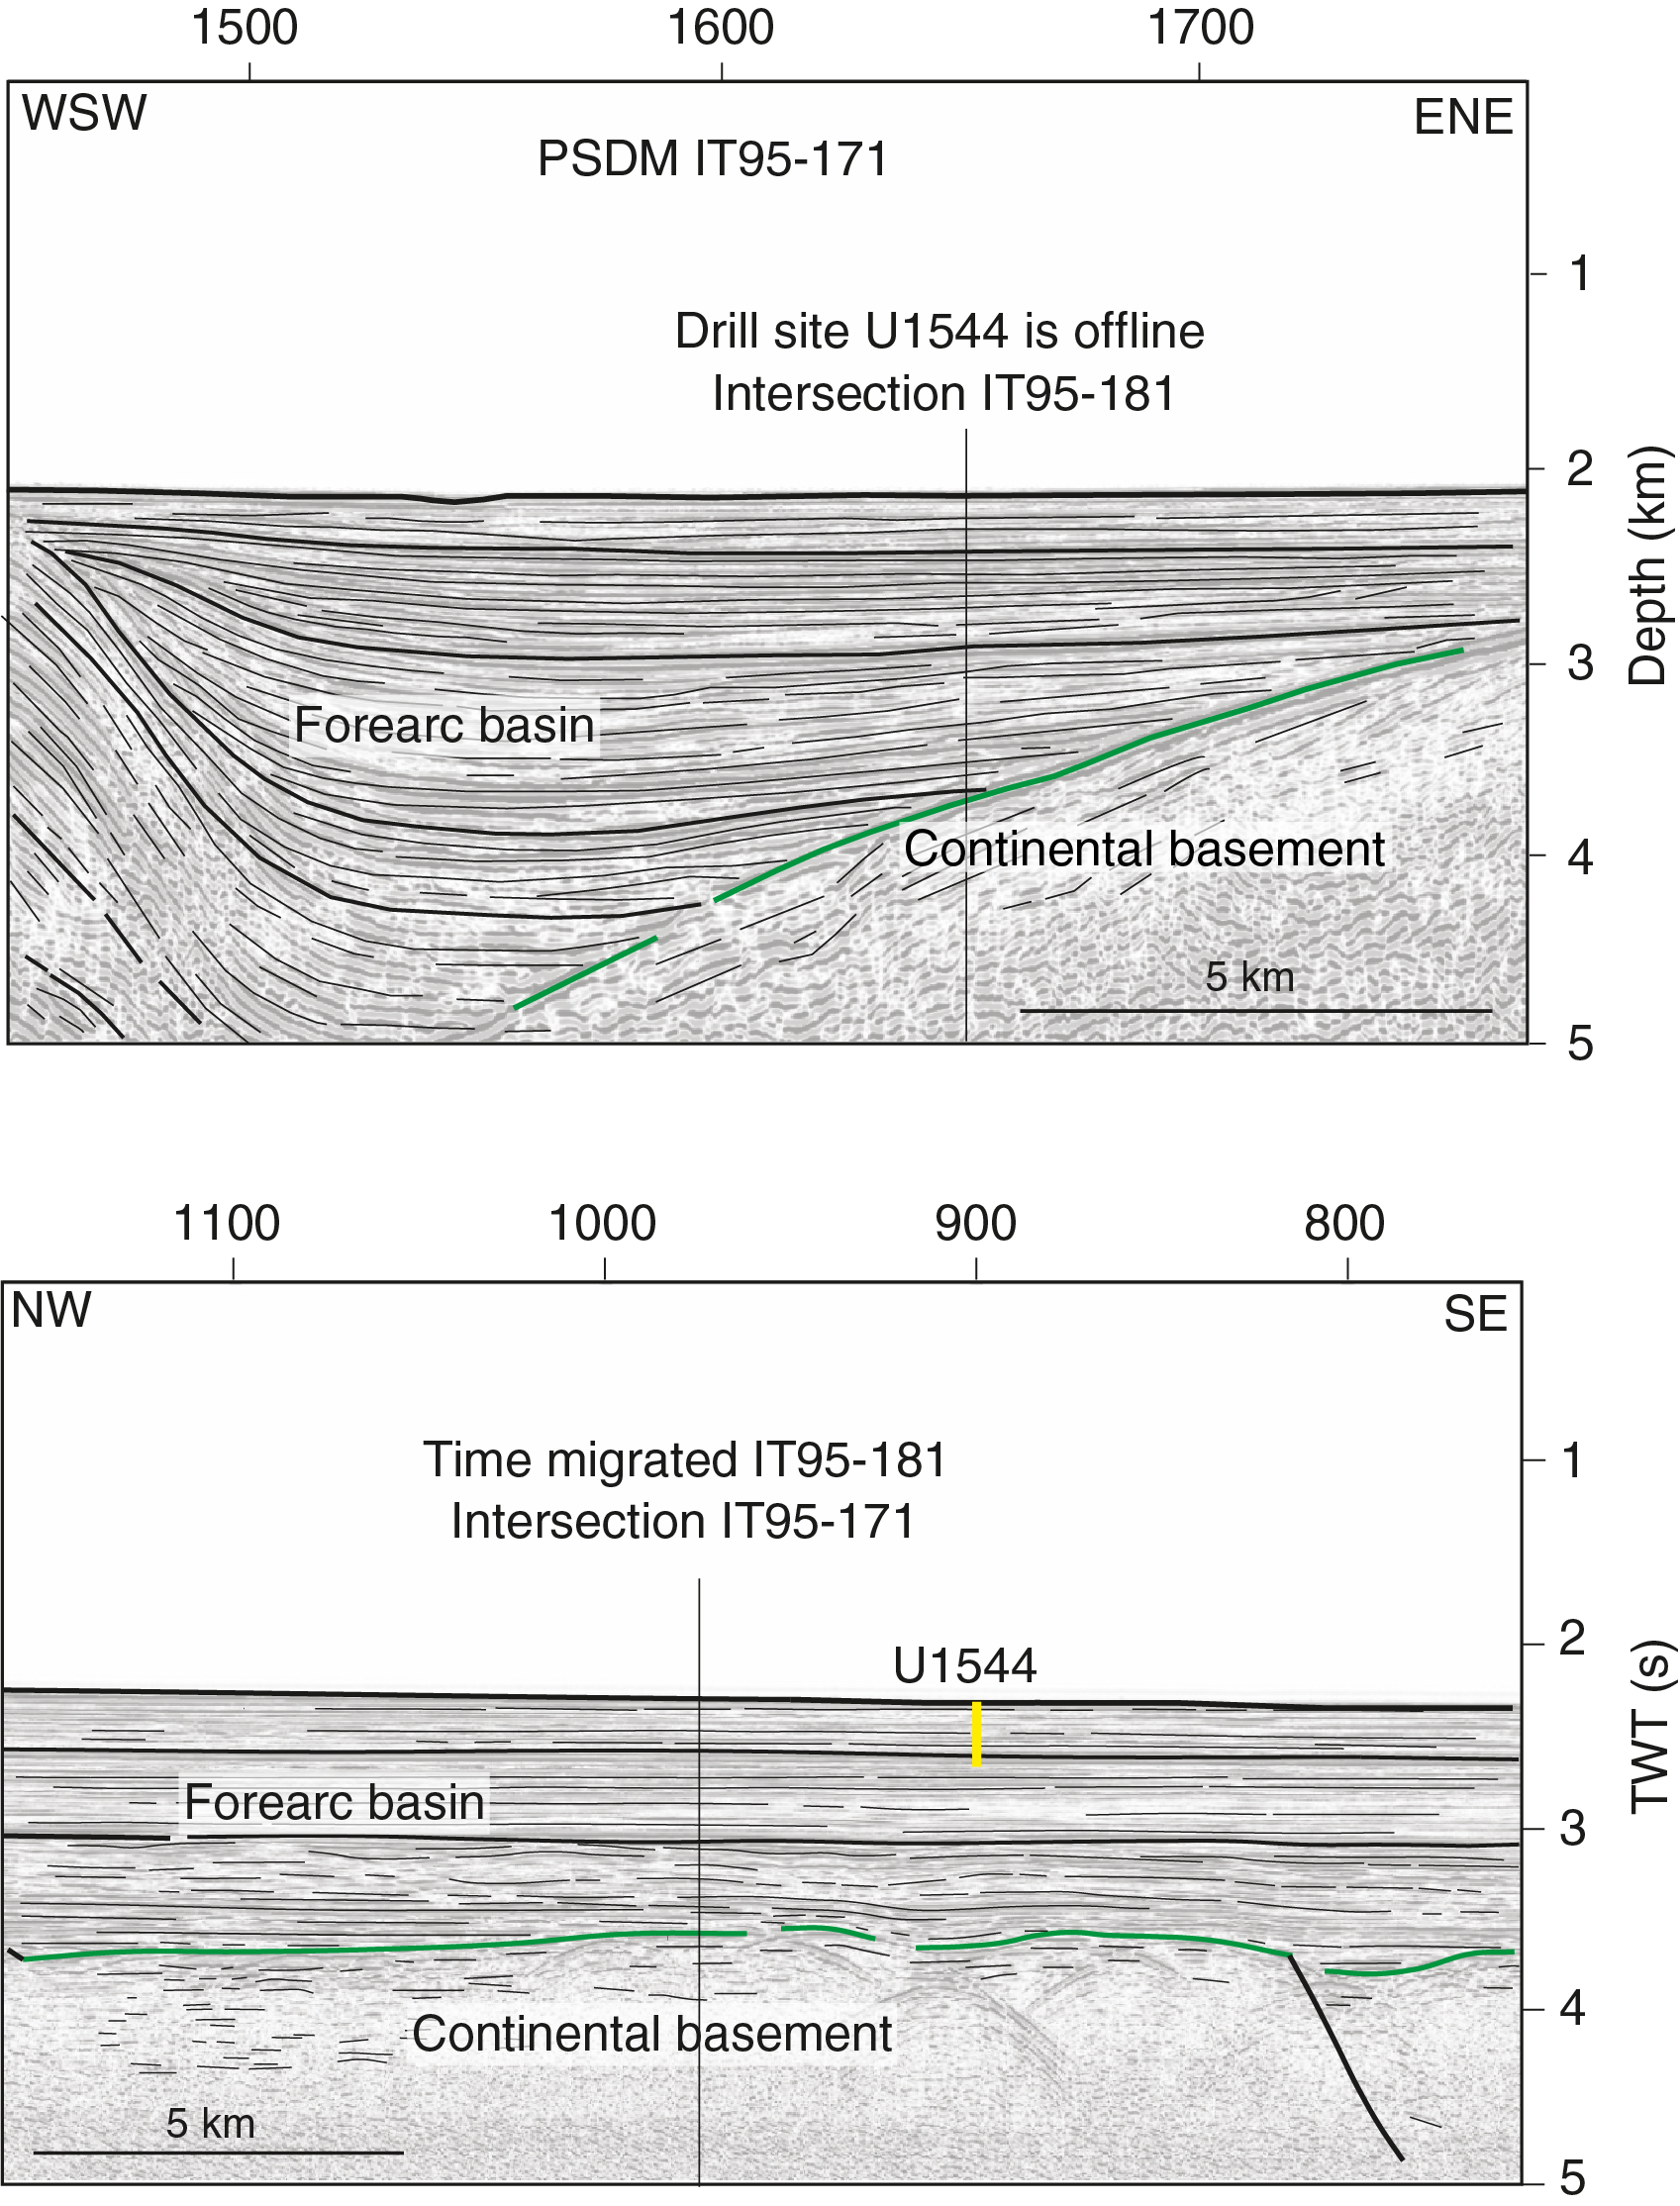
Figure F52. MCS and Parasound profiles, Site U1544.
Site U1544 is located underneath the southward-flowing CHC, a northern branch of the ACC that continues toward the Drake Passage and provides a major fraction of the present-day northern Drake Passage transport (Well and Roether, 2003). Satellite-tracked surface drifters reveal that after crossing the EPR, Subantarctic surface water of the ACC is transported northeastward across the ESP toward the Chile coast at ~45°S, 75°W (Figures F2, F37). Here, presently only a minor part of ACC water is deflected northward into the HCS, whereas the major fraction is deviated southward toward the Drake Passage. The CHC thus transports a significant amount of northern ACC water toward the Drake Passage within a narrow belt of ~100–150 km width along the coast (Chaigneau and Pizarro, 2005) (Figures F2, F37). Modern surface current velocities in the CHC reach >35 cm/s, and high flow speeds of ~20 cm/s extend to middepths (Boisvert, 1969; Chaigneau and Pizarro, 2005).
Site U1544 is presently located at the lower limit of LCDW and might have been affected by AABW in the past (Figure F38). The site is located ~4° north of the present SAF. Modern mean annual SST in this area is ~8.5°C, and the seasonal range is 3°C.
The main objectives at Site U1544 were to
- Recover Pleistocene paleoceanographic records over the past several glacial–interglacial cycles with suborbital-scale resolution,
- Reconstruct the strength of the CHC (Subantarctic ACC) before entering the Drake Passage,
- Investigate CDW and PDW water mass properties,
- Investigate changes of continental paleoclimate, and
- Recover a potential near-field record of PIS variability.
Operations
We arrived at Site U1544 at 1746 h on 14 July 2019. Soon after arrival, the rig floor crew assembled the APC/XCB BHA and deployed the drill string to the seafloor, reaching 2055 mbrf by midnight.
The initial attempt to spud Hole U1544A was made at 0015 h on 15 July and resulted in a bent/broken APC core barrel, which made it necessary to pull the bit back to the rig floor and remove the stuck portion of the barrel. The vessel was then moved 50 m southwest at 225° to attempt starting Hole U1544A again. Because of a hard layer below the sediment surface, we used the XCB system to spud the hole and break through the hard layer.
Hole U1544A finally was spudded at 1330 h on 15 July with the first core advancing 7.8 m into a softer formation. When the XCB core barrel was retrieved, we found a ~5 cm granite pebble in the core catcher. We then deployed the APC system and cored to APC refusal at 88.1 m CSF-A. The HLAPC system was used to deepen the hole to the final depth of 106.0 m CSF-A before coring was terminated because of high seas and winds. The drill string was pulled out of the hole, clearing the seafloor at 0958 h on 16 July and ending Hole U1544A.
The vessel was offset 20 m east of Hole U1544A with the bit at 2055 mbrf to wait for the seas to subside so an attempt could be made to spud Hole U1544B. However, heave was still above 3.5 m at 0630 h on 17 July, and operations were terminated. The drill pipe was pulled to the surface, and the vessel was secured for transit by 1300 h on 17 July, ending Site U1544. A total of 19 cores were taken over a 103.0 m interval with 89% recovery.
Principal results
Site U1544 consists of a 91.3 m sedimentary sequence obtained from a single hole (Figure F53). The sedimentary record comprises four lithofacies (Figure F54), all of which were identified at previous Expedition 383 sites. They include fine-grained (biosilica-bearing silty clay [Lithofacies 7] and silty clay [Lithofacies 8]) and coarse-grained (sand [Lithofacies 11]) siliciclastic sediments as well as biogenic sediments (diatom-, clay-, and/or silt-bearing to -rich nannofossil or calcareous ooze [Lithofacies 10]). The sedimentary sequence in Hole U1544A is dominated by siliciclastic sediments (Lithofacies 7, 8, and 11), with only sporadic layers of calcareous ooze. Sedimentation is characterized by highly variable sedimentation rates of ≥25 cm/ky, and rapidly deposited gravity-driven sedimentation (e.g., turbidities) contributes a significant fraction of the sedimentary sequence. Hole U1544A sediments make up only one lithostratigraphic unit in this hole, Unit I (7.7–106.1 m CSF-A), which covers the late Pleistocene interval. Unit I largely consists of greenish gray to dark greenish gray silty clay (Lithofacies 8) or biosilica-bearing silty clay (Lithofacies 7) that frequently alternates with prominent decimeter- to meter-scale dark gray sand layers that often have normal grading and erosional boundaries to underlying strata. Prominent <1 m thick beds of light gray to light greenish gray silt-bearing and foraminifer-rich nannofossil ooze occur in two intervals at 26–28 and 80.5–82.5 m CSF-A. Dropstones are rare, whereas mottling due to diagenetic overprints is minor but frequent. The uppermost core, 383-U1544A-2X, retrieved a single hard rock pebble that suggests a rocky and hard substrate close to the seafloor at this site.
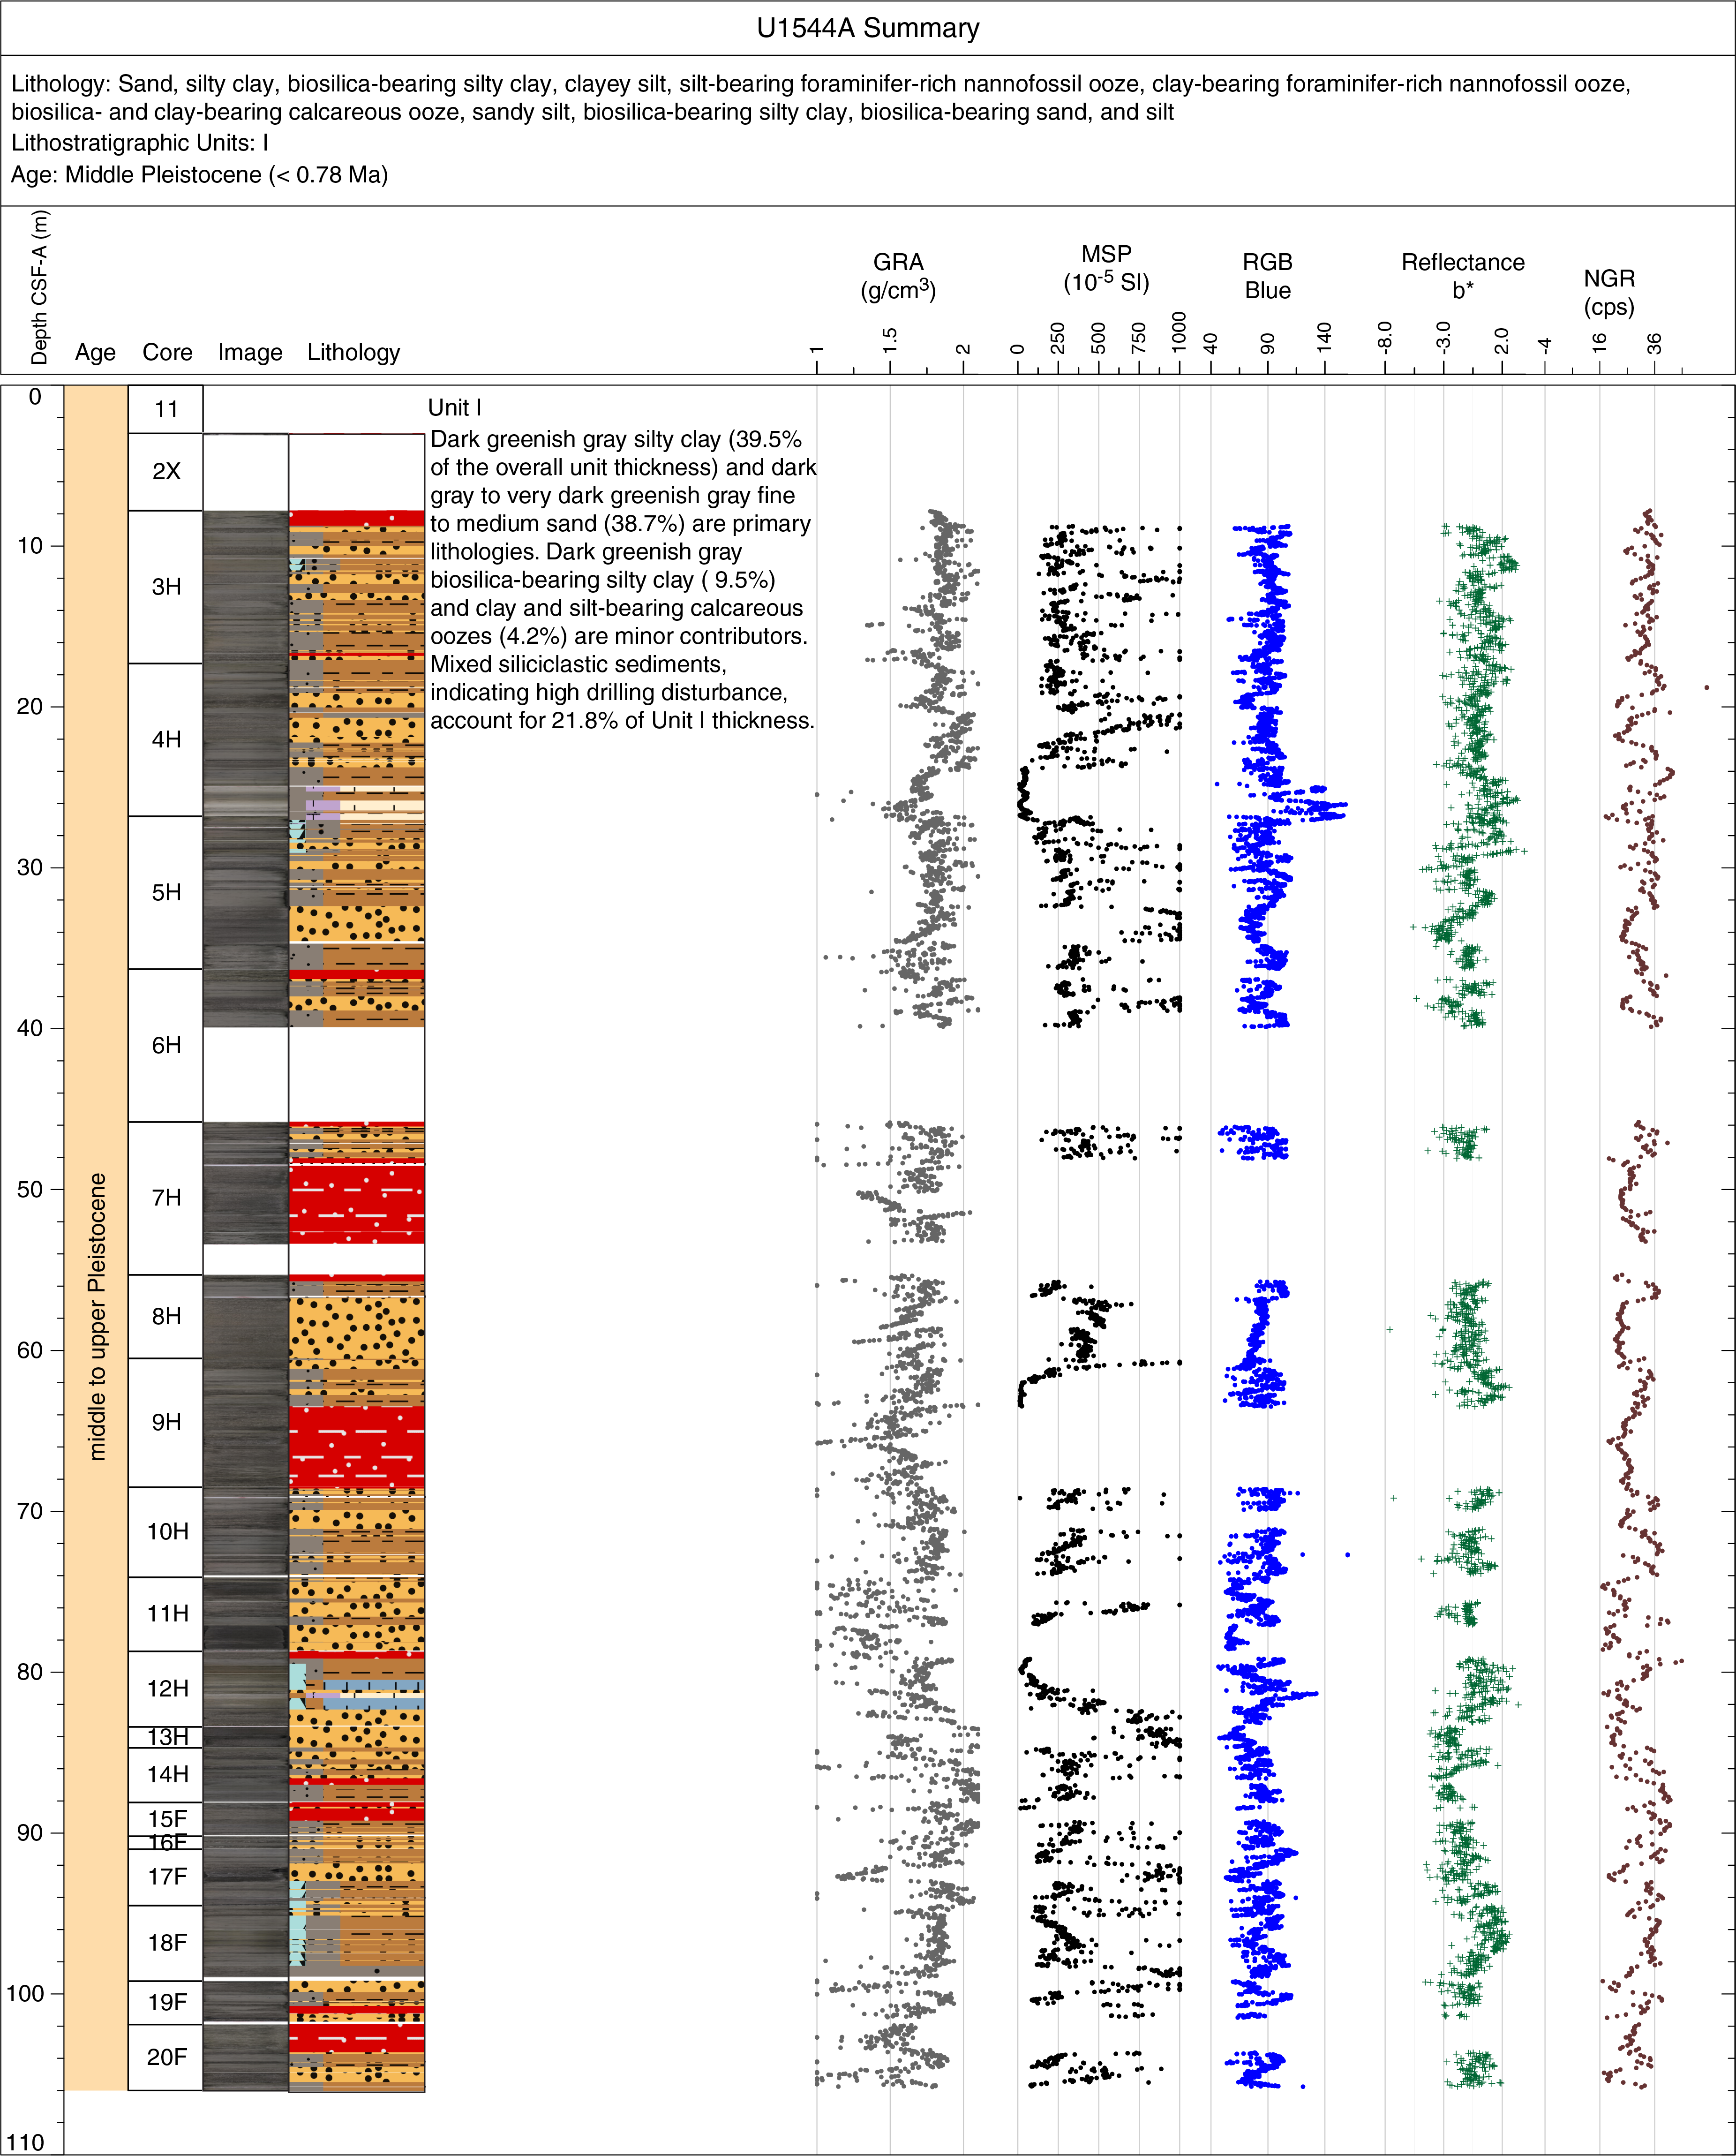
Figure F53. Hole summary, Site U1544.
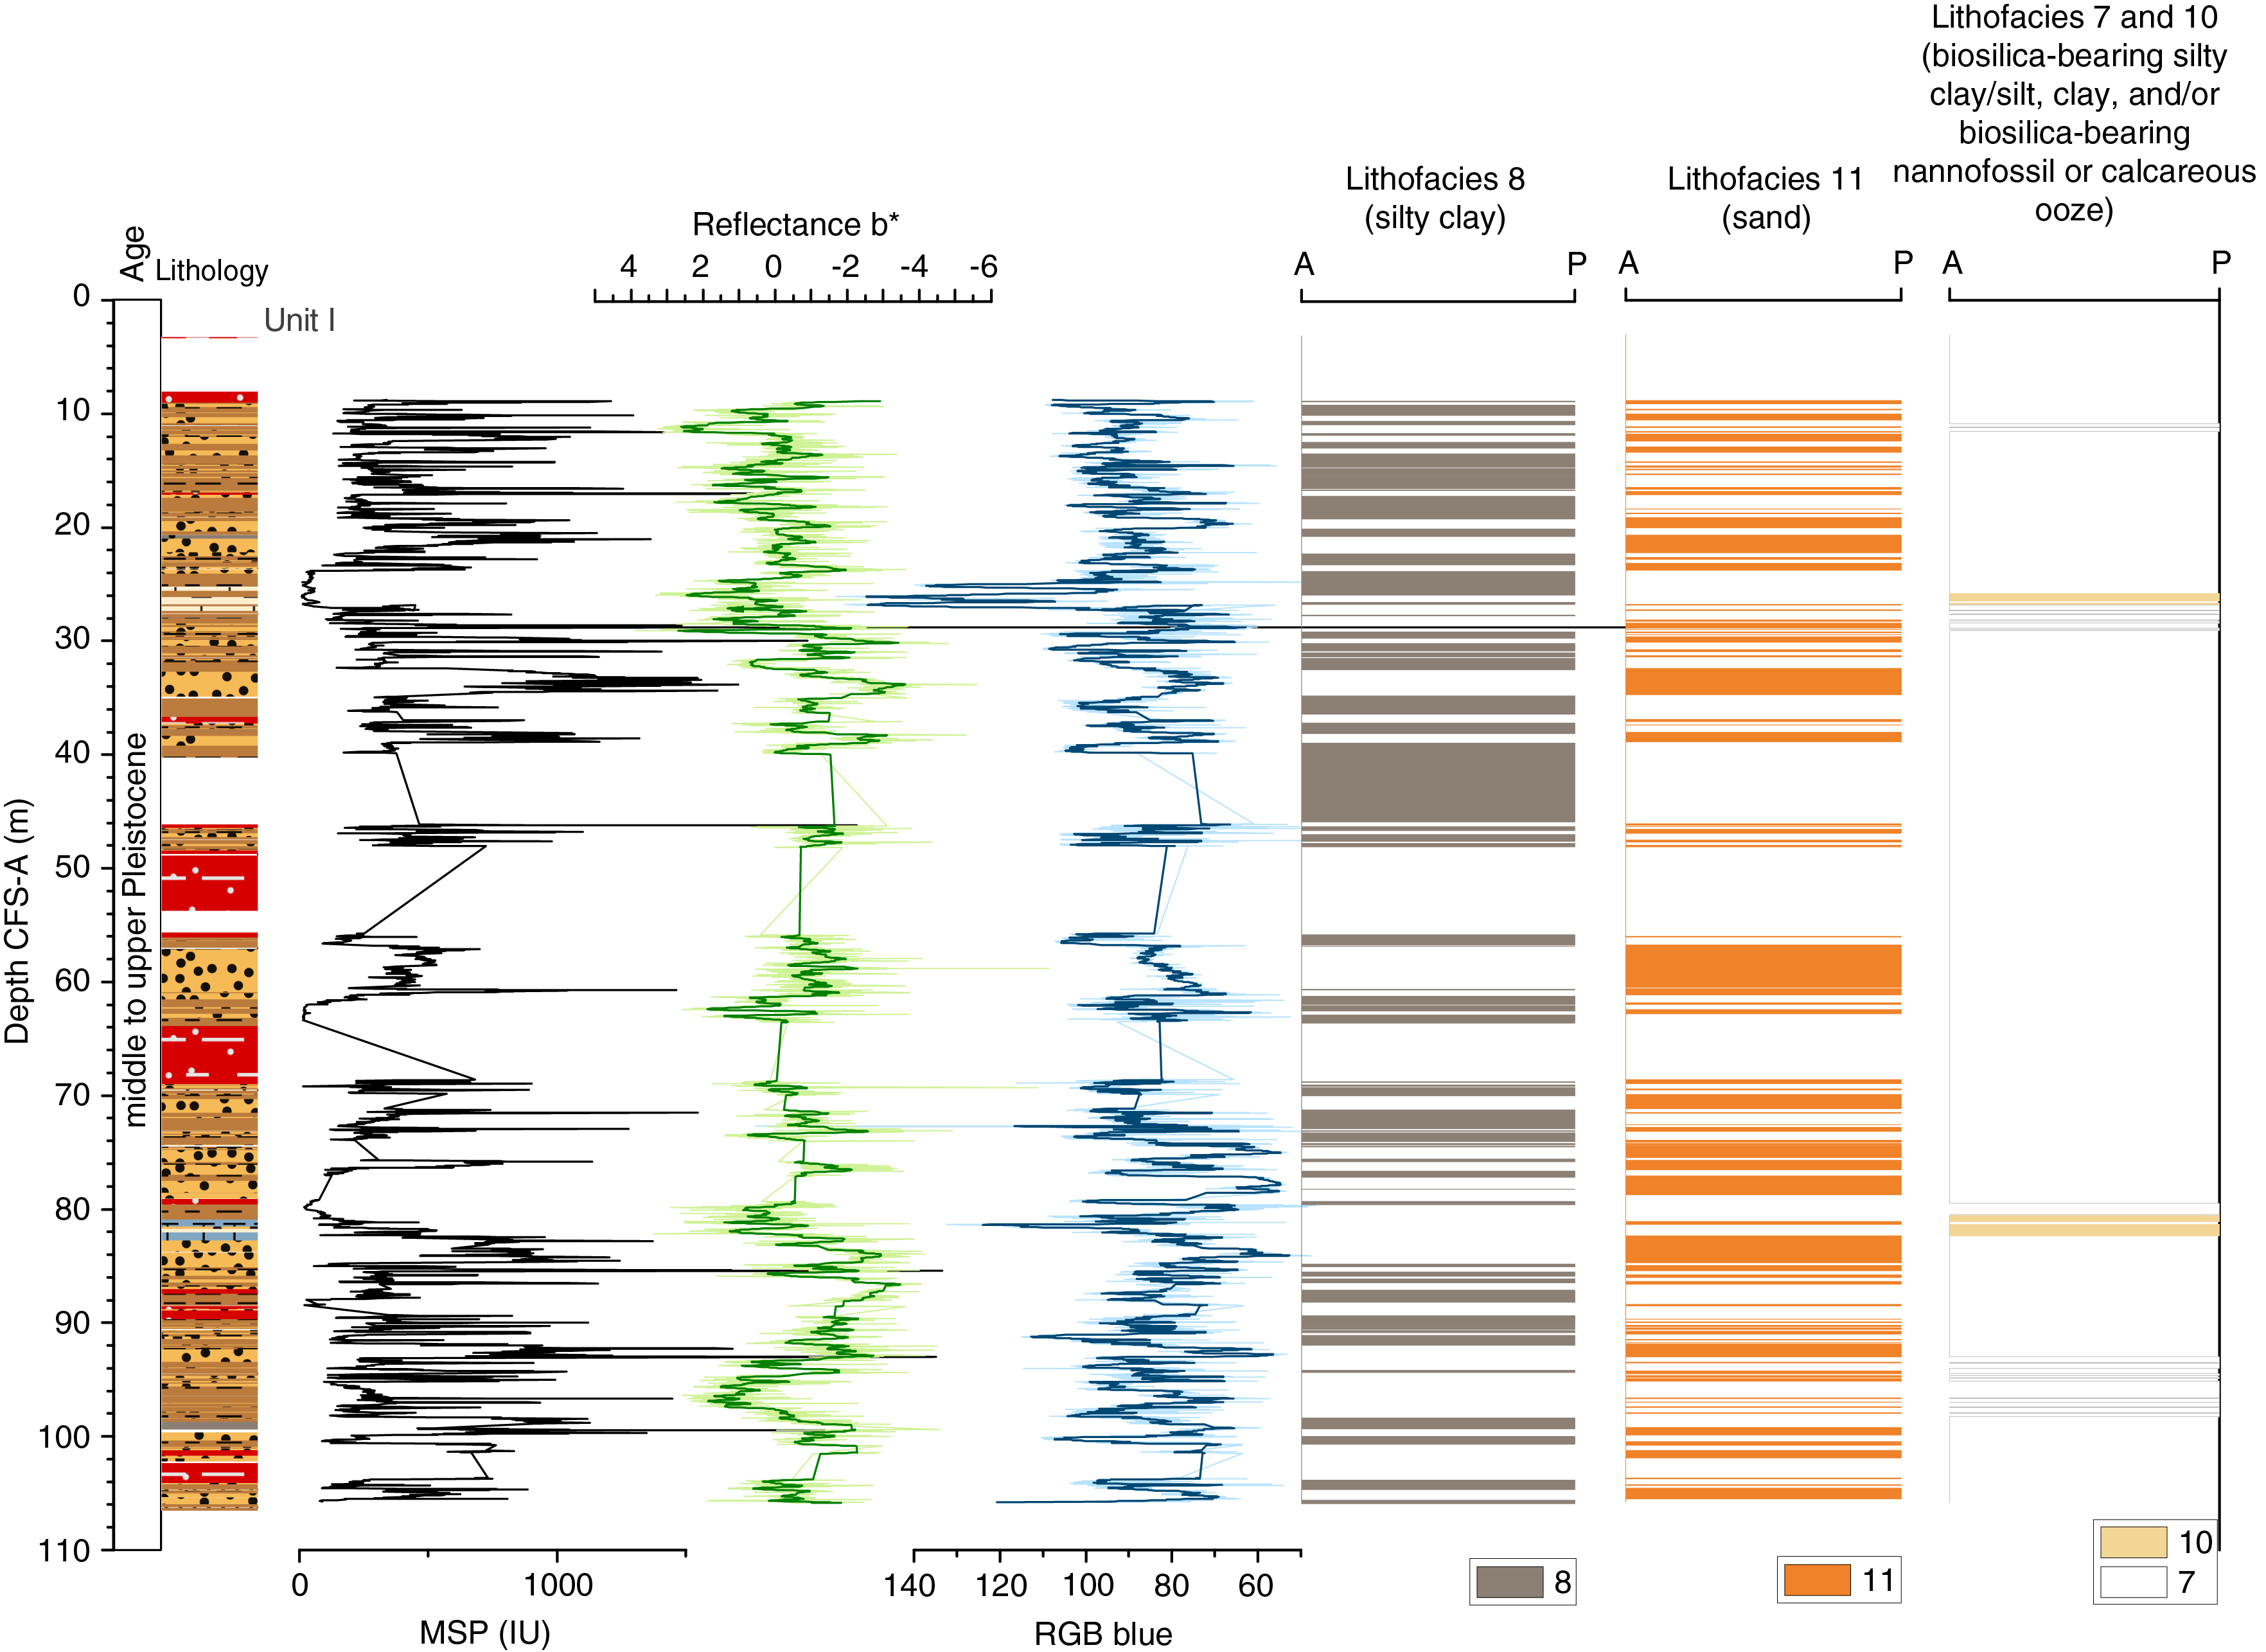
Figure F54. Primary lithostratigraphic variations, Site U1544.
Diatoms are rare to abundant throughout the sediment succession, radiolarians and silicoflagellates are absent, nannofossils are abundant to barren, benthic and planktonic foraminifers are abundant above ~85 m CSF-A, and ostracods are sparsely present throughout the sequence but abundant at ~60 and ~101 m CSF-A. The biostratigraphy of Site U1544 is not well constrained because of the lack of marker species for most fossil groups. Based on the biostratigraphic events recorded, the estimated age is <0.42 Ma at the bottom of Hole U1544A.
The NRM of archive-half core sections from Site U1544 was measured and remeasured after AF demagnetization at 2 cm increments. The intensities prior to demagnetization of cores recovered from Hole U1544A are relatively strong and generally lie in the 10–2 to 10–3 A/m range. Inclinations both before and after AF demagnetization at 15 mT are quite variable, reflecting the sandy nature of these sediments. Fine-grained intervals are often better defined, and steep and positive inclinations prior to demagnetization and steep and negative inclinations after suggest removal of a drill string magnetic overprint giving way to a primary remanence that varies around expected directions (–71°) for the site latitude during normal polarity. Although the record is very noisy, no evidence for reliable reversed polarity is observed, suggesting that Site U1544 sediments are younger than 0.781 Ma (Hilgen et al., 2012).
We constructed a preliminary age model based on biostratigraphic age markers. These data suggest that the sedimentary sequence recovered at Site U1544 covers less than ~0.4 My. Sedimentation rates are high and average ~25 cm/ky.
The low sampling resolution makes it difficult to interpret interstitial water profiles from this site. Low sulfate and high methane concentrations suggest that the sulfate–methane transition zone occurs shallower than ~10 m CSF-A (Iversen and Jorgensen, 1985). The high alkalinity indicates that organic matter degradation is dominated by anaerobic processes, and concentrations of interstitial water iron suggest that microbial iron reduction also occurs at this site. Because of limited time, only two samples were analyzed for TN and carbon, and observed TN values are among the highest of all Expedition 383 sites.
At this site, the downhole changes in physical property characteristics do not show obvious features aligned with the defined lithofacies based on sedimentologic characteristics (Figure F55). Principally, lower MS and low GRA bulk density values match the interval of higher biogenic component, but they do not show a unique relationship with one another throughout the record. Comparing NGR and MS records could provide indications about the different terrigenous components because they are mainly anticorrelated as at shallow-water Site U1542.
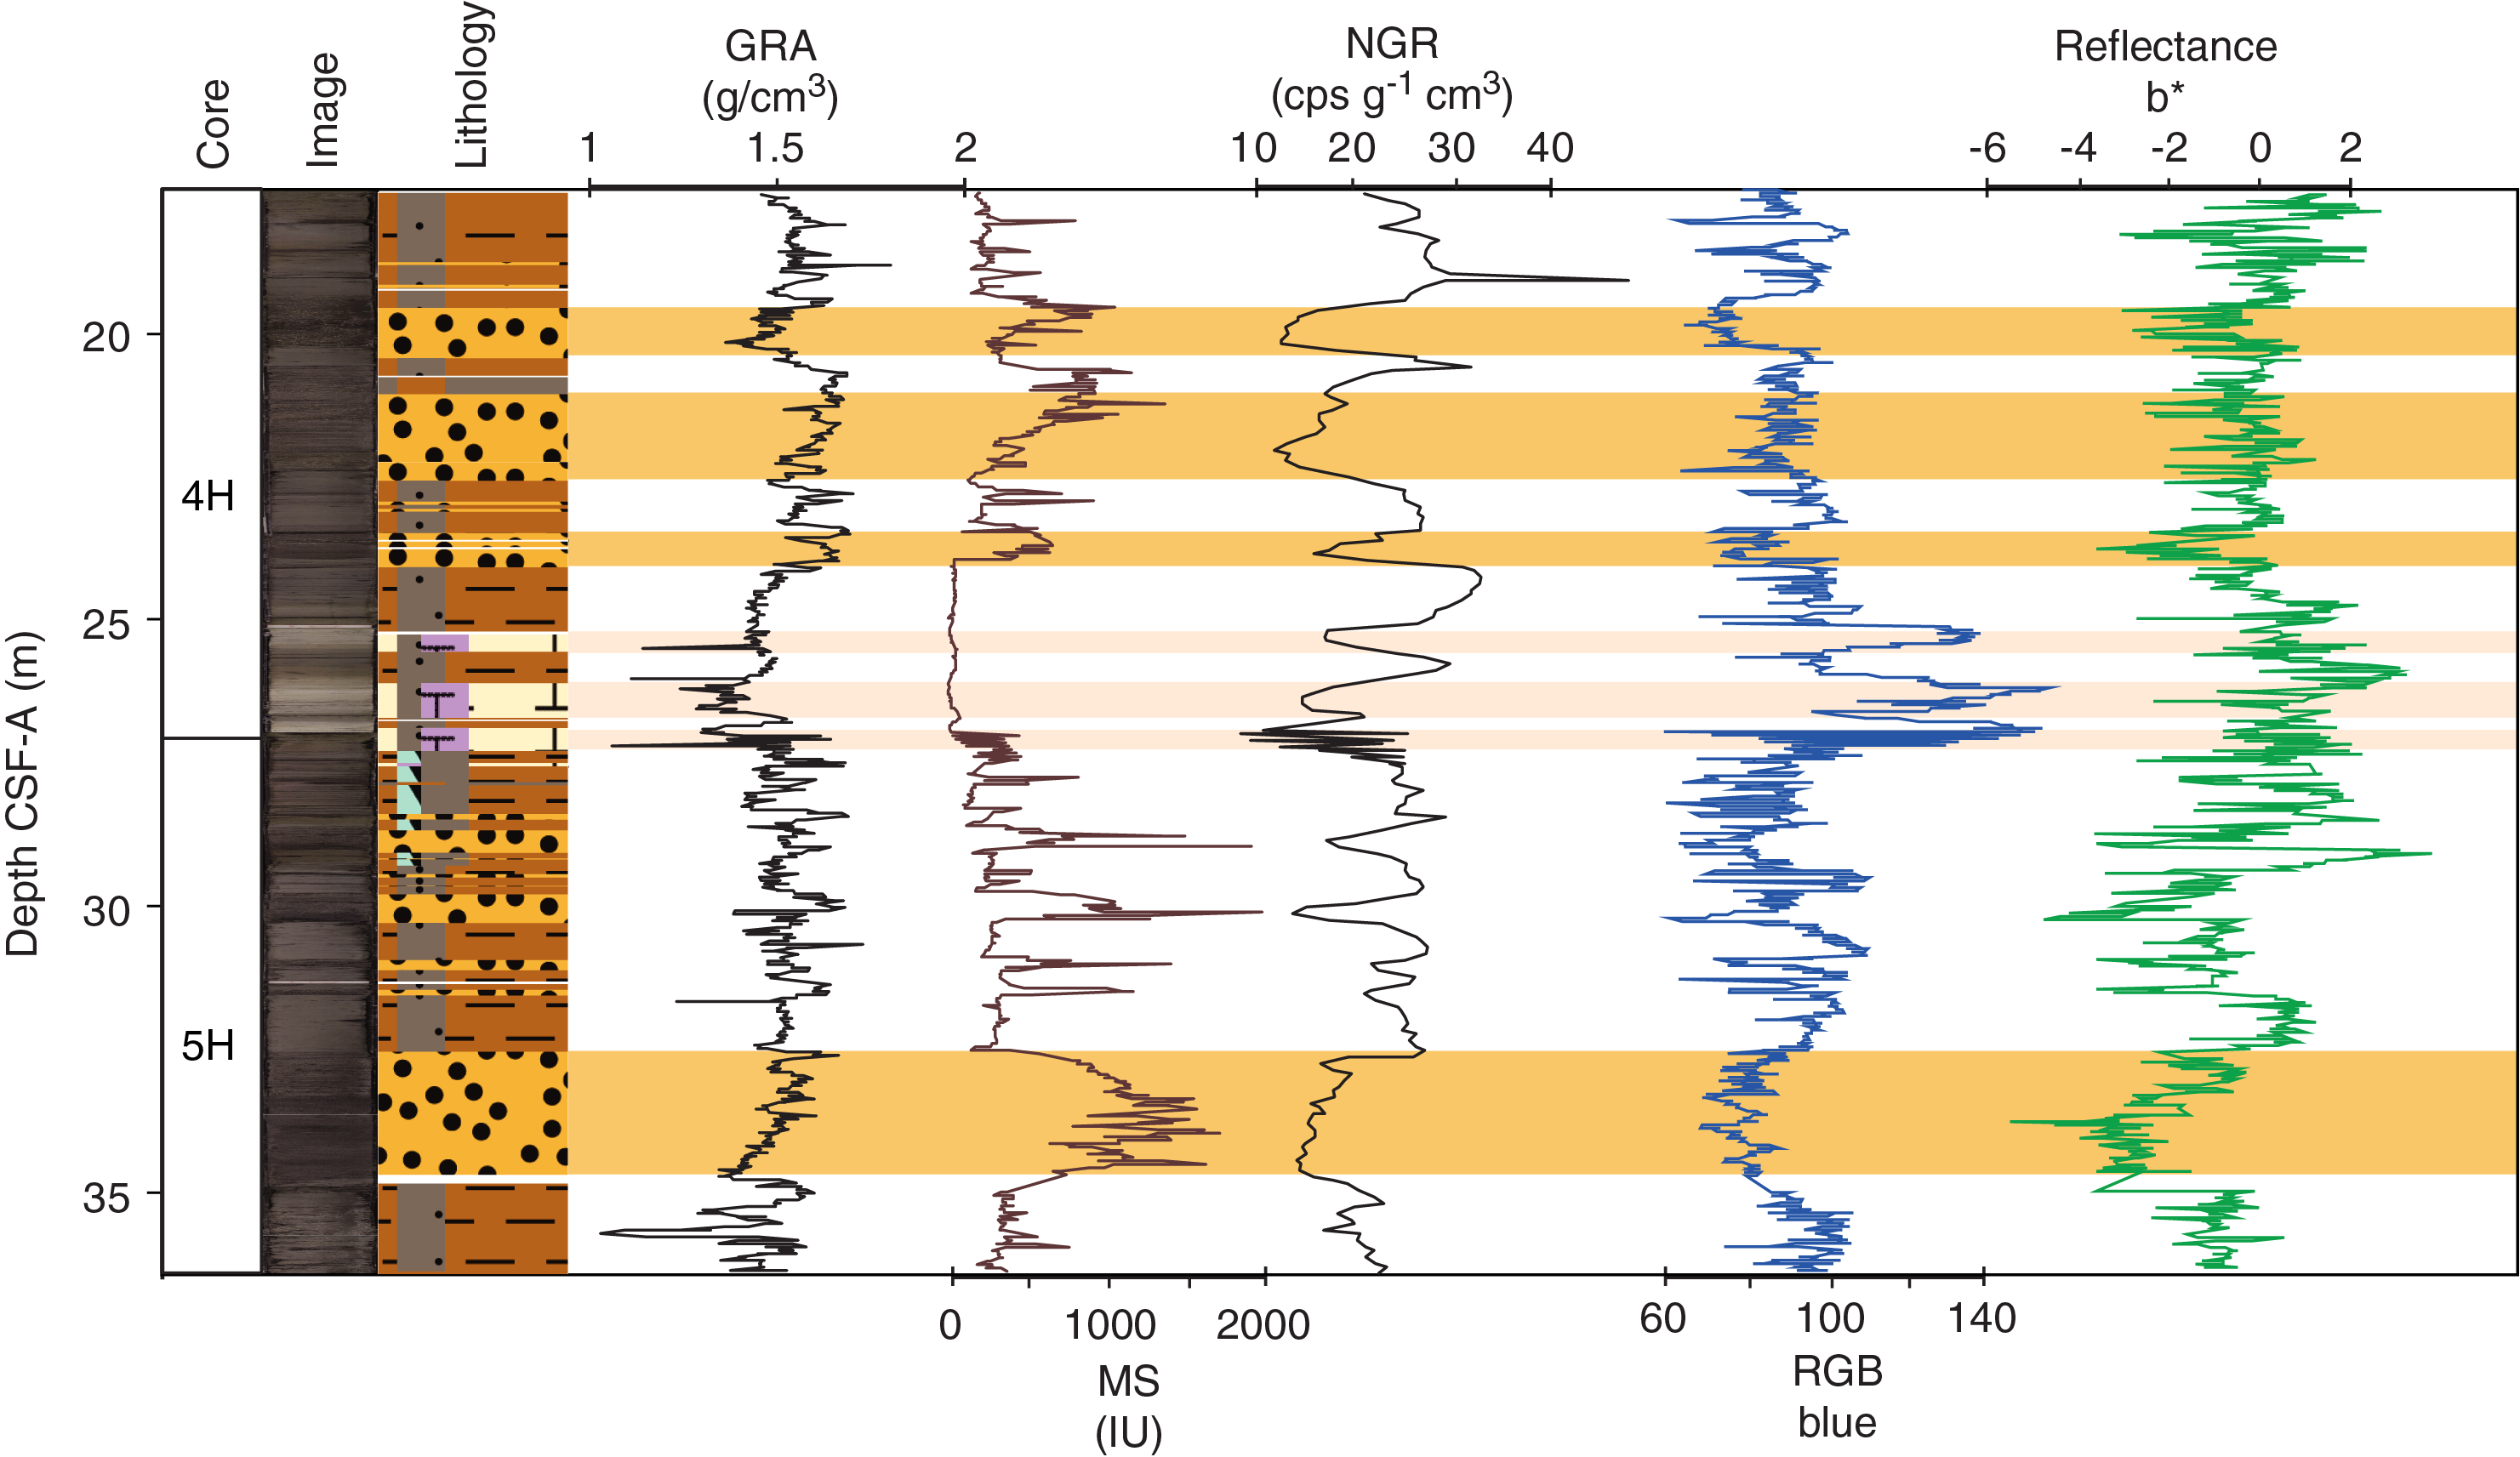
Figure F55. Physical properties, Hole U1544A.
The close proximity of Site U1544 to the southernmost Chilean margin explains the dominance of terrigenous sediments at this site. Terrigenous sediment is likely delivered to the site by a combination of ice rafting, suspension fallout from glacial meltwater plumes and/or freshwater plumes that originate from nonglaciated catchments, fine-grained sediments transported by the CHC entering the Drake Passage as the northern branch of the ACC, and perhaps most importantly, episodic downslope transport from the outer continental shelf. The large proportion of normally graded sand beds with erosive basal contacts implies that turbidity currents were a transport mechanism to carry sediments from the continental shelf and the upper slope during the Pleistocene. We conservatively estimate the contribution of turbidities as ~40% based on the thickness of sand layers (Lithofacies 11). However, it is possible that a certain fraction of the hemipelagic sediments also represents the uppermost portion of the normal graded turbidite deposition sequence. If so, then turbidites may account for even a larger proportion of the sequence and sedimentation at Site U1544 was often interrupted by gravity-driven flows. Future geochemical and sedimentary analyses will provide crucial insights into the nature and temporal evolution of sedimentation processes at Site U1544.
Preliminary scientific assessment
The overall goal of Expedition 383 was to improve our knowledge of Pliocene–Pleistocene atmosphere-ocean dynamics of the ACC in the Pacific and their implications for regional and global climate and atmospheric CO2 based on sediment records with highest possible resolution.
Expedition 383 was very successful. We accomplished drilling and coring at six of the planned seven sites in the South Pacific. The drilling and coring objectives were largely achieved, and a total of 2636 m of core was recovered from six sites over a 2649 m cored interval. This is the first time sedimentary records of this length and, in particular, of this resolution have been recovered from the South Pacific. We achieved our overall goal of recovering sedimentary sequences to improve our knowledge of Pliocene–Pleistocene atmosphere-ocean dynamics. Based on extrapolating sedimentation rates from the site survey cores and the planned length of the drilled sequences, we expected to reach the early Pliocene (~5 Ma). At two of our sites (U1541 and U1543), we were able to drill continuous sequences that reach back to about 8 Ma, well into the Miocene, thus exceeding our expectations and allowing an even more complete investigation of the long-term evolution of the climate system in the South Pacific. The key achievements of the drilling operations include the following:
- All sequences cored except at Site U1544 are continuous and do not display any shipboard detectable hiatuses.
- Site U1539 and to a lesser extent Site U1540 have very high sedimentation rates (as high as 30 cm/ky at Site U1539) for a pelagic setting, thus allowing for the first time analyses of climate variability at millennial and submillennial timescales in the Southern Ocean. The sites are complemented by a lower resolution site, U1541, with a remarkably constant sedimentation rate of 2.7 cm/ky downhole to ~3 Ma and then ~1.3 cm/ky during most of the Pliocene and late Miocene. It provides a continuous paleoclimate record back to the Miocene that is expected to serve as a reference site for the region.
- Sites U1541 and U1543 provide the longest continuous paleoceanographic records obtained in the Southern Ocean.
- Even though poor weather prevented the completion of the cross-frontal transect in the central South Pacific, Site U1539, closest to the modern SAF, and Site U1540, ~170 nmi north of the SAF, provide pronounced lithologic differences, suggesting strong gradients between both sites, particularly during glacial periods.
- The recovery of two Miocene to recent cores from the CSP (Site U1541) and the ESP (Site U1543) provides an excellent opportunity to create a comparative zonal transect across the ESP over the past 8 My that can be used to assess ACC variability.
Despite the drilling success at the six sites, the overall expedition experienced two challenges that affected the drilling strategy and, to some extent, the scientific objectives.
- Approval to drill in Chilean waters. By the time we left Punta Arenas on 24 May 2019, we had not obtained approval from the Chilean authorities to conduct drilling and coring operations in their territorial waters. This forced us to change the original operations plan by reordering the sequence of our sites to allow the Chilean authorities more time for approval for the initial sites planned in Chilean waters. We received notice about clearance on 31 May, 1 week into the expedition when we were already well underway to the drill sites in the CSP. The delay in obtaining the permits severely limited our flexibility in planning operations.
- Weather-related interruptions and adjustments. During the entire expedition, we faced rough weather and sea conditions that impacted our drilling operation and required us to adjust our drilling plans on a continuous basis. Weather-related challenges were anticipated because Expedition 383 was targeting areas of the South Pacific Ocean that are within the range of maximum wind speeds of the SWW. Expedition 383 was scheduled during austral autumn/winter when historical weather records show winds speeds in the Pacific Southern Ocean to be substantially reduced. However, we encountered rough weather and seas above the long-term climatological mean resulting in the loss of substantial operational time. Broadly, the weather-related issues were two different types:
- Weather and sea conditions on site stopped coring operations and partly prohibited the coring of three full holes per site as originally planned. At most of the sites, we had to interrupt drilling operations because of high seas and resulting high heave. In these cases, we stayed on site, waited until the seas calmed sufficiently, and continued drilling. Such conditions lead to a total of 106 h of lost drilling time. In addition to the loss of time on site, high heave caused excessive drilling disturbance at some sites and along some intervals of the core. Although minor (on the order of meters), it prevented us from developing composite records completely devoid of gaps and obtaining sufficient material to create multiple copies of the composite sequence.
- While drilling at Site U1541 in the central South Pacific, a large-scale (>2000 km) storm system developed in the Southeast Pacific and forced us to transit on a northeast course across the South Pacific on a bad-weather avoidance course. This not only caused a significant loss of time (12.3 days) but also made it impossible to reach one of our targeted sites, Proposed Site CSP-3A, at 60°S close to the APF. As a result of the bad-weather avoidance, we had to eliminate Site CSP-3A from our expedition plan.
Despite encountering weather-related challenges, we were successful in mitigating the impacts on the scientific drilling program through good time management, intense attention to weather forecasting, and excellent communication with the captain and the operations superintendent.
Assessment related to the scientific hypotheses
Expedition 383 was built around two major scientific hypotheses. Here, we break down the objectives of the expedition in the context of these two hypotheses and document the achievements and potential for each hypothesis.
- Hypothesis H1: ACC dynamics and Drake Passage throughflow conditioned the global MOC and high-low climate linkages on orbital and submillennial timescales since the Pliocene.
The Drake Passage is the major geographic constriction for the ACC and forms an important pathway for the return of upper waters to the Atlantic through the cold-water route of the MOC (Gordon, 1986). Resolving changes in the flow of circumpolar water masses through the Drake Passage is crucial for advancing our understanding of the Southern Ocean’s role in affecting ocean and climate change on a global scale. Before Expedition 383, reconstructions of the throughflow along the Chilean margin were limited to the past 60 ky and no further information was available. We were highly successful in drilling Site U1542, which will extend this type of record back to the middle Pleistocene. Site U1542 is complemented by a long and detailed record from Site U1543 in the ESP that reaches back to the Miocene. The weather conditions at Site U1543 were extremely favorable for the region and allowed us to drill two holes deeper than 300 m without any interruption and with a minimum of heave-related drilling disturbance. The record recovered at this site has an excellent paleomagnetic chronology and a pronounced variability in MS that provides a promising stratigraphic tuning target. At the third site in the region, U1544, the borehole depth had to be shortened to about 100 m because of rough weather and time constraints at the end of the expedition. Accordingly, the record at this site is much shorter and limited to the last few glacial cycles, but it will prove helpful to evaluate Hypothesis H1 with regard to the last interglacial period, MIS 5, and potentially MIS 7. However, two fully occupied sites (U1542 and U1543) provide continuous and very well dated sequences that include relatively highly resolved interglacials and glacial–interglacial transitions. The two sites together will allow us to address the long-term, orbital-scale, and millennial-scale evolution and variability in ACC strength and Drake Passage throughflow, particularly in warmer-than-present interglacials (e.g., MIS 5e, 11, and 31) and across the Pliocene warm period at Site U1543. We anticipate that the recovered material will allow us to fully tackle Hypothesis H1 and associated research questions beyond the originally proposed Pliocene–Pleistocene timescale to the late Miocene.
- Hypothesis H2: Variations in the Pacific ACC determine the physical and biological characteristics of the oceanic carbon pump and atmospheric CO2.
Atmosphere-ocean-cryosphere interactions and teleconnections between high and low latitudes play an important role in understanding processes and feedbacks of past and future climate change, and the Subantarctic Southern Ocean provides the major link between Antarctica and the low latitudes. In the Southern Ocean, these interactions are believed to control sea ice cover, AIS dynamics, upper ocean stratification, biological nutrient utilization, and exposure rates of deep water. They have been considered to play a key role in explaining the variability in atmospheric CO2 concentrations.
We drilled three excellent sites in the Subantarctic South Pacific, U1539–U1541, that matched or even exceeded our expectations for these records in resolution (Site U1539) and covered time period (Site U1541). These drill cores from the Pacific sector of the Southern Ocean will allow us to explore in more detail the glacial–interglacial changes and longer term climate evolution north of the APF. Our drill sites from the CSP (U1539–U1541) will provide robust data to test to what extent processes described from the Atlantic sector can be translated to the Pacific sector, thus allowing the construction of a more global picture of the Southern Ocean’s role in nutrient distribution and biogenic export production and their impact on CO2 variations. The cores will enable us to generate key records of SST, dust, export production, and other parameters back to the Miocene. These reconstructions will provide important benchmarks for a climate-sensitive region that are important constraints to more realistically model the impact on the ocean carbon cycle under different climate boundary conditions.
Unfortunately, we were not able to reach the southern site close to the APF zone (Proposed Site CSP-3A) because of persistent rough weather in the region; therefore, we were not able to complete the cross-frontal transect. The elimination of this key site from Expedition 383 has impacts on some aspects of testing Hypotheses H2 and related research questions that target processes in the south of the APF as well as comparisons between the Subantarctic and Antarctic zone.
At two of the sites (U1540 and U1541) east and west of the EPR, we drilled to the basement of the overlying sediment sequence. The lowermost sediments at both sites provide evidence of hydrothermal alteration that may add an unforeseen aspect to the future research at the Expedition 383 sites.
The potential range of scientific applications for the unique set of cores drilled during Expedition 383 is very large, encompassing paleoclimate reconstructions, carbon cycle, evaluation of hydrothermal inputs, geochemistry, reconstruction of ice sheet variability, land-ocean interaction, and sedimentary processes. We anticipate exciting and impactful results from both the science party and the scientific community at large for many years to come.
References
Anderson, R.F., Ali, S., Bradtmiller, L.I., Nielsen, S.H.H., Fleisher, M.Q., Anderson, B.E., and Burckle, L.H., 2009. Wind-driven upwelling in the Southern Ocean and the deglacial rise in atmospheric CO2. Science, 323(5920):1443–1448. https://doi.org/
Anderson, R.F., Barker, S., Fleisher, M., Gersonde, R., Goldstein, S.L., Kuhn, G., Mortyn, P.G., Pahnke, K., and Sachs, J.P., 2014. Biological response to millennial variability of dust and nutrient supply in the subantarctic South Atlantic Ocean. Philosophical Transactions of the Royal Society A: Mathematical, Physical and Engineering Sciences, 372(219):20130054. https://doi.org/
Barker, S., and Diz, P., 2014. Timing of the descent into the last ice age determined by the bipolar seesaw. Paleoceanography and Paleoclimatology, 29(6):489–507. https://doi.org/
Barrows, T.T., Juggins, S., De Deckker, P., Calvo, E., and Pelejero, C., 2007. Long‐term sea surface temperature and climate change in the Australian–New Zealand region. Paleoceanography and Paleoclimatology, 22(2):PA2215. https://doi.org/
Beal, L.M., De Ruijter, W.P.M., Biastoch, A., Zahn, R., and SCOR/WCRP/IAPSO Working Group 136, 2011. On the role of the Agulhas system in ocean circulation and climate. Nature, 472(7344):429–436. https://doi.org/
Benz, V., Esper, O., Gersonde, R., Lamy, F., and Tiedemann, R., 2016. Last Glacial Maximum sea surface temperature and sea-ice extent in the Pacific sector of the Southern Ocean. Quaternary Science Reviews, 146:216–237. https://doi.org/
Boisvert, W.E., 1969. Technical Report: Major Currents off the West Coasts of North and South America: Washington, D.C. (Naval Oceanographic Office). https://catalog.hathitrust.org/
Bostock, H.C., Sutton, P.J., Williams, M.J.M., and Opdyke, B.N., 2013. Reviewing the circulation and mixing of Antarctic Intermediate Water in the South Pacific using evidence from geochemical tracers and Argo float trajectories. Deep Sea Research, Part I: Oceanographic Research Papers, 73:84–98. https://doi.org/
Bradtmiller, L.I., Anderson, R.F., Fleisher, M.Q., and Burckle, L.H., 2009. Comparing glacial and Holocene opal fluxes in the Pacific sector of the Southern Ocean. Paleoceanography and Paleoclimatology, 24(2):PA2214. https://doi.org/
Brierley, C.M., Fedorov, A.V., Liu, Z., Herbert, T.D., Lawrence, K.T., and LaRiviere, J.P., 2009. Greatly expanded tropical warm pool and weakened Hadley circulation in the early Pliocene. Science, 323(5922):1714–1718. https://doi.org/
Brovkin, V., Ganopolski, A., Archer, D., and Rahmstorf, S., 2007. Lowering of glacial atmospheric CO2 in response to changes in oceanic circulation and marine biogeochemistry. Paleoceanography and Paleoclimatology, 22(4):PA4202. https://doi.org/
Callahan, J.E., 1972. The structure and circulation of deep water in the Antarctic. Deep-Sea Research and Oceanographic Abstracts, 19(8):563–575. https://doi.org/
Cande, S.C., and Kent, D.V., 1995. Revised calibration of the geomagnetic polarity timescale for the Late Cretaceous and Cenozoic. Journal of Geophysical Research: Solid Earth, 100(B4):6093–6095. https://doi.org/
Caniupán, M., Lamy, F., Lange, C.B., Kaiser, J., Arz, H., Kilian, R., Baeza Urrea, O., et al., 2011. Millennial‐scale sea surface temperature and Patagonian Ice Sheet changes off southernmost Chile (53°S) over the past ~60 kyr. Paleoceanography and Paleoclimatology, 26(3):PA3221. https://doi.org/
Chaigneau, A., and Pizarro, O., 2005. Surface circulation and fronts of the South Pacific Ocean, east of 120°W. Geophysical Research Letters, 32(8):L08605. https://doi.org/
Chalk, T.B., Hain, M.P., Foster, G.L., Rohling, E.J., Sexton, P.F., Badger, M.P.S., Cherry, S.G., et al., 2017. Causes of ice age intensification across the Mid-Pleistocene Transition. Proceedings of the National Academy of Sciences of the United States of America, 114(50):13114–13119. https://doi.org/
Chase, Z., Anderson, R.F., Fleisher, M.Q., and Kubik, P.W., 2003. Accumulation of biogenic and lithogenic material in the Pacific sector of the Southern Ocean during the past 40,000 years. Deep Sea Research, Part II: Topical Studies in Oceanography, 50(3–4):799–832. https://doi.org/
Chase, Z., Kohfeld, K.E., and Matsumoto, K., 2015. Controls on biogenic silica burial in the Southern Ocean. Global Biogeochemical Cycles, 29(10):1599–1616. https://doi.org/
Cook, C.P., van de Flierdt, T., Williams, T., Hemming, S.R., Iwai, M., Kobayashi, M., Jimenez-Espejo, F.J., et al., 2013. Dynamic behaviour of the East Antarctic Ice Sheet during Pliocene warmth. Nature Geoscience, 6(9):765–769. https://doi.org/
Cortese, G., Gersonde, R., Hillenbrand, C.-D., and Kuhn, G., 2004. Opal sedimentation shifts in the world ocean over the last 15 Myr. Earth and Planetary Science Letters, 224(3–4):509–527. https://doi.org/
de Baar, H.J.W., de Jong, J.T.M., Bakker, D.C.E., Löscher, B.M., Veth, C., Bathmann, U., and Smetacek, V., 1995. Importance of iron for plankton blooms and carbon dioxide drawdown in the Southern Ocean. Nature, 373(6513):412–415. https://doi.org/
De Deckker, P., Moros, M., Perner, K., and Jansen, E., 2012. Influence of the tropics and southern westerlies on glacial interhemispheric asymmetry. Nature Geoscience, 5(4):266–269. https://doi.org/
Deacon, G.E.R., 1937. Discovery Reports (Volume 15): The Hydrology of the Southern Ocean: Cambridge, United Kingdom (Cambridge University Press).
Dekens, P.S., Ravelo, A.C., and McCarthy, M.D., 2007. Warm upwelling regions in the Pliocene warm period. Paleoceanography and Paleoclimatology, 22(3):PA3211. https://doi.org/
Diekmann, B., 2007. Sedimentary patterns in the late Quaternary Southern Ocean. Deep Sea Research, Part II: Topical Studies in Oceanography, 54(21–22):2350–2366. https://doi.org/
Donohue, K.A., Tracey, K.L., Watts, D.R., Chidichimo, M.P., and Chereskin, T.K., 2016. Mean Antarctic Circumpolar Current transport measured in Drake Passage. Geophysical Research Letters, 43(22):11760–11767. https://doi.org/
Eagles, G., 2006. Deviations from an ideal thermal subsidence surface in the southern Pacific Ocean. Terra Antarctica Reports, 12:109–118.
Expedition 318 Scientists, 2010. Expedition 318 Preliminary Report: Wilkes Land Glacial History. Integrated Ocean Drilling Program. https://doi.org/
Ferrari, R., Provost, C., Park, Y.-H., Sennéchael, N., Koenig, Z., Sekma, H., Garric, G., and Bourdallé-Badie, R., 2014. Heat fluxes across the Antarctic Circumpolar Current in Drake Passage: mean flow and eddy contributions. Journal of Geophysical Research: Oceans, 119(9):6381–6402. https://doi.org/
Florindo, F., Nelson, A.E., and Haywood, A.M., 2008. Introduction to “Antarctic cryosphere and Southern Ocean climate evolution (Cenozoic–Holocene).” Palaeogeography, Palaeoclimatology, Palaeoecology, 260(1–2):1–7. https://doi.org/
Frank, M., Gersonde, R., van der Loeff, M.R., Bohrmann, G., Nürnberg, C.C., Kubik, P.W., Suter, M., and Mangini, A., 2000. Similar glacial and interglacial export bioproductivity in the Atlantic sector of the Southern Ocean: multiproxy evidence and implications for glacial atmospheric CO2. Paleoceanography and Paleoclimatology, 15(6):642–658. https://doi.org/10.1029/
Gersonde, R., 2011. The Expedition of the Research Vessel “Polarstern” to the Polar South Pacific Sea in 2009/2010 (ANT-XXVI/2 - BIPOMAC). Berichte zur Polar und Meeresforschung, 632. http://epic.awi.de/
Gersonde, R., Abelmann, A., Brathauer, U., Becquey, S., Bianchi, C., Cortese, G., Grobe, H., Kuhn, G., Niebler, H.-S., Segl, M., Sieger, R., Zielinski, U., and Fütterer, D.K., 2003. Last glacial sea surface temperatures and sea-ice extent in the Southern Ocean (Atlantic-Indian sector): a multiproxy approach. Paleoceanography and Paleoclimatology, 18(3):1061. https://doi.org/
Gersonde, R., Crosta, X., Abelmann, A., and Armand, L., 2005. Sea-surface temperature and sea ice distribution of the Southern Ocean at the EPILOG Last Glacial Maximum—a circum-Antarctic view based on siliceous microfossil records. Quaternary Science Reviews, 24(7–9):869–896. https://doi.org/
Gordon, A.L., 1986. Interocean exchange of thermocline water. Journal of Geophysical Research: Oceans, 91(C4):5037–5046. https://doi.org/
Hain, M.P., Sigman, D.M., and Haug, G.H., 2010. Carbon dioxide effects of Antarctic stratification, North Atlantic Intermediate Water formation, and subantarctic nutrient drawdown during the last ice age: diagnosis and synthesis in a geochemical box model. Global Biogeochemical Cycles, 24(4):GB4023. https://doi.org/
Hall, I.R., Hemming, S.R., and LeVay, L.J., 2015. Expedition 361 Scientific Prospectus: South African Climates (Agulhas LGM Density Profile). International Ocean Discovery Program. https://doi.org/
Hall, I.R., McCave, I.N., Shackleton, N.J., Weedon, G.P., and Harris, S.E., 2001. Intensified deep Pacific inflow and ventilation in Pleistocene glacial times. Nature, 412(6849):809–812. https://doi.org/
Hayes, C.T., Martínez-García, A., Hasenfratz, A.P., Jaccard, S.L., Hodell, D.A., Sigman, D.M., Haug, G.H., and Anderson, R.F., 2014. A stagnation event in the deep South Atlantic during the last interglacial period. Science, 346(6216):1514–1517. https://doi.org/
Hilgen, F.J., Lourens, L.J., and Van Dam, J.A., 2012. The Neogene period. With contributions by A.G. Beu, A.F. Boyes, R.A. Cooper, W. Krijgsman, J.G. Ogg, W.E. Piller, and D.S. Wilson. In Gradstein, F.M., Ogg, J.G., Schmitz, M.D., and Ogg, G.M. (Eds.), The Geologic Time Scale: Oxford, United Kingdom (Elsevier), 923–978. https://doi.org/
Hillenbrand, C.-D., and Cortese, G., 2006. Polar stratification: a critical view from the Southern Ocean. Palaeogeography, Palaeoclimatology, Palaeoecology, 242(3–4):240–252. https://doi.org/
Ho, S.L., Mollenhauer, G., Lamy, F., Martínez-Garcia, A., Mohtadi, M., Gersonde, R., Hebbeln, D., Nunez-Ricardo, S., Rosell-Melé, A., and Tiedemann, R., 2012. Sea surface temperature variability in the Pacific sector of the Southern Ocean over the past 700 kyr. Paleoceanography and Paleoclimatology, 27(4):PA4202. https://doi.org/
Iversen, N., and Jorgensen, B.B., 1985. Anaerobic methane oxidation rates at the sulfate-methane transition in marine sediments from Kattegat and Skagerrak (Denmark). Limnology and Oceanography, 30(5):944–955. https://doi.org/
Jaccard, S.L., Hayes, C.T., Martínez-García, A., Hodell, D.A., Anderson, R.F., Sigman, D.M., and Haug, G.H., 2013. Two modes of change in Southern Ocean productivity over the past million years. Science, 339(6126):1419–1423. https://doi.org/
Kaiser, J., and Lamy, F., 2010. Links between Patagonian Ice Sheet fluctuations and Antarctic dust variability during the last glacial period (MIS 4–2). Quaternary Science Reviews, 29(11–12):1464–1471. https://doi.org/
Kanfoush, S.L., Hodell, D.A., Charles, C.D., Janecek, T.R., and Rack, F.R., 2002. Comparison of ice-rafted debris and physical properties in ODP Site 1094 (South Atlantic) with the Vostok ice core over the last four climate cycles. Palaeogeography, Palaeoclimatology, Palaeoecology, 182(3–4):329–349. https://doi.org/
Kawabe, M., and Fujio, S., 2010. Pacific Ocean circulation based on observation. Journal of Oceanography, 66(3):389–403. https://doi.org/
Knorr, G., and Lohmann, G., 2003. Southern Ocean origin for the resumption of Atlantic thermohaline circulation during deglaciation. Nature, 424(6948):532–536. https://doi.org/
Koenig, Z., Provost, C., Ferrari, R., Sennéchael, N., and Rio, M.-H., 2014. Volume transport of the Antarctic Circumpolar Current: production and validation of a 20 year long time series obtained from in situ and satellite observations. Journal of Geophysical Research: Oceans, 119(8):5407–5433. https://doi.org/
Kohfeld, K.E., Graham, R.M., de Boer, A.M., Sime, L.C., Wolff, E.W., Le Quéré, C., and Bopp, L., 2013. Southern Hemisphere westerly wind changes during the Last Glacial Maximum: paleo-data synthesis. Quaternary Science Reviews, 68:76–95. https://doi.org/
Kohfeld, K.E., Le Quéré, C., Harrison, S.P., and Anderson, R.F., 2005. Role of marine biology in glacial–interglacial CO2 cycles. Science, 308(5718):74–78. https://doi.org/
Kuhlbrodt, T., Griesel, A., Montoya, M., Levermann, A., Hofmann, M., and Rahmstorf, S., 2007. On the driving processes of the Atlantic meridional overturning circulation. Reviews of Geophysics, 45(2):RG2001. https://doi.org/
Kumar, N., Anderson, R.F., Mortlock, R.A., Froelich, P.N., Kubik, P., Dittrich-Hannen, B., and Suter, M., 1995. Increased biological productivity and export production in the glacial Southern Ocean. Nature, 378(6558):675–680. https://doi.org/
Lamy, F., 2016. The Expedition PS97 of the Research Vessel POLARSTERN to the Drake Passage in 2016. Berichte zur Polar und Meeresforschung, 701. http://epic.awi.de/
Lamy, F., Arz, H.W., Kilian, R., Lange, C.B., Lembke-Jene, L., Wengler, M., Kaiser, J., et al., 2015. Glacial reduction and millennial-scale variations in Drake Passage throughflow. Proceedings of the National Academy of Sciences of the United States of America, 112(44):13496–13501. https://doi.org/
Lamy, F., Gersonde, R., Winckler, G., Esper, O., Jaeschke, A., Kuhn, G., Ullermann, J., Martinez-Garcia, A., Lambert, F., and Kilian, R., 2014. Increased dust deposition in the Pacific Southern Ocean during glacial periods. Science, 343(6169):403–407. https://doi.org/
Lamy, F., Kaiser, J., Arz, H.W., Hebbeln, D., Ninnemann, U., Timm, O., Timmermann, A., and Toggweiler, J.R., 2007. Modulation of the bipolar seesaw in the southeast Pacific during Termination 1. Earth and Planetary Science Letters, 259(3–4):400–413. https://doi.org/
Lamy, F., Kaiser, J., Ninnemann, U., Hebbeln, D., Arz, H.W., and Stoner, J., 2004. Antarctic timing of surface water changes off Chile and Patagonian Ice Sheet response. Science, 304(5679):1959–1962. https://doi.org/
Lea, D.W., Pak, D.K., Belanger, C.L., Spero, H.J., Hall, M.A., and Shackleton, N.J., 2006. Paleoclimate history of Galápagos surface waters over the last 135,000 yr. Quaternary Science Reviews, 25(11–12):1152–1167. https://doi.org/
Liu, Z., Shin, S.-I., Otto-Bliesner, B., Kutzbach, J.E., Brady, E.C., and Lee, D.E., 2002. Tropical cooling at the Last Glacial Maximum and extratropical ocean ventilation. Geophysical Research Letters, 29(10):48-1–48-4. https://doi.org/
Lorrey, A.M., Vandergoes, M., Almond, P., Renwick, J., Stephens, T., Bostock, H., Mackintosh, A., et al., 2012. Palaeocirculation across New Zealand during the Last Glacial Maximum at ~21 ka. Quaternary Science Reviews, 36:189–213. https://doi.org/
Lynch-Stieglitz, J., Ito, T., and Michel, E., 2016. Antarctic density stratification and the strength of the circumpolar current during the Last Glacial Maximum. Paleoceanography and Paleoclimatology, 31(5):539–552. https://doi.org/
Maksym, T., Stammerjohn, S.E., Ackley, S., and Massom, R., 2012. Antarctic sea ice—a polar opposite? Oceanography, 25(3):140–151. https://doi.org/
Marshall, J., and Speer, K., 2012. Closure of the meridional overturning circulation through Southern Ocean upwelling. Nature Geoscience, 5(3):171–180. https://doi.org/
Martin, J.H., 1990. Glacial–interglacial CO2 change: the iron hypothesis. Paleoceanography and Paleoclimatology, 5(1):1–13. https://doi.org/
Martínez-Garcia, A., Rosell-Melé, A., Geibert, W., Gersonde, R., Masqué, P., Gaspari, V., and Barbante, C., 2009. Links between iron supply, marine productivity, sea surface temperature, and CO2 over the last 1.1 Ma. Paleoceanography and Paleoclimatology, 24(1):PA1207. https://doi.org/
Martínez-Garcia, A., Rosell-Melé, A., Jaccard, S.L., Geibert, W., Sigman, D.M., and Haug, G.H., 2011. Southern Ocean dust–climate coupling over the past four million years. Nature, 476(7360):312–315. https://doi.org/
Martínez-Garcia, A., Rosell-Melé, A., McClymont, E.L., Gersonde, R., and Haug, G.H., 2010. Subpolar link to the emergence of the modern equatorial Pacific cold tongue. Science, 328(5985):1550–1553. https://doi.org/
Martínez-Garcia, A., Sigman, D.M., Ren, H., Anderson, R.F., Straub, M., Hodell, D.A., Jaccard, S.L., Eglinton, T.I., and Haug, G.H., 2014. Iron fertilization of the Subantarctic Ocean during the Last Ice Age. Science, 343(6177):1347–1350. https://doi.org/
Mazaud, A., Michel, E., Dewilde, F., and Turon, J.L., 2010. Variations of the Antarctic Circumpolar Current intensity during the past 500 ka. Geochemistry, Geophysics, Geosystems, 11(8):Q08007. https://doi.org/
McCartney, M.S., 1977. Subantarctic mode water. In Angel, M. (Ed.), A Voyage of Discovery: George Deacon 70th Anniversary Volume. Deep-Sea Research and Oceanographic Abstracts, 24:103–119.
McCave, I.N., Crowhurst, S.J., Kuhn, G., Hillenbrand, C.D., and Meredith, M.P., 2014. Minimal change in Antarctic Circumpolar Current flow speed between the last glacial and Holocene. Nature Geoscience, 7(2):113–116. https://doi.org/
McKay, R., Naish, T., Carter, L., Riesselman, C., Dunbar, R., Sjunneskog, C., Winter, D., et al., 2012. Antarctic and Southern Ocean influences on late Pliocene global cooling. Proceedings of the National Academy of Sciences of the United States of America, 109(17):6423–6428. https://doi.org/
McManus, J.F., Oppo, D.W., and Cullen, J.L., 1999. A 0.5-million-year record of millennial-scale climate variability in the North Atlantic. Science, 283(5404):971–975. https://doi.org/
Meijers, A.J.S., 2014. The Southern Ocean in the Coupled Model Intercomparison Project Phase 5. Philosophical Transactions of the Royal Society, A: Mathematical, Physical & Engineering Sciences, 372(2019):20130296. https://doi.org/
Meredith, M.P., Woodworth, P.L., Chereskin, T.K., Marshall, D.P., Allison, L.C., Bigg, G.R., Donohue, K., et al., 2011. Sustained monitoring of the Southern Ocean at Drake Passage: past achievements and future priorities. Reviews of Geophysics, 49(4):RG4005. https://doi.org/
Naafs, B.D.A., Hefter, J., and Stein R., 2013. Millennial-scale ice rafting events and Hudson Strait Heinrich(-like) events during the late Pliocene and Pleistocene: a review. Quaternary Science Reviews, 80:1–28. https://doi.org/
Naish, T.R., Powell, R., Levy, R., Wilson, G., Scherer, R., Talarico, F., Krissek, L., et al., 2009. Obliquity-paced Pliocene West Antarctic Ice Sheet oscillations. Nature, 458(7236):322–329. https://doi.org/
Orsi, A.H., Whitworth III, T., and Nowlin, W.D., Jr., 1995. On the meridional extent and fronts of the Antarctic Circumpolar Current. Deep-Sea Research, Part I: Oceanographic Research Papers, 42(5):641–673. https://doi.org/
Pahnke, K., Zahn, R., Elderfield, H., and Schulz, M., 2003. 340,000-year centennial-scale marine record of Southern Hemisphere climatic oscillation. Science, 301(5635):948–952. https://doi.org/
Paolo, F.S., Fricker, H.A., and Padman, L., 2015. Volume loss from Antarctic ice shelves is accelerating. Science, 348(6232):327–331. https://doi.org/
Parrenin, F., Masson-Delmotte, V., Köhler, P., Raynaud, D., Paillard, D., Schwander, J., Barbante, C., Landais, A., Wegner, A., and Jouzel, J., 2013. Synchronous change of atmospheric CO2 and Antarctic temperature during the Last Deglacial Warming. Science, 339(6123):1060–1063. https://doi.org/
Pena, L.D., Cacho, I., Ferretti, P., and Hall, M.A., 2008. El Niño-Southern Oscillation-like variability during glacial terminations and interlatitudinal teleconnections. Paleoceanography and Paleoclimatology, 23(3):PA3101. https://doi.org/
Pitman, W.C., and Heirtzler, J.R., 1966. Magnetic anomalies over the Pacific-Antarctic Ridge. Science, 154(3753):1164–1171. https://doi.org/
Pollard, D., and DeConto, R.M, 2009. Modelling West Antarctic Ice Sheet growth and collapse through the past five million years. Nature, 458(7236):329–332. https://doi.org/
Polonia, A., Torelli, L., Brancolini, G., and Loreto, M.-F., 2007. Tectonic accretion versus erosion along the southern Chile Trench: oblique subduction and margin segmentation. Tectonics, 26(3):TC1983. https://doi.org/
Reid, J.L., and Lynn, R.J., 1971. On the influence of the Norwegian-Greenland and Weddell Seas upon the bottom waters of the Indian and Pacific Oceans. Deep Sea Research and Oceanographic Abstracts, 18(11):1063–1088. https://doi.org/
Renault, A., Provost, C., Sennéchael, N., Barré, N., and Kartavtseff, A., 2011. Two full-depth velocity sections in the Drake Passage in 2006—transport estimates. Deep Sea Research, Part II: Topical Studies in Oceanography, 58(25–26):2572–2591. https://doi.org/
Reynolds, R.W., Rayner, N.A., Smith, T.M., Stokes, D.C., and Wang, W., 2002. An improved in situ and satellite SST analysis for climate. Journal of Climate, 15(13):1609–1625. https://doi.org/
Reynolds, R.W., Smith, T.M., Liu, C., Chelton, D.B., Casey, K.S., and Schlax, M.G., 2007. Daily high-resolution-blended analyses for sea surface temperature. Journal of Climate, 20(22):5473–5496. https://doi.org/
Rincon-Martinez, D., Contreras, S., Lamy, F., and Tiedemann, R., 2009. Are glacials (interglacial) in the easternmost Pacific Ocean drier (wetter) during the last 300 000 years? In Awards Ceremony Speeches and Abstracts of the 19th Annual V.M. Goldschmidt Conference. Geochimica et Cosmochimica Acta, 73(13S):A1102. https://doi.org/
Robinson, R.S., and Sigman, D.M., 2008. Nitrogen isotopic evidence for a poleward decrease in surface nitrate within the ice age Antarctic. Quaternary Science Reviews, 27(9–10):1076–1090. https://doi.org/
Ronge, T.A., Tiedemann, R., Lamy, F., Köhler, P., Alloway, B.V., De Pol-Holz, R., Pahnke, K., Southon, J., and Wacker, L., 2016. Radiocarbon constraints on the extent and evolution of the South Pacific glacial carbon pool. Nature Communications, 7:11487. https://doi.org/
Sigman, D.M., and Boyle, E.A., 2000. Glacial/interglacial variations in atmospheric carbon dioxide. Nature, 407(6806):859–869. https://doi.org/
Sigman, D.M., Hain, M.P., and Haug, G.H., 2010. The polar ocean and glacial cycles in atmospheric CO2 concentration. Nature, 466(7302)47–55. https://doi.org/
Sigman, D.M., Jaccard, S.L., and Haug, G.H., 2004. Polar ocean stratification in a cold climate. Nature, 428(6978):59–63. https://doi.org/
Sloyan, B.M., and Rintoul, S.R., 2001. Circulation, renewal, and modification of Antarctic Mode and Intermediate Water. Journal of Physical Oceanography, 31(4):1005–1030. https://doi.org/
Sokolov, S., and Rintoul, S.R., 2009. Circumpolar structure and distribution of the Antarctic Circumpolar Current fronts: 1. Mean circumpolar paths. Journal of Geophysical Research: Oceans, 114(C11):C11018. https://doi.org/
Stammerjohn, S., Massom, R., Rind, D., and Martinson, D., 2012. Regions of rapid sea ice change: an inter-hemispheric seasonal comparison. Geophysical Research Letters, 39(6):L06501. https://doi.org/
Steig, E.J., Ding, Q., Battisti, D.S., and Jenkins, A., 2012. Tropical forcing of Circumpolar Deep Water inflow and outlet glacier thinning in the Amundsen Sea Embayment, West Antarctica. Annals of Glaciology, 53(60):19–28. https://doi.org/
Studer, A.S., Sigman, D.M., Martínez-García, A., Benz, V., Winckler, G., Kuhn, G., Esper, O., et al., 2015. Antarctic Zone nutrient conditions during the last two glacial cycles. Paleoceanography and Paleoclimatology, 30(7):845–862. https://doi.org/
Sugden, D.E., McCulloch, R.D., Bory, A.J-M., and Hein, A.S., 2009. Influence of Patagonian glaciers on Antarctic dust deposition during the last glacial period. Nature Geoscience, 2(4):281–285. https://doi.org/
Talley, L.D., 2013. Closure of the global overturning circulation through the Indian, Pacific, and Southern Oceans: schematics and transports. Oceanography, 26(1):80–97. https://doi.org/
Teitler, L., Florindo, F., Warnke, D.A., Filippelli, G.M., Kupp, G., and Taylor, B., 2015. Antarctic Ice Sheet response to a long warm interval across marine isotope Stage 31: a cross-latitudinal study of iceberg-rafted debris. Earth and Planetary Science Letters, 409:109–119. https://doi.org/
Teitler, L., Warnke, D.A., Venz, K.C., Hodell, D.A., Becquey, S., Gersonde, R., and Teitler, W., 2010. Determination of Antarctic Ice Sheet stability over the last ~500 ka through a study of iceberg-rafted debris. Paleoceanography and Paleoclimatology, 25(1). https://doi.org/
Thompson, D.W.J., Solomon, S., Kushner, P.J., England, M.H., Grise, K.M., and Karoly, D.J., 2011. Signatures of the Antarctic ozone hole in Southern Hemisphere surface climate change. Nature Geoscience, 4(11):741–749. https://doi.org/
Turner, J., Comiso, J.C., Marshall, G.J., Lachlan-Cope, T.A., Bracegirdle, T., Maksym, T., Meredith, M.P., Wang, Z., and Orr, A., 2009. Non-annular atmospheric circulation change induced by stratospheric ozone depletion and its role in the recent increase of Antarctic sea ice extent. Geophysical Research Letters, 36(8):L08502. https://doi.org/
Venz, K.A., and Hodell, D.A., 2002. New evidence for changes in Plio–Pleistocene deep water circulation from Southern Ocean ODP Leg 177 Site 1090. Palaeogeography, Palaeoclimatology, Palaeoecology, 182(3–4):197–220. https://doi.org/
Well, R., and Roether, W., 2003. Neon distribution in South Atlantic and South Pacific waters. Deep-Sea Research, Part I: Oceanographic Research Papers, 50(6):721–735. https://doi.org/
Well, R., Roether, W., and Stevens, D.P., 2003. An additional deep-water mass in Drake Passage as revealed by 3He data. Deep Sea Research, Part I: Oceanographic Research Papers, 50(9):1079–1098. https://doi.org/
Yuan, X., 2004. ENSO-related impacts on Antarctic sea ice: a synthesis of phenomenon and mechanisms. Antarctic Science, 16(4): 415–425. https://doi.org/
1 Winckler, G., Lamy, F., Alvarez Zarikian, C.A., Arz, H.W., Basak, C., Brombacher, A., Esper, O.M., Farmer, J.R., Gottschalk, J., Herbert, L.C., Iwasaki, S., Lawson, V.J., Lembke-Jene, L., Lo, L., Malinverno, E., Michel, E., Middleton, J.L., Moretti, S., Moy, C.M., Ravelo, A.C., Riesselman, C.R., Saavedra-Pellitero, M., Seo, I., Singh, R.K., Smith, R.A., Souza, A.L., Stoner, J.S., Venancio, I.M., Wan, S., Zhao, X., and Foucher McColl, N., 2021. Expedition 383 summary. In Lamy, F., Winckler, G., Alvarez Zarikian, C.A., and the Expedition 383 Scientists, Dynamics of the Pacific Antarctic Circumpolar Current. Proceedings of the International Ocean Discovery Program, 383: College Station, TX (International Ocean Discovery Program). https://doi.org/10.14379/iodp.proc.383.101.2021
2 Expedition 383 Scientists’ affiliations.
This work is distributed under the Creative Commons Attribution 4.0 International (CC BY 4.0) license. 